SUMMARY
Objective: To verify the prevalence of obesity, systemic arterial hypertension (SAH), waist circumference and acanthosis nigricans (AN) in school children from Sorocaba, in 2009 and associate them with risk factors. Methods: A probabilistic sample study was carried out with 680 children (7-11 years) from 13 public schools from the city of Soro-caba, SP. A questionnaire containing questions on physical activity, time spent watching television, playing with videogames and computers (TV/VG/PC), student and parental antecedents of arterial hypertension, renal or cardiac disease, and economic level was applied. On physical examination, weight, height, waist circumference (WC) and blood pressure (BP) were measured; presence of AN was observed. he prevalence of nutri-tional disorders, SAH, WC increase and presence of AN were calculated. To associate body mass index (BMI) ≥ P85 and BP ≥ P90 with the other variables, chi-square or Fisher’s exact test (signiicance p < 0.05) and crude and adjusted prevalence odds ratio (POR) were used. Results: he prevalence of BMI ≥ P85 was 22.1% [95% CI: 19.0-25.3%], of BP ≥ P90 10.9% [95% CI: 8.6-13.5%], increased WC 15.4% [95% CI: 12.9-17.9%] and AN 3.8% [95% CI: 2.6-5.6%]. Paternal antecedents were associated with weight excess in both analysis (POR: 1.76; 95% CI: 1.05-2.95; p = 0.02). High blood pressure was as-sociated with female sex (POR: 1.90; 95% CI: 1.12-3.23; p = 0.01), more time spent with TV/VG/PC (POR: 1.82; 95% CI: 1.00-3.36; p = 0.03), AN (POR: 8.18; 95% CI: 3.37-19.80; p < 0.00), obesity (POR: 4.09; 95% CI: 2.41-6.94; p < 0.00) and WC (POR: 4.83; 95% CI: 2.77-8.41; p < 0.00). Ater the multivariate analysis, the female sex (adjusted POR = 2.15; 95% CI: 1.17-3.93) and obesity (adjusted POR = 9.51; 95% CI: 4.77-18.97) remained. Conclusion: he prevalence of weight excess, SAH, increased WC and AN in these school children was relevant. his fact justiies the use of these measurements.
Keywords: Obesity; hypertension; waist circumference; acanthosis nigricans. Study conducted at Faculdade de
Ciências Médicas, Universidade Estadual de Campinas (FCM-UNICAMP), Campinas, SP, Brazil
Submitted on: 05/10/11 Approved on: 09/19/11
Correspondence to: Mariana Porto Zambon Rua Botafogo, 151/491 CEP: 13104-064 Campinas, SP, Brazil Phone: +55 (19) 3788-7023
+55 (19) 3258-5150 [email protected]
Conflict of interest: None.
©2011 Elsevier Editora Ltda. All rights reserved.
Obesity and cardiovascular risk factors in school children from
Sorocaba, SP
ISABELA ANNUNZIATO RAMOS MAZARO1, MARIADE LURDES ZANOLLI2, MARIA ÂNGELA R.G.M. ANTONIO2, ANDRÉ MORENO MORCILLO3,
MARIANA PORTO ZAMBON2
1 Pediatrician;MSc Student; Postgraduate Course on Child and Adolescent Health, Faculdade de Ciências Médicas, Universidade Estadual de Campinas (FCM-UNICAMP), Campinas,
SP, Brazil
INTRODUCTION
Obesity, currently considered a public health problem, is a chronic, multifactorial disease that sufers the inluence and interaction of several behavioral, environmental and genetic factors. Complications can occur as early as the pe-diatric age range, especially cardiovascular and metabolic ones such as diabetes mellitus type 21.
he body mass index (BMI), although it does not mea-sure the distribution of fat, is the most widely used method in clinical practice for the diagnosis of obesity. he distri-bution of fat, with a predominance of visceral fat, is related to cardiovascular complications. he waist circumference has been proposed in population studies as an assessment method, including for the pediatric age range2.
he prevalence of systemic arterial hypertension (SAH) in children has increased, mainly due to its associa-tion with obesity. Its presence in an early age range predis-poses to its continuation into adulthood. High blood pres-sure can cause the development of coronary artery disease, stroke, seizures, heart and kidney failure3.
Acanthosis nigricans (AN) is a skin condition charac-terized by darkening and thinning of the skin in speciic regions, with one of the most important regions being the posterior part of the neck4. It is associated with obesity and
metabolic alterations such as insulin resistance and diabe-tes mellitus5-7.
Due to the increasing prevalence of obesity and its complications, the aim of this study was to determine the prevalence and associated risk factors of obesity, hyper-tension, increased waist circumference and the presence of AN in school children aged 7 to 11 years in the city of Sorocaba – SP, in 2009.
METHODS
his was a cross-sectional, descriptive and analytic study of a random sample of 680 students from municipal schools in the city of Sorocaba (São Paulo), carried out in 2009. At that time, Sorocaba had approximately 610,000 inhabit-ants, of which 42,278 were school children attending 1st to
4th grades of elementary school. From these 23,000 were
enrolled in 37 public schools8.
To determine the size of the sample, we took into ac-count an estimated prevalence of overweight and obesity in a community of 20.0%1, α = 5% and an absolute
preci-sion of 3%, resulting in 680 subjects9.
he selection of individuals occurred in two stages: irst, the schools were identiied and randomly selected by region according to geographic division and sector classii-cation of income distribution adopted by the Department of Housing, Urbanism and Environment of Sorocaba: Northeast (NE), North (N), Northwest (NO), West (W), south (S) and East (E). In the second stage, 680 children were selected by probabilistic sampling in the previously determined 13 schools.
he Free and Informed Consent Form (FICF) and a questionnaire were sent to randomly selected students, and those who did not ill them out ater 3 attempts or who missed the day of the clinical examination were excluded and replaced by previously selected alternatives.
he school children were submitted to clinical exami-nation ater consent was given by parents (or tutors) and ater the latter answered the questionnaires. Examinations were performed by the study researcher, previously trained in the school premises so as not to disturb the students’ routines. We excluded children younger than seven years and older than 11 years, the ones in whom it was impos-sible to perform measurements and girls with a history of menarche.
he evaluation of the history of personal or family risk was carried out by means of a questionnaire, which asked about the presence of hypertension, kidney and heart dis-ease in children and parents separately, and considered as positive the presence of at least one airmative answer to any one of the three items. Participants were also asked about the practice of physical activity, daily time in hours spent watching television (TV), playing video games (VG) or in front of the computer (PC). he economic classiica-tion was made according to the criteria of the Brazilian Association of Research Companies (ABEP), which uses a score system for possession of items and level of education of the household head, ranging from A to E10.
he regions were regrouped into S-E-NE and W-N-NW, with the irst representing the lowest poverty rate; and the economic classiication was established as AB, C and DE due to the small number of students in the ex-treme categories. he time spent with the TV, PC and VG was classiied as more or less than two hours per day11.
he clinical examination included measurements of weight, height and waist circumference12 and two blood
pressure (BP) measurements using a mercury column por-table device – PLUS 005, UNITEC, at the beginning and the end of examination, with an interval of two to three minutes between measurements. he BP measurement was taken in the right arm with the child sitting at rest, using cufs of appropriate sizes. he employed method was the auscultatory one, with the systolic and diastolic pres-sures corresponding to Korotkof phases I and V13. he
mean BP was obtained with the two BP measurements. AN was investigated in the posterior region of the neck and considered present or absent4.
BMI was calculated based on the measured weight and height and nutritional status was classiied according to WHO, considering as overweight a BMI between the 85th
(P85) and 95 th (P
95) percentile and as obesity a BMI ≥ P95,
according to the CDC14. For waist circumference (WC)
BP was analyzed according to age, sex and height, be-ing considered normal if systolic BP (SBP) and diastolic BP (DBP) were < 90th percentile (P
90). Prehypertension
was deined when SBP and/or DBP were ≥ P90 and < P95
or ≥ 120 × 80 mmHg and hypertension when SBP or DBP were ≥ P9513.
he prevalence of overweight, obesity, prehyperten-sion and hypertenprehyperten-sion was determined. Students with overweight and obesity were grouped together and called “excess weight” (BMI ≥ P85), as well as those with
prehy-pertension and hyprehy-pertension, called “high BP” (BP ≥ P90), as they were at-risk groups.
To evaluate the association of BMI ≥ P85 and BP ≥ P90 with gender, age group, region, socioeconomic level, per-sonal, paternal and maternal history, physical activity and time spent with TV/VG/PC, we used the chi-square or Fisher’s exact test. We also assessed the association be-tween BP ≥ P90 with the presence of AN, nutritional
sta-tus and waist circumference. he crude prevalence odds ratio (POR) was carried out using EpiInfo version 6.04b. he adjusted POR was determined by multivariate logis-tic regression, using the forward stepwise method (Wald) with the SPSS sotware, version 16.0 (SPSS Inc., Chicago, IL, USA) and all the variables that in the bivariate analysis showed p < 0.20 were selected for inclusion in the model.
he study was approved by the Ethics Committee of the Faculdade de Ciências Médicas of Universidade Es-tadual de Campinas on September 23, 2008, with protocol # 737/2008 (CAAE: 3176.0.000.146-08).
RESULTS
Of the 680 students enrolled in the study aged 7 to 11 years, 347 (51.0%) were females, 304 (44.7%) came from the South, East and Northeast regions, 376 (55.3%) came from the West, North and Northwest regions. As for the economic classiication, 166 (25.8%) were classes A and B, 376 (58.4%) class C and 102 (15.8%) were classes D and E (Table 1).
Only 171 (27.1%) answered that they practiced physi-cal activity. he mean daily time devoted to activities with TV/VG/PC was 3.5 hours, and 226 (35.0%) of them re-ported fewer than 2 hours. he presence of personal his-tory was 3.1% among students, 16.1% among the fathers and 17.8% among the mothers (Table 2).
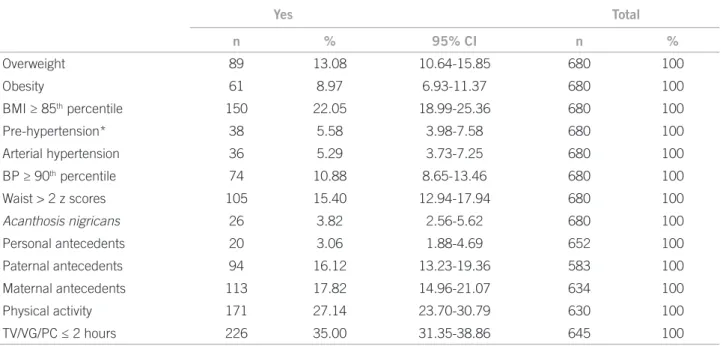
he prevalence of obesity was 9.0% [95% CI: 6.9-11.4%] and 13.1% of overweight [95% CI: 10.6-15.9%]. When we consider the prevalence of excess weight, it was 22.1% [95% CI: 19.0-25.4] (Table 2).
An association was observed in the group with BMI ≥ P85 only with the presence of paternal history
(POR = 1.76, 95% CI: 1.05-2.95, p = 0.02) (Table 3). For the multivariate analysis, the variables considered were: pater-nal history (p = 0.02), region (p = 0.19), time spent with
television, computer or video game (p = 0.13) and socio-economic level (p category DE = 0.14). Only the paternal history remained in the model (POR adjusted = 1.89, 95% CI: 1.11-3.23).
he z score of waist measurement was > 2 in 15.4% of the cases, being 94.3% of them in the excess weight group. AN was observed in 26 (3.8%) patients, 24 (92.3%) of whom had excess weight (Table 2).
he prevalence of arterial hypertension was 5.3% [95% CI: 3.7-7.3%] and prehypertension was 5.6% [95% CI: 4.0-7.6%]. Considering the group with high blood pressure, the prevalence was 10.9% [95% CI: 8.7-13.5%] (Table 2).
With BP ≥ P90, there was an association with the fe-male sex (POR = 1.90, 95% CI: 1.12-3.23, p = 0.01), with time spent with TV, PC or VG for more than 2 hours per day (POR = 1.82, 95% CI: 1.00-3.36, p = 0.03), presence of AN (POR = 8.18, 95% CI: 3.37-19.80, p < 0.00), obe-sity (POR = 4.09, 95% CI: 2.41-6.94, p < 0.00) and waist z score > 2 (POR = 4.83, 95% CI: 2.77-8.41, p < 0.00) (Ta-ble 4). Ater the multivariate analysis, sex and obesity re-mained in the model. he risk is 2.15-fold higher for females (POR adjusted = 2.15, 95% CI: 1.17-3.93) and 9.51-fold high-er in the obese (POR adjusted = 9.51, 95% CI: 4.77–18.97).
DISCUSSION
Sorocaba (SP) has good levels of urban development, in parallel with the disordered growth of the peripheral regions8. herefore, changes in lifestyle, including eating
and activity habits may be responsible for the high preva-lence of excess weight (22.1%), increased waist circumfer-ence (15.4%), high BP (10.9%) and prescircumfer-ence of AN (3.8%). Students with these alterations were notiied through the school by the researcher to seek proper medical guidance. Table 1 – Distribution regarding sex, age, region and socioeconomic status
n %
Sex
Male 333 49.0
Female 347 51.0
Age (years)
7├ 8 130 19.1
8├ 9 160 23.5
9├ 10 137 20.1
10├ 11 190 27.9
11├ 12 63 9.3
Region
S L NE 304 44.7
O N NW 376 55.3
Socioeconomic status
A B 166 25.8
C 376 58.4
D E 102 15.8
Yes Total
n % 95% CI n %
Overweight 89 13.08 10.64-15.85 680 100
Obesity 61 8.97 6.93-11.37 680 100
BMI ≥ 85th percentile 150 22.05 18.99-25.36 680 100
Pre-hypertension* 38 5.58 3.98-7.58 680 100
Arterial hypertension 36 5.29 3.73-7.25 680 100
BP ≥ 90th percentile 74 10.88 8.65-13.46 680 100
Waist > 2 z scores 105 15.40 12.94-17.94 680 100
Acanthosis nigricans 26 3.82 2.56-5.62 680 100
Personal antecedents 20 3.06 1.88-4.69 652 100
Paternal antecedents 94 16.12 13.23-19.36 583 100
Maternal antecedents 113 17.82 14.96-21.07 634 100
Physical activity 171 27.14 23.70-30.79 630 100
TV/VG/PC ≤ 2 hours 226 35.00 31.35-38.86 645 100
BMI, body mass index; CI, conidence interval; TV/VG/PC, time spent with television/videogame/computer; *pre-hypertensive and hypertensive patients.
Table 2 – Alterations in nutritional status, pressure levels and risk factors
Table 3 – Prevalence odds ratio in children with BMI ≥ 85th percentile
BMI ≥ 85th percentile
BMI < 85th
percentile POR 95% CI p
Sex
Male 72 261 0.95 0.65-1.39 0.78*
Female 78 269 1
Age
7├ 8 27 103 1
8├ 9 34 126 1.03 0.56-1.89 0.92*
9├ 10 37 100 1.41 0.77-2.59 0.23*
10├ 11 41 149 1.05 0.59-1.88 0.86*
11├ 12 11 52 0.81 0.34-1.86 0.58*
Region
S L NE 74 230 1
O N NW 76 300 0.79 0.54-1.15 0.19*
Socioeconomic status
A B 42 124 1
C 80 296 0.80 0.51-1.25 0.30*
D E 18 84 0.63 0.33-1.22 0.14*
Personal antecedents
Yes 4 16 0.85 0.24-2.75 0.51**
No 144 488 1
Paternal antecedents
Yes 29 65 1.76 1.05-2.95 0.02*
No 99 390 1
Maternal antecedents
Yes 29 84 1.26 0.77-2.07 0.33*
No 112 409 1
Physical activity
Yes 36 135 1
No 109 350 1.17 0.75-1.83 0.47*
TV/VG/PC
≤ 2h 43 183 1
> 2h 101 318 0.74 0.49-1.12 0.13*
According to the WHO classiication and consider-ing the CDC 2000 curve, public school students aged 7 to 11 years, had respectively 13.1 and 9.0% of overweight and obesity, results similar to those of Martin et al.16, who
obtained an average of 12.2 and 10.1% of overweight and obesity, respectively, in school children of Sorocaba in 2006. his is a slightly lower prevalence than the one ob-served in Brazil, where a signiicant increase in overweight (34.8% in boys and 32.0% in girls) and obesity (16.6% in boys and 11.8 % in girls) has been observed in children between 5 and 9 years of age17.
Studies on the prevalence of obesity in other countries have shown 16.8% and 3.6% of overweight and obesity, re-spectively, in Germany18 and 20% and 6% respectively in
Northern Italy19. In the U.S., rates are higher, as
demon-strated by a study carried out between 2007-2008, which showed 14.5% of BMI > P97, 19.6% > P95 and 35.5% > P85 in children aged 6 to 11 years20.
his study showed no association between obesity and gender, as in the study by Nagel et al.18. A national study
in children showed a higher prevalence of overweight and obesity in boys; in adults, the prevalence rates were similar Table 4 – Prevalence odds ratio in children with BP ≥ 90th percentile
BP ≥ 90th percentile
BP < 90th
percentile POR 95% CI p
Sex
Male 26 307 1
Female 48 299 1.90 1.12-3.23 0.01*
Age
7├ 8 15 115 1
8├ 9 16 144 0.85 0.38-1.91 0.67*
9├ 10 18 119 1.16 0.53-2.56 0.69*
10├ 11 18 172 0.80 0.37-1.76 0.55*
11├ 12 7 56 0.96 0.33-2.69 0.93*
Region
S L NE 32 272 1
O N NW 42 334 1.07 0.64-1.79 0.78*
Socioeconomic status
A B 20 146 1
C 45 331 0.99 0.55-1.81 0.97*
D E 7 95 0.54 0.20-1.41 0.17*
Personal antecedents
Yes 0 20
No 72 560
Paternal antecedents
Yes 13 81 1.35 0.67-2.69 0.36*
No 52 437 1
Maternal antecedents
Yes 13 100 0.93 0.47-1.85 0.81*
No 56 465 1
Physical activity
Yes 18 153 1
No 51 408 1.06 0.58-1.95 0.83*
TV/VG/PC
≤ 2 hours 17 209 1
> 2 hours 54 365 1.82 1.00-3.36 0.03*
Nutritional status
BMI < P85 38 492 1
BMI ≥ P85 36 114 4.09 2.41-6.94 0.00*
Waist circumference
z escore ≤ 2 44 531 1
z escore > 2 30 75 4.83 2.77-8.41 0.00*
Acanthosis nigricans
Yes 12 14 8.18 3.37-19.80 0.00**
No 62 592 1
in both genders, with an upward trend for the male sex and stability for the female sex17. A North-American study of
the increasing trend of obesity has shown that girls in the 80s-90s had a higher prevalence than boys, with no chang-es in the last decade, and that the prevalence in boys has increased, especially above the P97, equaling that of girls.
he study suggests that for the next years the prevalence of obesity tends to remain; however, with an increasing trend for more severe cases20.
Changes in diet, lifestyle habits and urbanization, which may be a relection of socioeconomic level, have led to an “obesogenic” environment1. It is believed that at the
same time, the social and economic pattern can distinctly inluence diferent populations21. his study observed no
association between socioeconomic status and place of residence as found by Martins et al.16, who observed more
children with excess weight in the regions of Sorocaba with lower poverty rates. Nagel et al.18 also showed the inluence
of migration and socioeconomic status on excess weight, probably due to cultural diferences and living standards.
Among the daily habits, the decrease in physical activity has been observed in parallel to longer periods spent watch-ing TV or playwatch-ing video games or uswatch-ing a computer, as vari-ables related to weight gain. his study grouped the three activities (TV, video games and computer); however, the importance of each one of them, separately, is undisputable and it is believed that watching TV has a greater inluence on weight gain by being more frequent in the population and due to the inluence of the media, which very oten ad-vertises calorie foods and drinks22.
he practice of physical activity (27.1%) and spending more than two hours a day watching TV, playing videogames and computer games (65%) were not associated with excess weight, probably due to the high mean time (3.5 hours/day) dedicated to sedentary activities. hese indings difer from those observed in the Brazilian study by Wells et al.23 and
in studies carried out in other countries18,24, when only the
time spent watching TV was accounted for.
he presence of paternal history of kidney disease, heart failure or hypertension was a factor associated with obesity among students. Knowing that this association occurs in adults with a history of obesity, this inding reinforces what was observed by Wardle et al.25, showing that increased
adiposity, assessed by the waist circumference and BMI in childhood and adolescence, has been related mainly to ge-netic factors, ater the obesity epidemics.
Regarding the WC, it was observed that the vast major-ity of students with WC measurements > 2 z scores were among those with excess weight, similar to what was found in other studies. he waist measurement evaluates the dis-tribution of fat in relation to the presence of visceral fat, and is indicated for population studies as it is easy to ob-tain and a low-cost procedure, when compared to the gold
standard, MRI, CT or dual-emission X-ray absorptiometry (DXA)2,15. One of the diiculties of its use is the comparison
with reference curves, as so far, there is no international stan-dard, and signiicant ethnic diferences have been observed15.
he presence of visceral fat is related to cardiovascular problems in adults, with few studies having been carried out with children. Recent studies have shown association with increased BP2,3 and better risk association when
com-pared to BMI26,27.
he prevalence of prehypertension (5.6%) and SAH (5.3%) was diferent from that reported by the Brazilian Society of Hypertension in children and adolescents, which is 2% and 13%, respectively28. However, it was similar to
the results obtained by Genovesi et al.19 in a cross-sectional
study of 5,131 children aged 5-11 years from northern Italy, which showed 2.7 and 3.4% of prehypertension and hyper-tension, respectively. However, a study with high school students (14-20 years) in Recife, state of Pernambuco, Bra-zil, showed a higher prevalence (17.3%) of hypertension29.
A U.S. population study showed a SAH trend in children from 1988-94 to 1999-2002, from 7.7% to 10.0% in the prehypertensive and 2.7% to 3.7% in hypertensive patients, mainly related to weight gain and increased WC30.
Between genders, hypertension was more prevalent in females (POR adjusted = 2.15, 95% CI: 1.17-3.93), as op-posed to other studies which showed a predominance of males29-31 and others that showed no diferences between
the sexes32.
he association between hypertension and obesity ob-served in the study (POR adjusted = 9.51, 95% CI:
4.77-18.97) has been described in several national studies and in other countries3,29-32. In Mexico, a high prevalence
(22.8%) of hypertension was obtained, associated mainly to abdominal circumference and obesity and unrelated to physical activity and time spent with TV and videogames3.
Beck et al.31, in a cross-sectional study, found an
associa-tion between WC and SAH in Brazilian adolescents, and suggested the evaluation of this anthropometric parameter as a measure of predisposition to blood pressure increase. AN was observed in small numbers of children (3.8%). ANprevalence of 19.4% was observed in the U.S. popula-tion between 7 and 65 years, which showed a higher risk for diabetes7. A recent study in American individuals of
varied ethnicity aged 7-17 years, with 32% of obesity, ob-served the presence of AN in 4% of Caucasians, 19% of African-Americans and 23% of Hispanics5.
he present study has two limitations. he question-naire answered by the parents or tutors lacked informa-tion on some variables, which can lead to data interpre- tation diiculties. In relation to blood pressure, even through the recommended techniques were used, as well as the mean of two measurements obtained on the same day, there may have been an increase in the number of children with high blood pressure. However, these indings are im-portant for screening and posterior follow-up, as sequential measurements would be needed for the diagnosis.
CONCLUSION
In this study, the high prevalence of obesity and over-weight and the lack of association with the studied factors make it diicult to identify at-risk students. his diagnosis is crucial in this age group, because studies show trends in which the prevalence of children with overweight and obesity has remained steady, being worse in those who al-ready have the problem17,20.
Concerning SAH, the high number of school children with high BP and the fact that it is associated with excess weight reinforce the importance of measuring it in all chil-dren, as previously recommended13. Waist measurement
and veriication of acanthosis nigricans can be included in pediatric evaluations. herefore, preventive measures such as the early diagnosis of overweight and its complications, nutritional guidelines and healthy lifestyle habits should be adopted for all children.
REFERENCES
1. World Health Organization. Population-based prevention strategies for childhood obesity. Report of the WHO forum and technical meet-ing. Geneva: WHO; 2009.
2. Genovesi S, Antolini L, Giussani M, Pieruzzi F, Galbiati S, Valsecchi MG, et al. Usefulness of waist circumference for the identiication of childhood hypertension. J Hypertens. 2008;26:1563-70.
3. Colín-Ramírez E, Castillo-Martínez L, Orea-Tejeda A, Romero ARV, Castañeda AV, Lafuente EA. Waist circumference and fat intake are associated with high blood pressure in mexican children aged 8 to 10 years. J Am Diet Assoc. 2009;109:996-1003.
4. Burke, JP Hale DE, Hazuda HP, Stern MP. A quantitative scale of acan-thosis nigricans. Diabetes Care. 1999; 22:1655-59.
5. Brickman WJ, Binns HJ, Jovanovic BD, Kolesky S, Mancini AJ, Metzger BE. Acanthosis nigricans: a common inding in overweight youth. Pe-diatr Dermatol. 2007; 24:601-6.
6. Brickman WJ, Huang J, Silverman BL, Metzger BE. Acanthosis nigri-cans identiies youth at high risk for metabolic abnormalities. J Pediatr. 2010;156:87-92.
7. Kong AS, Williams RL, Rhyne R, Urias-Sandoval V, Cardinali G, Weller NF, et al. Acanthosis Nigricans: high prevalence and association with diabetes in a Practice-based Research Network Consortium-A Primary care Multi-Ethnic Network (PRIME Net) Study. J Am Board Fam Med. 2010;23:476-85.
8. SEADE. Secretaria de Economia e Planejamento do Estado de São Paulo. Fundação Sistema Estadual de Análise de Dados. Peril munici-pal. [cited 2010 jul 5]. Available from: http://www.seade.gov.br/produ-tos/imp/index.php.
9. Lwanga SK, Lemeshow S. Sample size determination in health studies-a prstudies-acticstudies-al mstudies-anustudies-al. Genevstudies-a: WHO; 1991.
10. Associação Brasileira de Empresas de Pesquisa (ABEP). Critério de Classiicação Econômica da Associação Brasileira de Empresas de Pes-quisa. [cited 2009 Jan 21]. Available from: http://www.abep.org.
11. American Academy of Pediatrics. Committee on Public Education. Children, adolescents and television. Pediatrics. 2001;107:423-6 12. Lohman TG, Roche AF, Martorell R. Anthropometric standardization
reference manual. Abridged Edition. Champaign: Human Kinetics Books; 1988.
13. National High Blood Pressure Education Program Working Group on High Blood Pressure in Children and Adolescents. he fourth report on the diagnosis, evaluation, and treatment of high blood pressure in children and adolescents. Pediatrics. 2004;114:555-76.
14. Kuczmarski RJ, Ogden CL, GuoSS, Grummer-Strawn LM, Flegal KM, Mei Z, et al. 2000 CDC Growth Charts for the United States: methods and development. National Center for Health Statistics. Vital Health Stat 11. 2002;(246):1-190.
15. McCarthy HD, Jarrett KV, Crawley HF. he development of waist cir-cumference percentiles in British children aged 5.0 - 16.9y. Eur J Clin Nutr. 2001;55:902-7.
16. Martins CEB, Ribeiro RR, Barros Filho AA. Estado nutricional de es-colares segundo a localização geográica das escolas em Sorocaba, São Paulo. Rev Paul Pediatr. 2010;28:55-62.
17. IBGE. Instituto Brasileiro de Geograia e Estatística. Pesquisa de or-çamentos familiares. Antropometria e estado nutricional de crianças, adolescentes e adultos no Brasil. [cited 2010 Sep 1 set]. Available from: http://www.ibge.gov.br/home/estatistica/populacao/condicaodevida/ pof/2008_2009/default.shtm.
18. Nagel G, Wabitsch M, Galm C, Berg S, Brandstetter S, Fritz M, et al. Determinants of obesity in the Ulm Research on Metabolism, Exercise and Lifestyle in Children (URMEL-ICE). Eur J Pediatr. 2009;168:1259-67.
19. Genovesi S, Antolini L, Giussani M, Brambilla P, Barbieri V, Galbiati S, et al. Hypertension, prehypertension, and transient elevated blood pressure in children: association with weight excess and waist circum-ference. Am J Hypertens. 2010;23:756-61.
20. Ogden CL, Carroll MD, Curtin LR, Lamb MM, Flegal KM. Prevalence of high body mass index in us children and adolescents, 2007-2008. JAMA. 2010;303:242-49.
21. Matijasevich A, Victora CG, Golding J, Barros FC, Menezes AM, Araujo CL, et al. Socioeconomic position and overweight among ado-lescents: data from birth cohort studies in Brazil and the UK. BMC Public Health. 2009;9:105-11.
22. Swinburn B, Shelly A. Efects of TV time and other sedentary pursuits. Int J Obes. (Lond) 2008;32(Suppl 7):S132-6.
23. Wells JC, Hallal PC, Reichert FF, Menezes AM, Araújo CL, Victora CG. Sleep patterns and television viewing in relation to obesity and blood pressure: evidence from an adolescent Brazilian birth cohort. Int J Obes. 2008;32:1042-9.
24. Kuepper-Nybelen J, Lamerz A, Bruning N, Hebebrand J, Herpertz-Dahlmann B, Brenner H. Major diferences in prevalence of over-weight according to nationality in preschool children living in Ger-many: determinants and public health implications. Arch Dis Child. 2005;90:359-63.
25. Wardle J, Carnell S, Haworth CMA, Plomin R. Evidence for a strong genetic inluence on childhood adiposity despite the force of the obe-sogenic environment. Am J Clin Nutr. 2008;87:398-404.
26. Lee S, Bach F, Arslanian SA. Waist circumference, blood pres-sure, and lipid components of the metabolic syndrome. J Pediatr. 2006;149:809-16.
27. Meininger JC, Brosnan CA, Eissa MA, Nguyen TQ, Reyes LR, Up-church SA, et al. Overweight and central adiposity in school-age chil-dren and links with hypertension. J Pediatr Nurs. 2010; 25:119-25. 28. Sociedade Brasileira de Cardiologia, Sociedade Brasileira de
Hiper-tensão, Sociedade Brasileira de Nefrologia. V Diretrizes Brasileiras de Hipertensão Arterial. São Paulo; 2006.
29. Gomes BMR, Alves JGB. Prevalência de hipertensão arterial e fatores associados em estudantes de ensino médio de escolas públicas da região metropolitana do Recife, Pernambuco, Brasil, 2006. Cad Saúde Pública. 2009;25:375-81.
30. Din-Dzietham R, Liu Y, Bielo MV, Shamsa F. High blood pressure trends in children and adolescents in national surveys, 1963 to 2002. Circulation. 2007;116:1488-96.
31. Beck CC, Lopes AS, Pitanga FJG. Indicadores antropométricos como preditores de pressão arterial elevada em adolescentes. Arq Bras Car-diol. 2011;96:126-33.