Reductive Decolourisation of Sulphonated Mono
and Diazo Dyes in One- and Two-Stage Anaerobic
Systems
Marcos Erick Rodrigues da Silva&
Paulo Igor Milen Firmino&André Bezerra dos Santos
Received: 24 October 2012 / Accepted: 18 February 2013 / Published online: 3 March 2013
#Springer Science+Business Media New York 2013
Abstract This work assessed the application of one- and two-stage mesophilic anaerobic systems to colour removal of sulphonated mono and diazo dyes with ethanol as electron donor. The dyes Congo Red (CR), Reactive Black 5 (RB5) and Reactive Red 2 (RR2) were selected as model compounds and tested separately in seven different periods. The one-stage system (R1)
consisted of a single up-flow anaerobic sludge blanket (UASB) reactor, whereas the two-stage system (R2) consisted of an acidogenic UASB reactor (RA), a settler and a methanogenic UASB
reactor (RM). For CR and RB5, no remarkable difference was observed between the colour
removal performance of both anaerobic systems R1and R2. The experiments with RR2 revealed
that R2 was more efficient on colour removal than R1, showing efficiencies almost 2-fold
(period VI) and 2.5-fold (period VII) higher than those found by R1. Additionally, R2showed a
higher stability, giving a good prospect for application to textile wastewaters. Finally, the acidogenic reactor (RA) had an important role in the overall decolourisation achieved by R2
during the experiments with CR and RB5 (>78 %), whereas for RR2, a more recalcitrant dye, RAwas responsible for up to 38 % of the total colour removal.
Keywords Anaerobic treatment . Sulphonated azo dyes . Reductive decolourisation . Two-stage system . Acidogenic reactor
Introduction
It is estimated that over 800,000 tons of dyes are produced annually worldwide, amongst which the azo dyes are the most employed ones at industrial scale (>50 %), followed by the
Appl Biochem Biotechnol (2013) 170:1–14 DOI 10.1007/s12010-013-0159-5
M. E. R. da Silva
:
P. I. M. Firmino:
A. B. dos SantosDepartment of Hydraulic and Environmental Engineering, Federal University of Ceará, Fortaleza, Ceará, Brazil
M. E. R. da Silva
Federal Institute of Education, Science and Technology of Ceará, Campus Sobral, Sobral, Ceará, Brazil
A. B. dos Santos (*)
Department of Hydraulic and Environmental Engineering, Federal University of Ceará, Campus do Pici, Bloco 713. Pici, CEP: 60455-900 Fortaleza, Ceará, Brazil
anthraquinone and phthalocyanine dyes [1]. Therefore, the release of dye-containing efflu-ents into surface waters represefflu-ents a serious environmental problem and a public health concern [2] since these compounds and their breakdown products are toxic, mutagenic or carcinogenic [3].
Amongst the different decolourisation methods, biological treatment has called attention for being economically attractive. However, colour removal by aerobic bacteria is normally low (10–30 %) since oxygen is a more effective electrons acceptor than azo dyes [2]. On the other hand, under anaerobic conditions, effective dye decolourisation can be reached [4].
This process is also referred as dye reduction, being the azo dye reduction biochemistry mostly reported in literature. The azo bond (–N=N–) cleavage involves four electrons (reducing equivalents) transfer to the azo dye, which acts as a final electrons acceptor. After this cleavage, aromatic amines are produced [2].
Since dye reduction competes with methanogenesis for the same electrons generated upon electron donor oxidation [5,6], it seems that a two-stage anaerobic system, in which acidogenic and methanogenic phases are separated, could be an interesting option to enhance colour removal since the probability of the electrons to be channelled to dye reduction would be higher.
Although two-stage anaerobic degradation has been successfully applied to treatment of several complex industrial wastewaters [7,8], reports on this technology for dye-containing wastewaters decolourisation are still relatively scarce in literature [9–17]. Additionally, only few studies compared the decolourisation performance of one- and two-stage systems under the same operational conditions [9,10,12]. Therefore, as far as it is known, in literature, there is no report on experiments which assessed the application of one- and two-stage anaerobic systems to decolourisation of different sulphonated mono and diazo dyes such as Congo Red, a benzidine-based dye, Reactive Black 5, a vinylsulphone dye and Reactive Red 2, a dichlorotriazine dye, which have been extensively used in textile industry and, therefore, used as model compounds in many anaerobic colour removal experiments since all of them are known by its recalcitrance and toxicity [18].
Hence, this work assessed the application of one- and two-stage mesophilic anaerobic systems to colour removal of sulphonated mono and diazo dyes with ethanol as electron donor substrate.
Material and Methods
Reactors
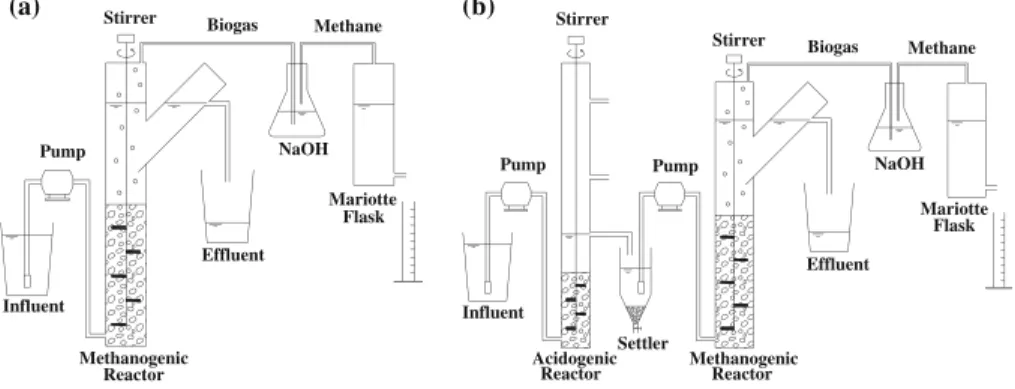
The up-flow anaerobic sludge blanket (UASB) reactors were made of PVC tubes and connections for sewage. The one-stage system (R1; Fig.1a) consisted of a single reactor
(V=5.2 L), and the two-stage system (R2; Fig. 1b) consisted of an acidogenic reactor
(RA; V=1.1 L), a settler and a methanogenic reactor (RM; V= 5.1 L). The reactors
were inoculated with an anaerobic sludge from a brewery mesophilic UASB reactor (Indus-trial District, Ceará, Brazil) at a final concentration of approximately 30 gVSSL−1.
With the exception of RA, the other reactors had a modified gas–solid–liquid separator (Y
shaped) [19]. In order to avoid the formation of preferential flow paths or short circuiting flows through the sludge blanket and facilitate the biogas release, avoiding the piston effect (sludge blanket rise due to entrapped biogas), a slow stirrer (5 rpm) was installed in the reactors [20].
The influent was stored at 4 °C, and the reactors were operated at room temperature of approximately 27 °C. The biogas produced was collected and washed in a NaOH solution (0.5 N), and, then, methane was measured by a Mariotte flask (liquid displacement method).
Synthetic Textile Wastewater
The synthetic wastewater was composed of distilled water, an azo dye, a carbon source (electron donor), basal medium (nutrients) and a buffer. The dyes (Fig.2) individually used, whose general characteristics are summarised in Table1, were Congo Red (CR; analytical grade, Vetec, Brazil), Reactive Black 5 (RB5; 55 % purity, Sigma-Aldrich, USA) and Reactive Red 2 (RR2; 50 % purity, Sigma-Aldrich, USA). The electron donor (∼1.0 g CODL−1) was ethanol (99.8 % purity, Dinâmica, Brazil), and the basal medium composition
was according to Costa et al. [21]. To keep the pH around 7.0, the wastewater was buffered with sodium bicarbonate (NaHCO3) in the proportion of 1 g NaHCO3 to each 1 g COD
ethanol. All chemicals were used as purchased without further purification.
NaOH Biogas Methane Influent Effluent Stirrer Methanogenic Reactor Pump Mariotte Flask (a) NaOH Influent Biogas Methane Effluent Stirrer Stirrer Mariotte Flask Methanogenic Reactor Acidogenic Reactor Settler Pump Pump (b)
Fig. 1 Schematic of the one-stage (a) and two-stage (b) anaerobic systems
8e
-+ 2
Sodium1,2-diaminonaphthalene-4-sulphonate Benzidine Congo Red(CR) NH 2 N N SO 3Na NH2 SO 3Na N N NH2 H2N
NH 2 SO 3Na H 2N N
Reactive Red2 (RR2)
+ -NaO3OS --+ -N N Cl Cl NH NaO
3S SO3Na
N OH N N N Cl Cl NH NaO
3S SO3Na
OH NH 2 NH 2 Sodium5-(4,6-dichloro-1,3,5-triazin-2-yl)amino-4-hydroxy-3-aminonaphthalene-2,7-disulphonate Aniline + 4e
-Reactive Black 5 (RB5)
Sodium1,2,7-triamino-8-hydroxynaphthalene-3,6-disulphonate Sodium2-(4-aminobenzene-sulphonyl)-ethoxi-sulphonate 8e -SO2 CH2
CH2 N N
SO2 CH2 CH2
NaO3SO N N NaO3S H2N
HO SO3Na
NH 2 SO 2 CH 2 CH 2 NaO 3SO
+ 2
NaO 3S H 2N NH 2 OH NH 2 SO 3Na
Fig. 2 Chemical structures of the azo dyes CR, RB5 and RR2 and their expected aromatic amines produced from complete azo bonds cleavage
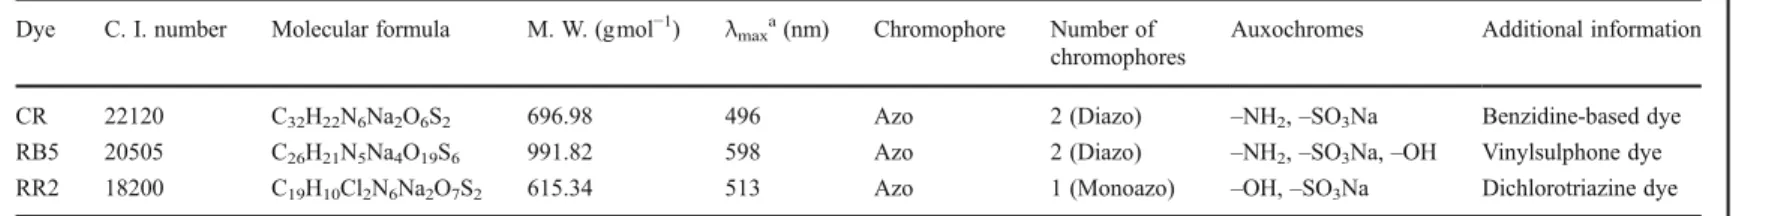
Table 1 General characteristics of the dyes used as model compounds
Dye C. I. number Molecular formula M. W. (gmol−1
) λmaxa(nm) Chromophore Number of
chromophores
Auxochromes Additional information
CR 22120 C32H22N6Na2O6S2 696.98 496 Azo 2 (Diazo) –NH2,–SO3Na Benzidine-based dye
RB5 20505 C26H21N5Na4O19S6 991.82 598 Azo 2 (Diazo) –NH2,–SO3Na,–OH Vinylsulphone dye
RR2 18200 C19H10Cl2N6Na2O7S2 615.34 513 Azo 1 (Monoazo) –OH,–SO3Na Dichlorotriazine dye
CRCongo Red,RB5Reactive Red 5,RR2Reactive Red 2,C. I.colour index,M. W.molecular weight aWavelength whose absorbance is maximum
4
Appl
Biochem
Biotechno
l
(2013)
170:1
–
Experimental Procedure
This study consisted of three independent experiments and was carried out in seven periods (Table2). In each experiment, a different sulphonated azo dye was individually tested at different concentrations in one- and two-stage mesophilic anaerobic systems in order to assess and compare their decolourisation performance.
Prior to the beginning of the first experiment, in which the dye CR was tested (periods I to III), a 30-day start-up period was carried out, during which the anaerobic systems were fed with a dye-free synthetic wastewater (same composition as described in SectionSynthetic Textile Wastewater). Then, after the reactors have reached steady operational conditions during the start-up period, CR was introduced at a concentration of 200 mgL−1(period I) in
both systems. Subsequently, CR concentration was increased to 400 and 800 mgL−1during
the periods II and III, respectively, and, then, CR experiment was finished.
Afterwards, before starting the experiment with the dye RB5 (periods IV and V), the anaerobic systems were fed again with a dye-free synthetic wastewater (for at least 30 days) in order to eliminate any trace of the previously tested dye (CR) from the reactors sludge blanket to prevent any interference in the subsequent experiments. Then, after the dye absence was confirmed in the reactors effluent by both visual observation and visible range (400–700 nm) scanning (Thermo–Nicolet Evolution 100), both systems were fed with a RB5-containing wastewater (100 mgL−1) in period IV. Subsequently, RB5 concentration was increased to 200 mgL−1in period V, and, then, this experiment was finished.
Once again, R1and R2were fed with a dye-free synthetic wastewater (for at least 30 days) in
order to eliminate any RB5 trace from the reactors sludge blanket, which could interfere in the subsequent experiment with the azo dye RR2 (periods VI and VII). After verifying RB5 absence in reactors effluent by the same techniques mentioned above, 100 mgL−1of RR2 were introduced in the anaerobic systems (period VI). Afterwards, in period VII, RR2 concentration was increased to 200 mgL−1, and, finally, the third and last dye experiment was completed.
Analyses
Colour was usually analysed three times a week and determined photometrically (Thermo–
Nicolet Evolution 100). The absorbance of each dye was read at the wavelength at which absorbance is maximum (λmax; Table 1). Samples were previously diluted (1:5) in a
phosphate buffer (10.86 gL−1NaH
2PO4·2H2O and 5.98 gL −1Na
2HPO4·2H2O) and, then,
centrifuged for 2 min at 13,000 rpm (Eppendorf–Mini Spin).
COD, pH, total alkalinity (TA) and volatile fatty acids (VFA) were usually analysed twice a week. COD was determined photometrically (Thermo–Nicolet Evolution 100) by the closed reflux method, whereas pH was determined by a potentiometric method (Digimed–
DM 20), and TA by a titrimetric method, all of them according to Standard Methods for the Examination of Water and Wastewater [22]. VFA were determined using the Kapp titrimetric method [23].
Statistical Methods
SigmaStat 3.5 computer programme was used for the statistical data analysis, being applied the Mann–Whitney Rank Sum test, a non-parametric procedure which does not require a specific data distribution, to compare the performance of both systems. The results of the tests were evaluated according to thepvalue. Ifp≤0.050, the null hypothesis is rejected, i.e. the data groups are considered statistically different.
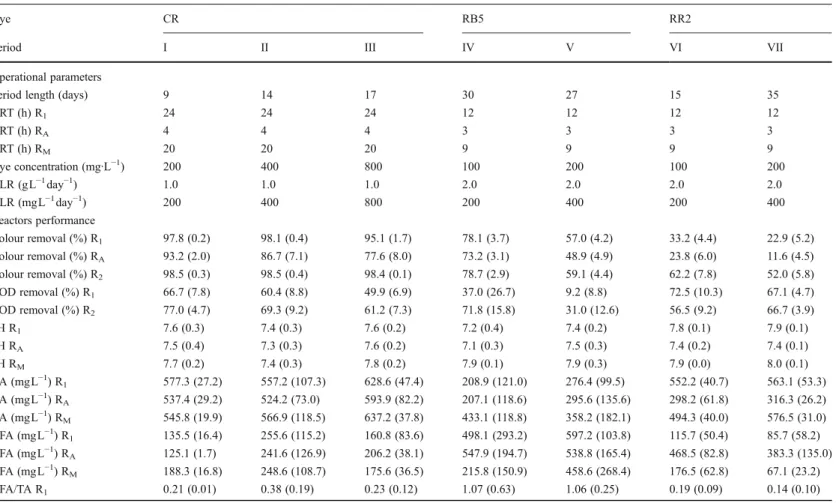
Table 2 Operational parameters and performance of the reactors over the experimental periods
Dye CR RB5 RR2
Period I II III IV V VI VII
Operational parameters
Period length (days) 9 14 17 30 27 15 35
HRT (h) R1 24 24 24 12 12 12 12
HRT (h) RA 4 4 4 3 3 3 3
HRT (h) RM 20 20 20 9 9 9 9
Dye concentration (mg·L−1
) 200 400 800 100 200 100 200
OLR (gL−1 day−1
) 1.0 1.0 1.0 2.0 2.0 2.0 2.0
DLR (mgL−1 day−1
) 200 400 800 200 400 200 400
Reactors performance
Colour removal (%) R1 97.8 (0.2) 98.1 (0.4) 95.1 (1.7) 78.1 (3.7) 57.0 (4.2) 33.2 (4.4) 22.9 (5.2) Colour removal (%) RA 93.2 (2.0) 86.7 (7.1) 77.6 (8.0) 73.2 (3.1) 48.9 (4.9) 23.8 (6.0) 11.6 (4.5) Colour removal (%) R2 98.5 (0.3) 98.5 (0.4) 98.4 (0.1) 78.7 (2.9) 59.1 (4.4) 62.2 (7.8) 52.0 (5.8) COD removal (%) R1 66.7 (7.8) 60.4 (8.8) 49.9 (6.9) 37.0 (26.7) 9.2 (8.8) 72.5 (10.3) 67.1 (4.7) COD removal (%) R2 77.0 (4.7) 69.3 (9.2) 61.2 (7.3) 71.8 (15.8) 31.0 (12.6) 56.5 (9.2) 66.7 (3.9)
pH R1 7.6 (0.3) 7.4 (0.3) 7.6 (0.2) 7.2 (0.4) 7.4 (0.2) 7.8 (0.1) 7.9 (0.1)
pH RA 7.5 (0.4) 7.3 (0.3) 7.6 (0.2) 7.1 (0.3) 7.5 (0.3) 7.4 (0.2) 7.4 (0.1)
pH RM 7.7 (0.2) 7.4 (0.3) 7.8 (0.2) 7.9 (0.1) 7.9 (0.3) 7.9 (0.0) 8.0 (0.1)
BA (mgL−1) R1 577.3 (27.2) 557.2 (107.3) 628.6 (47.4) 208.9 (121.0) 276.4 (99.5) 552.2 (40.7) 563.1 (53.3) BA (mgL−1
) RA 537.4 (29.2) 524.2 (73.0) 593.9 (82.2) 207.1 (118.6) 295.6 (135.6) 298.2 (61.8) 316.3 (26.2) BA (mgL−1
) RM 545.8 (19.9) 566.9 (118.5) 637.2 (37.8) 433.1 (118.8) 358.2 (182.1) 494.3 (40.0) 576.5 (31.0) VFA (mgL−1
) R1 135.5 (16.4) 255.6 (115.2) 160.8 (83.6) 498.1 (293.2) 597.2 (103.8) 115.7 (50.4) 85.7 (58.2) VFA (mgL−1
) RA 125.1 (1.7) 241.6 (126.9) 206.2 (38.1) 547.9 (194.7) 538.8 (165.4) 468.5 (82.8) 383.3 (135.0) VFA (mgL−1
) RM 188.3 (16.8) 248.6 (108.7) 175.6 (36.5) 215.8 (150.9) 458.6 (268.4) 176.5 (62.8) 67.1 (23.2)
VFA/TA R1 0.21 (0.01) 0.38 (0.19) 0.23 (0.12) 1.07 (0.63) 1.06 (0.25) 0.19 (0.09) 0.14 (0.10)
6
Appl
Biochem
Biotechno
l
(2013)
170:1
–
Table 2 (continued)
Dye CR RB5 RR2
Period I II III IV V VI VII
VFA/TA RA 0.21 (0.01) 0.37 (0.20) 0.30 (0.08) 1.19 (0.56) 0.98 (0.35) 0.89 (0.19) 0.74 (0.22)
VFA/TA RM 0.29 (0.01) 0.37 (0.19) 0.24 (0.06) 0.40 (0.30) 0.81 (0.46) 0.30 (0.11) 0.11 (0.04)
The standard deviation is shown in parenthesis OLRorganic loading rate,DLRdye loading rate
Appl
Biochem
Biotechno
l
(2013)
170:1
–
14
Results and Discussion
Colour Removal
After the reactors start-up period (data not shown), the dye CR was introduced at a concentration of 200 mgL−1 (period I) in both systems, which reached very high average
colour removal efficiencies (∼98 %; Table2). Although it was not so remarkable (<1 %), there was a statistically significant difference between R1and R2 average decolourisation
performance (p=0.032). In period II, CR concentration was increased to 400 mgL−1, but the systems performance was similar to that observed in the previous period (Table2), and no significant difference between decolourisation efficiencies was observed (p=0.056). How-ever, when CR concentration was increased to 800 mgL−1 (period III), R
2 was more
efficient than R1 (p<0.001), whose average decolourisation efficiency dropped from 98.1
to 95.1 %, while R2 kept the same performance observed in previous periods (Table 2).
Nevertheless, the colour removal difference (3.3 %) between the two systems was not so considerable.
Işik and Sponza [24], who used a UASB reactor (HRT=18–19 h) supplemented with glucose (from 100 to 500 mgCODL−1), found a complete CR (100 mgL−1) decolourisation.
However, the concentration was at least 8-fold lower than the concentrations tested in the current experiment. Furthermore, the results show that CR is not a very recalcitrant dye since both anaerobic systems achieved decolourisation efficiencies higher than 95 % (Table2) even when very high concentrations were applied (800 mgL−1). Hence, this might be
attributed to the linear molecule structure of CR, which allows easy chromophore reduction even when similar concentrations were applied at lower HRTs (8–12 h) [12,21,25].
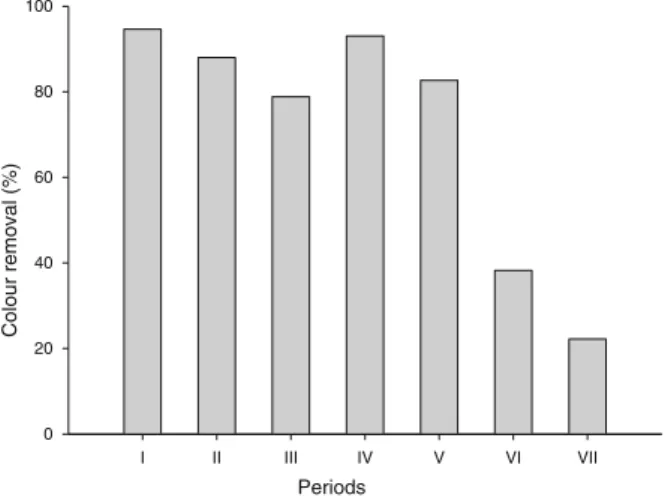
The total decolourisation obtained by the two-stage system was mostly ascribed to the acidogenic reactor (RA; >78 %; Fig.3), which is in accordance to previous studies [9–11,14, 17]. For instance, Rai et al. [14] reported that the acidogenic stage (HRT≈3.3 h) of an integrated two-stage anaerobic reactor (HRT=12 h) was responsible for more than 97 % of the overall colour removal even at the highest dye loading rate (1,000 mgL−1day−1),
whereas the methanogenic stage just acted as a polishing unit. Also, Talarposhti et al. [17], who used a stirred acidogenic tank (HRT=24 h) followed by an anaerobic filter
Periods
I II III IV V VI VII
Colour removal (%)
0 20 40 60 80 100
Fig. 3 Relative colour removal performance of the acidogenic reactor (RA) compared to the overall colour
removal in the two-stage anaerobic system (R2)
(HRT=48 h) to treat a synthetic wastewater composed by a mixture of seven basic dyes (1,000 mgL−1), reported that the acidogenic stage was responsible for approximately 54 %
of the overall colour removal efficiency (74 %).
According to Bhattacharyya and Singh [10], the application of two-stage anaerobic systems to treat dye-containing wastewaters is a way of overcoming the inhibitory effect of the dyes since the acidogenic reactor acts like a detoxifier, preventing the more sensitive methanogens from coming in direct contact with the toxic waste. However, the most likely hypothesis of utilizing a two-stage reactor is based on the fact that methanogenesis competes with the dye for the same electrons generated upon substrate oxidation [5,6]. Thus, by separating the two phases, the probability of the electrons to be channelled to the dye would be higher, which would enhance colour removal. However, in the present experiment, CR was easily reduced, which probably masked the effect of the separation of acidogenic and methanogenic phases.
After period III, a new dye-free period was carried out (data not shown) in order to eliminate any CR trace from the sludge blanket of the reactors, which could interfere in the subsequent experiment with the azo dye RB5. Then, after reaching stable operational conditions, the dye RB5 was introduced at a concentration of 100 mgL−1(period IV) in
both systems, which showed similar average colour removal efficiencies (p=0.939; Table2). Again, the total decolourisation achieved by the two-stage system (R2) was mostly
ascribed to RA since, even operated with a HRT of only 3 h, it reached an average
decolourisation efficiency above 73 % (Table 2), which corresponded to approximately 93 % of the total removal (Fig.3). These results are in accordance with the experiment of Sponza and Işik [26], who found a RB5 (100 mgL−1) removal efficiency above 80 % in a UASB reactor with a HRT of 3 h. Thus, according to the above-mentioned authors, a short time (2 h) is sufficient for the complete cleavage of the RB5 azo bonds.
In period V, RB5 concentration was increased to 200 mgL−1, and both systems showed a
significant drop in their colour removal efficiencies, from∼78 to below 60 % (Table2). The average efficiency of RA also decreased (from 73 to 49 %), but this reactor was still
responsible for 83 % of the total decolourisation efficiency of R2 (Fig.3). Although the
two-stage system has reached an average decolourisation slightly higher (2.1 %), it was not significantly different from R1(p=0.113).
When RB5 load was increased from 8.3 to 16.6 gm−3h−1, the performance of both
anaerobic systems was reduced, most likely due to the dye toxicity, which is probably much higher than CR as stated by Silva et al. [27], since evidences of inhibition, such as low COD removal and VFA accumulation, were observed as discussed in SectionCOD Removal and Operational Stability. However, this effect was not observed by Sponza and Işik [26], in which RB5 load increase (from 3.4 to 33.3 gm−3h−1) of a UASB reactor supplemented with
glucose (3.0 gCODL−1) did not significantly affect its colour removal efficiency, which
remained between 73 and 84 %.
Nonetheless, the present work showed that RB5 is more recalcitrant than CR, which supports the results found by Costa et al. [25] in decolourisation batch assays with the same anaerobic sludge used in the current experiment. The authors reported that, under the same conditions, the first-order kinetic constant (k1) for CR was (6.4-fold) higher than that for
RB5, which might be explained by the structure difference between both dyes since the large molecular volume of RB5 causes a steric hindrance and, therefore, makes dye reduction difficult, which reduces the colour removal efficiency. The same effect is not observed with CR because, as mentioned before, its linear molecule structure decreases the steric hindrance effect, which facilitates the microorganisms attack and makes CR a better electrons acceptor than RB5. Moreover, colour removal is more difficult with highly substituted and high
molecular weight dyes such as RB5 [28]. However, van der Zee et al. [4] observed no correlation betweenk1and molecular weight.
After period V, another dye-free period was carried out (data not shown) in order to eliminate any RB5 trace from the reactors sludge blanket, which could interfere in the subsequent experiment with the azo dye RR2 (periods VI and VII).
In period VI, initially, higher decolourisation efficiencies were observed, probably due to the initial RR2 adsorption into the sludge blanket [29]. Subsequently, these values decreased gradually in the period (data not shown), during which the two-stage system (R2) was clearly
more efficient than the one-stage system (R1;p<0.001), reaching an almost 2-fold higher average
decolourisation (∼62 %; Table2). Additionally, the acidogenic reactor (RA) was responsible for
38 % of total efficiency of R2(Fig.3). By increasing the dye concentration from 100 to
200 mg L−1 (period VII), the average efficiency of both systems decreased approximately
10 % (Table2). Nonetheless, R2remained (∼2.5-fold) more efficient than R1(p<0.001). In this
period, RAcontributed with only 22 % of total decolourisation of the two-stage system (Fig.3).
Hence, probably, the application of two-stage systems might be more suitable and, therefore, more efficient for effluents which contain more recalcitrant dyes like RR2.
According to Pearce et al. [30], colour removal is related to the number of azo bonds in the dye molecule, i.e. the colour of monoazo dyes is removed faster than the colour of diazo or triazo ones. However, although RR2 is a monoazo dye, it was more recalcitrant than CR and RB5 since RR2 contains a triazine group, which generally gives a high recalcitrance to reductive processes due to the competition for the electrons between nitrogen atoms from the triazine group and the nitrogen from the azo linkage [4,21]. Furthermore, the present results are consistent with Costa et al. [21], who found thatk1for CR was 7-fold higher than that for RR2
in a decolourisation batch experiment which used the same inoculum of the present work. van der Zee et al. [31] operated a UASB reactor (HRT=6 h) fed with synthetic wastewater containing 200 mgL−1of non-hydrolysed RR2 and obtained decolourisation efficiencies of
20 to 30 %. According to these authors, the reactor showed high operational instability and collapsed after 32 days from dye introduction into the reactor influent, mainly due to RR2 toxicity—caused by the non-hydrolysed chlorotriazine group, which severely inhibited biological activity of the reactor sludge. However, although non-hydrolysed RR2 has also been used in the current experiment, no toxicity inhibition was observed in both systems used (SectionCOD Removal and Operational Stability).
Finally, as regards the acidogenic reactor performance, the lower decolourisation effi-ciencies reached for RR2 when compared to the other dyes (Fig.3) might be related to the steric hindrance of RR2 molecule, which makes electrons transfer from the substrate to the dye more difficult. Therefore, the short HRT (3 h) was not sufficient to allow a higher decolourisation. In agreement with that, dos Santos et al. [32] evaluated the decolourisation of RR2 (520 mgL−1) in a expanded granular sludge bed (EGSB) reactor, and found that the
HRT decrease from 10 to 5 and, then, to 2.5 h, decreased the colour removal efficiencies from 56 to 37 and to 13 %, respectively, therefore suggesting that the HRTs used were not also long enough to allow dye reduction satisfactorily.
COD Removal and Operational Stability
Operational data for reactors performance are shown in Table 2. The average pH values achieved during all periods are in accordance with Pearce et al. [30], who affirmed the optimum pH for colour removal is, in general, neutral or slightly alkaline.
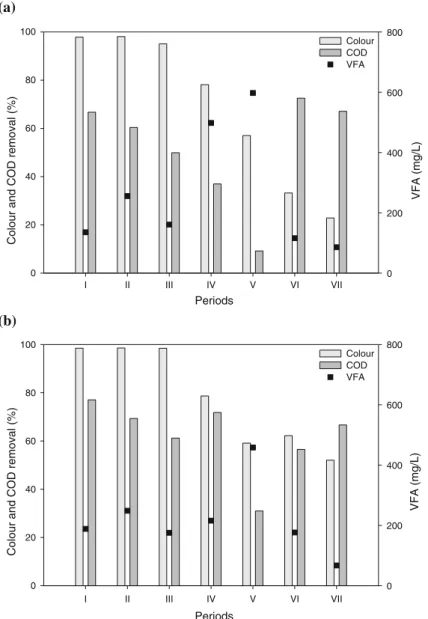
For CR, although COD removal efficiencies of both systems have decreased with the dye concentration increase (periods I to III; Fig. 4), the reactors showed a good operational
stability, but R2had always a better performance than R1(p<0.050). Furthermore, the results
suggest that there was no microbial inhibition by dye toxicity in both systems since low VFA concentrations were detected in effluents (Table2), i.e. VFA/TA relation was always below the critical value (0.4) reported by Behling et al. [33] (Table2).
Diniz et al. [34] reported that the azo dye CR was toxic to cells of the organism
Desulfovibrio alaskensis in concentrations higher than 0.5 mM (∼350 mgL−1). However,
the present work agrees with Costa et al. [21], who also did not find any inhibition sign caused by CR or its reduced products in terms of substrate (ethanol) oxidation even when their UASB reactors were fed with approximately 850 mgL−1of dye. Moreover, Sponza and
Periods
I II III IV V VI VII
Colour and COD removal (%)
0 20 40 60 80 100
VFA (mg/L)
0 200 400 600 800 Colour COD VFA
(a)
Periods
I II III IV V VI VII
Colour and COD removal (%)
0 20 40 60 80 100
VFA (mg/L)
0 200 400 600 800 Colour COD VFA
(b)
Fig. 4 Average colour and COD removal efficiency and effluent VFA concentration of the one-stage (a) and two-stage (b) anaerobic systems
Işik [35] did not observe any inhibitory effect on the anaerobic sludge of a UASB reactor treating a CR-containing wastewater with a dye concentration as high as 3,200 mgL−1.
Therefore, it is advantageous to use anaerobic consortia compared to pure cultures because the high microbial diversity in anaerobic consortia helps to decrease toxicity effects and enhance process stability [21].
Thus, the reduction observed in COD removal efficiency was presumably caused by the additional amount of dye in each period, which is only reduced to aromatic amines and not completely mineralised under anaerobic conditions [2]. This is in accordance with Brás et al. [36], who observed a COD efficiency decrease from 92 to 67 % when the Acid Orange 7 concentration increased from 60 to 300 mgL−1in a UASB reactor. However, the electron
donor conversion was not affected since no acetate accumulation was found. Hence, the authors concluded that the residual COD could be attributed to non-reduced dye or its metabolites (aromatic amines).
On the other hand, for RB5, there was an accumulation of VFA in the reactors since VFA/TA average values varied from 0.4 to 1.2 (Table2). Hence, these results indicated that during RB5 treatment, a possible anaerobic microbiota inhibition might have occurred. Additionally, except for the two-stage system (R2) in period IV, average COD removal
efficiencies were remarkably low during the whole experiment with RB5 (Fig. 4), which reinforces the inhibition hypothesis, particularly when the dye concentration was increased from 100 to 200 mgL−1(period V). Nevertheless, R2clearly presented a better COD removal
performance than R1during both periods (p=0.003; Table2).
A possible explanation for RB5 toxicity may be related to its non-hydrolysed supple-mentation in the bioreactors. For instance, Libra et al. [37] reported that, when partially hydrolysed, RB5 was found to almost completely suppress the methanogenic and sulphate-reducing activity of a bioreactor, whereas no significant inhibition was observed when the reactor treated the fully hydrolysed RB5. Therefore, concerning the toxicity of vinylsulphonic reactive azo dyes, such as RB5, to anaerobic biomass, hydrolysis of the reactive groups (vinylsulphone) seems to be very important [18].
In contrast, no inhibition was observed by Işik and Sponza [38] in anaerobic batch toxicity tests even at concentrations as high as 1,200 mgL−1of non-hydrolysed RB5. Also, Sponza and Işik [26] did not find any problems in COD removal by using a UASB reactor treating a synthetic wastewater containing 100 mgL−1of non-hydrolysed RB5 supplemented
with glucose (3,000 mgL−1COD) unless when very high organic loading rates were applied
(20–25 kgCODm−3day−1), i.e. average COD removal decreased from 56 (at 4.83 kgCOD
m−3day−1) to 26.6 % (24.6 kgCODm−3day−1) most likely due to the accumulation of
intermediate degradation products such as VFA and breakdown products.
For RR2, low VFA concentrations were found in reactors R1and RMduring both periods
VI and VII (Table 2), which indicates that the microbial activity might not have been inhibited by toxicity of the dye or its by-products (aromatic amines) resulted from anaerobic reduction. On the other hand, there was VFA accumulation in RA(VFA/TA>0.7; Table2).
However, this behaviour was expected since the acidogenic reactor is responsible for converting more complexes substrates into low-chain organic acids.
In relation to COD removal, unexpectedly, R1achieved a higher average efficiency than
R2in period VI (p=0.038; Table2) due to no apparent reason since no evidence of toxicity
inhibition was verified as mentioned above. In period VII, both anaerobic systems presented similar COD removal efficiencies (p=0.817), i.e. R1average efficiency decreased (from 72.5
to 67.1 %), whereas R2 increased (from 56.5 to 66.7 %) when compared to the previous
period (Fig.4). Thus, apparently, the increase in dye concentration from 100 to 200 mgL−1
was not directly related to the COD removal performance of R1and R2. In addition, it seems
that there was no problem on electron donor (ethanol) conversion. Therefore, compared to CR and RB5, colour removal of RR2 was lower, due to its steric hindrance, which makes the azo dye reduction more difficult, as mentioned in SectionColour Removal.
dos Santos et al. [29] stated that the co-substrate (a glucose–VFA mixture) conversion was not affected even when high hydrolysed RR2 concentrations (up to 1.25 gL−1) were
imposed to their thermophilic EGSB reactor (HRT=10 h). In contrast, van der Zee et al. [31] had their mesophilic UASB reactor (HRT=6 h) collapsed after 53 days of experiment, resulting in VFA (co-substrate) removal efficiencies as low as 5 to 10 % because the reactor was fed with non-hydrolysed RR2 (200 mgL−1). The present work also used non-hydrolysed RR2, but no inhibition was evidenced.
Finally, it is worth mentioning that the residual COD, in all experimental periods, was still very high. Additionally, dye decolourisation by-products are normally toxic, carcinogenic or, even, mutagenic. Therefore, a post-treatment for the anaerobic effluents is required such as aerobic treatment (e.g. activated sludge) or advanced oxidation process (e.g. H2O2/UV).
Conclusions
For CR and RB5, no remarkable difference was observed between the colour removal performance of both anaerobic systems R1and R2.
The experiments of RR2 revealed that R2was more efficient on colour removal than R1,
showing efficiencies almost 2-fold (period VI) and 2.5-fold (period VII) higher than those found for R1.
The acidogenic reactor (RA) had an important role in the overall decolourisation achieved
by R2 during the experiments with CR and RB5 (>78 %), whereas for RR2, a more
recalcitrant dye, RAwas responsible for up to 38 % of the total colour removal.
Finally, taking into account the efficiencies and the operational stability found, the two-stage anaerobic systems seem to be an interesting option for treating dye-containing wastewaters. Moreover, we expect that phase separation effect may be even higher for dyes with a recalcitrant nature or even for other reductive biological processes which involve electrons competition such as dehalogenation and nitroaromatic reduction.
Acknowledgments The authors would like to thank Conselho Nacional de Desenvolvimento Científico e Tecnológico—CNPq, an organization of the Brazilian Government for the development of Science and Technology, for the Master’s and PhD scholarships and financial support (Process 470310/2007-3 from Edital Universal).
References
1. Qiang, T., Luo, M., Bu, Q., & Wang, X. (2012).Chemical Engineering Journal, 197, 343–349. 2. dos Santos, A. B., Cervantes, F. J., & van Lier, J. B. (2007).Bioresource Technology, 98, 2369–2385. 3. Weisburger, J. H. (2002).Mutation Research: Fundamental and Molecular Mechanisms of Mutagenesis,
506–507, 9–20.
4. van der Zee, F. P., Lettinga, G., & Field, J. A. (2001).Chemosphere, 44, 1169–1176.
5. Cervantes, F., dos Santos, A. B., de Madrid, M. P., Stams, A. J. M., & van Lier, J. B. (2005).Water Science and Technology, 52, 351–356.
6. dos Santos, A. B., de Madrid, M. P., de Bok, F. A. M., Stams, A. J. M., van Lier, J. B., & Cervantes, F. J. (2006).Enzyme and Microbial Technology, 39, 38–46.
7. Demirel, B., & Yenigün, O. (2002).Journal of Chemical Technology and Biotechnology, 77, 743–755. 8. Ke, S. Z., Shi, Z., & Fang, H. H. P. (2005).International Journal of Environment and Pollution, 23, 65–80.
9. Bhattacharyya, D., & Singh, K. S. (2008).Water Science and Technology, 57, 863–868.
10. Bhattacharyya, D., & Singh, K. S. (2010).Practice Periodical Hazardous Toxicology Radioactivity Waste Management, 14, 250–257.
11. Chinwetkitvanich, S., Tuntoolvest, M., & Panswad, T. (2000).Water Research, 34, 2223–2232. 12. Firmino, P. I. M., Silva, M. E. R., Cervantes, F. J., & dos Santos, A. B. (2010).Bioresource Technology,
101, 7773–7779.
13. Gnanapragasam, G., Senthilkumar, M., Arutchelvan, V., Sivarajan, P., & Nagarajan, S. (2010).World Journal of Microbiology and Biotechnology, 26, 1093–1098.
14. Rai, H. S., Singh, S., Cheema, P. P. S., Bansal, T. K., & Banerjee, U. C. (2007).Journal of Environmental Management, 83, 290–297.
15. Senthilkumar, M., Gnanapragasam, G., Arutchelvan, V., & Nagarajan, S. (2011).Chemical Engineering Journal, 166, 10–14.
16. Senthilkumar, M., Gnanapragasam, G., Arutchelvan, V., & Nagarajan, S. (2011).Environmental Science and Pollution Research, 18, 649–654.
17. Talarposhti, A. M., Donnelly, T., & Anderson, G. K. (2001).Water Research, 35, 425–432. 18. van der Zee, F. P., & Villaverde, S. (2005).Water Research, 39, 1425–1440.
19. Cavalcanti, P. F. F. (2003). PhD Thesis, Wageningen University, Wageningen. 20. Leitão, R. C. (2004). PhD Thesis, Wageningen University, Wageningen.
21. Costa, M. C., Mota, S., Nascimento, R. F., & Dos Santos, A. B. (2010).Bioresource Technology, 101, 105–110.
22. APHA. (2005).Standard methods for the examination of water and wastewater(21st ed.). Washington: American Public Health Association.
23. Buchauer, K. (1998).Water SA, 24, 49–56.
24. Işik, M., & Sponza, D. T. (2005).Bioresource Technology, 96, 633–643.
25. Costa, M. C., Mendonça, G. L. F., Mota, F. S. B., Nascimento, R. F., & dos Santos, A. B. (2010).Quím. Nova, 33, 1514–1519.
26. Sponza, D. T., & Işik, M. (2002).Enzyme and Microbial Technology, 31, 102–110.
27. Silva, M. E. R., Firmino, P. I. M., Sousa, M. R., & dos Santos, A. B. (2012).Applied Biochemistry and Biotechnology, 166, 1057–1069.
28. Franciscon, E., Zille, A., Fantinatti-Garboggini, F., Silva, I. S., Cavaco-Paulo, A., & Durrant, L. R. (2009).Process Biochemistry, 44, 446–452.
29. dos Santos, A. B., Cervantes, F. J., Yaya-Beas, R. E., & van Lier, J. B. (2003).Enzyme and Microbial Technology, 33, 942–951.
30. Pearce, C. I., Lloyd, J. R., & Guthrie, J. T. (2003).Dyes Pigm., 58, 179–196.
31. van der Zee, F. P., Bouwman, R. H. M., Strik, D. P. B. T. B., Lettinga, G., & Field, J. A. (2001). Biotechnology and Bioengineering, 75, 691–701.
32. dos Santos, A. B., Traverse, J., Cervantes, F. J., & van Lier, J. B. (2005).Biotechnology and Bioengi-neering, 89, 42–52.
33. Behling, E., Diaz, A., Colina, G., Herrera, M., Gutierrez, E., Chacin, E., et al. (1997). Bioresource Technology, 61, 239–245.
34. Diniz, P., Lopes, A., Lino, A., & Serralheiro, M. (2002).Applied Biochemistry and Biotechnology, 97, 147–163.
35. Sponza, D. T., & Işik, M. (2005).Process Biochemistry, 40, 2735–2744.
36. Brás, R., Gomes, A., Ferra, M. I. A., Pinheiro, H. M., & Gonçalves, I. C. (2005).Journal of Biotechnol-ogy, 115, 57–66.
37. Libra, J. A., Borchert, M., Vigelahn, L., & Storm, T. (2004).Chemosphere, 56, 167–180. 38. Işik, M., & Sponza, D. T. (2007).Enzyme and Microbial Technology, 40, 934–939.