ABSTRACT: Objective: This study aimed to determine if individual and socio-environmental characteristics can inluence the self-rated health among Brazilian adolescents. Methods: It included 1,042 adolescents from 11 to 17 years old who participated in the Beagá Health Study (Estudo Saúde em Beagá), a multistage household survey in an urban setting. Logistic regression analyses were performed to determine the association between the self-rated health and the following explanatory variables: sociodemographic factors, social support, lifestyle, physical and psychological health. Results:Good/very good and reasonable/poor/very poor self-rated health were reported by 88.5 and 11.5% of adolescents, respectively. The data on sociodemographic factors (SES), social support, lifestyle, psychological and physical health were associated with poor self-rated health (p ≤ 0.05). The associated variables were: age 14 – 17 years (OR =1.71; 95%CI 1.06 – 2.74), low SES (OR =1.68; 95%CI 1.05 – 2.69), few (OR = 2.53; 95%CI 1.44 – 4.46) and many quarrels in family (OR = 9.13; 95%CI 4.53 – 18.39), report of unkind and unhelpful peers (OR = 2.21; 95%CI 1.11 – 4.43), consumption of fruits < 5 times a week (OR = 1.78; 95CI% 1.07 – 2.95), physical inactivity (OR = 2.31; 95%CI 1.15 – 4.69), overweight (OR = 2.42; 95%CI 1.54 – 3.79) and low level of life satisfaction (OR = 2.31; 95%CI 1.34 – 3.98). Conclusions:Poor self-rated health among adolescents was associated with individual and socio-environmental characteristics related to family, school and neighborhood issues. Quantifying the self-rated health according to the theoretical framework of the child’s well-being should help in arguing that self-rated health might be a strong indicator of social inequities for the studied population. Keywords:Self-assessment. Child welfare. Adolescent. Urban health. Adolescent behavior. Social conditions. Family relations.
Inluence of individual and socio-environmental
factors on self-rated health in adolescents
Inluência de fatores individuais e socioambientais
na autoavaliação de saúde em adolescentes
Adriana Lúcia MeirelesI,II, César Coelho XavierII,III, Fernando Augusto ProiettiII,III,IV, Waleska Teixeira CaiafaII,V
I School of Health Sciences of Trairi,Universidade Federal do Rio Grande do Norte – Santa Cruz (RN), Brazil.
IIBelo Horizonte Observatory for Urban Health, Universidade Federal de Minas Gerais – Belo Horizonte (MG), Brazil.
IIISchool of Health and Human Ecology – Vespasiano (MG), Brazil.
IVRené Rachou Research Center, Oswaldo Cruz Foundation – Rio de Janeiro (RJ), Brazil.
VDepartment of Preventive and Social Medicine, School of Medicine, Universidade Federal de Minas Gerais – Belo Horizonte (MG), Brazil. Corresponding author: Adriana Lúcia Meireles. Observatório de Saúde Urbana de Belo Horizonte, Faculdade de Medicina, Universidade Federal de Minas Gerais. Avenida Alfredo Balena, 190, sala 730, Santa Eigênia, CEP: 30130-100, Belo Horizonte, MG, Brasil. E-mail: [email protected]
Conlict of interests: nothing to declare – Financial support: Conselho Nacional de Desenvolvimento Cientíico e Tecnológico (CNPq – Process no. 475004/2006-0 and Process no. 409688/2006-1); Minas Gerais State Research Foundation (FAPEMIG – Process no. APQ-00975-08). W.T. Caiafa is a fellow by the Conselho Nacional de Desenvolvimento Cientíico e Tecnológico (CNPq), Brazil.
539
INTRODUCTION
Self-rated health (SRH) is one of the most commonly used health indicators in surveys, because it is an expression of social, psychological, and biological dimensions1. It is considered
an easily assessed and understood, robust, valid and reliable measure of physical health status in adults2,3.
Although most widely used as a proxy of health status among adults, SRH deserves more research attention as a health indicator among adolescents. Studies comparing SRH between adults and adolescents have shown that, while SRH in adults may relect chronic and acute conditions, in adolescents, it may extend beyond the physical health status, relecting personal, environmental and socio-behavioral factors2,4,5.
Studies on the determinants of adolescent SRH are limited. One of the ancillary studies on this subject in this age group was led by Mechanic and Hansell in 1987, who analyzed longitudinal data from 1,057 adolescents in 19 public schools in the United States. They showed that SRH was related to school achievement, physical activity and psychological well-being. They postulated that SRH among adolescents was deined in a broad and global way, and represented the overall sense of functioning of life6.
Afterwards, in 1998, Vingilis et al. found that socio-demographic variables, the structural environment, physical health, social factors, lifestyle behaviors and psychological
RESUMO: Objetivos:Determinar se características individuais e socioambientais podem inluenciar a autoavaliação de saúde dos adolescentes brasileiros. Métodos: Foram incluídos 1.042 adolescentes de 11 a 17 anos de idade, participantes do “Estudo Saúde em Beagá”, inquérito domiciliar realizado no município de Belo Horizonte em 2008-2009. Veriicou-se a associação entre autoavaliação de saúde e as seguintes variáveis explicativas: fatores sociodemográicos, suporte social, estilos de vida, saúde psicológica e saúde física. Resultados: Com relação à autoavaliação da saúde, 11,5% consideraram sua saúde muito ruim/ruim/razoável e 88,5% boa/muito boa. Os domínios sociodemográico, suporte social, estilos de vida, saúde psicológica e física foram associados com autoavaliação de saúde ruim (p ≤ 0,05). As variáveis associadas foram: idade 14 – 17 anos (OR = 1,71; IC95% 1,06 – 2,74), baixo nível socioeconômico (OR = 1,68; IC95% 1,05 – 2,69), poucas (OR = 2,53; IC95% 1,44 – 4,46) e muitas brigas na família (OR = 9,13; IC95% 4,53 – 18,39), não considerar os colegas legais e prestativos (OR = 2,21; IC95% 1,11 – 4,43), consumo de frutas < 5vezes/semana, (OR = 1,78; IC95% 1,07 – 2,95), ser inativo isicamente (OR = 2,31; IC95% 1,15 – 4,69), excesso de peso (OR = 2,42; IC95% 1,54 – 3,79) e baixo nível de satisfação com a vida (OR = 2,31; IC95% 1,34 – 3,98). Conclusões: A autoavaliação de saúde ruim entre os adolescentes foi associada com características individuais e socioambientais relacionadas com questões da família, escola e vizinhança. Conhecer a autoavaliação da saúde de acordo com o referencial teórico de bem-estar infantil pode nos auxiliar ajudar na argumentação de que a autoavaliação de saúde pode ser um forte indicador de desigualdades sociais para essa população estudada.
distress were predictors of SRH among adolescents. They considered that some of these variables directly afect self-rated health (e.g. adolescent self-esteem and school performance), while others are indirect (e.g. family structure, which is mediated by the family’s inancial situation)4.
Therefore, the studies in developed countries have shown that SRH in adolescents can extend beyond the symptoms and be an expression of life distress, indicating that this age group deines health broadly and globally4-11. Considering that the social environment inluences SRH
in adolescents, it is necessary to understand how the social environment may inluence the health of this age group. Then, the objective of this exploratory study was to understand which individual and socio-environmental characteristics can inluence self-rated health among Brazilian adolescents in a large urban center.
METHODS
BEAGÁ HEALTH STUDY
The Beagá Health Study (Estudo Saúde em Beagá) is a population-based household survey conducted by the Observatory for Urban Health of Belo Horizonte City (OSUBH), in 2008-2009. The sample size (4,500 households) was deined based on estimates from previous research. The number of households selected was the one that produced a maximum relative error of 15% at a conidence level of 95% to the estimated proportion of variables selected (prevalence estimated between 17 and 22%). The survey focused on two of the nine administrative districts of Belo Horizonte city (Barreiro and West), with a population of about 250,000 people each and a total geographic area of 33.16 km2. The sample was
selected using stratiied three-stage cluster sampling, including census tracts as the irst level, households as the second and residents as the third level.
The sample strata were deined according to the Health Vulnerability Index (HVI)12,
an index created by combining social, demographic, economic and health indicators from each census tract. Census tracts are deined by the Brazilian Census Bureau and include an average of 1,000 residents each. In the irst stage, 150 census tracts were selected from a total of 588 census tracts in the sampling frame. In the second stage, 6,493 households were initially eligible, using a sampling frame from the municipality. After deleting vacant lots, institutional and commercial buildings and eligible participants who were not found after three visits to their homes, 5,436 households remained eligible. The refusal rate was about 25.0%, resulting in a study sample of 4,051 households. In the third stage, one adolescent aged 11 – 17 years and one adult aged 18 years or older were randomly selected to participate within each sampled household13. A probabilistic sample of 1,042 adolescents at the age
range of 11 – 17 years old was studied.
541
Research/Universidade Federal de Pelotas” (CPE/UFPel)15 and on the “National Survey of
School Health” (PeNSE)16. The self-reported questionnaire developed for 11 – 13 year olds
focused on aspects of well-being, covering factors such as educational well-being, family structure, physical activity, dietary habits and subjective well-being. For adolescents aged 14 – 17 years old, the instrument included, besides the aforementioned factors, questions related to violence, peer relationships, sexual behaviors, as well as tobacco, alcohol and illicit drug use. Also, the adolescents’ weight, height and waist circumference were assessed by trained interviewers using standardized procedures17.
VARIABLES
Despite the paucity of research on predictors of SRH among adolescents, the literature review identiied several factors that may afect the subjective evaluation of health in this age group. We propose a framework for self-rated health in an urban environment, according to the personal, behavioral and socio-environmental factors that interact and deine the subjective health of this age group. This framework is presented in Figure 1.
Dependent variables
The outcome measure, SRH, was assessed by the following question: “In general, do you consider your health: very good, good, reasonable, poor or very poor?” SRH was dichotomized into very poor, poor and reasonable (now called POOR), and very good or good (now called GOOD).
Independent variables
The independent variables according to the theoretical model were organized in the following blocks: sociodemographic, social support, lifestyles, psychological indicators and health indicator.
1. Sociodemographic characteristics
The following characteristics were evaluated: gender, age (11- to 13-years-old and 14- to 17-years-old), and a proxy of socioeconomic status, assessed by minimum wage obtained from the adult questionnaire and categorized into less than ive and ive or more times the Brazilian minimum wage.
Report of ownership of educational items at home was used as a proxy of socioeconomic status and assessed by the question14: “Which one of the following objects do you have in
to do school work? Internet? Educational software? A calm or quiet place to study?” The variable was created by adding all items whose score ranged from 0 to 8 and it was categorized as either low socioeconomic status (i.e. scores ranging from 0 to 5) or high socioeconomic status (i.e. 6 to 8).
2. Social support from family and school
Social support from family was comprised by the following variables: family structure (nuclear, single-parent families or stepfamilies); frequency of quarrels in the family (none, few,
Figure 1. Framework proposed for self-rated health among adolescents according to sociodemographic, lifestyles, risk behaviors, social support, physical and psychological health blocks.
*Social support: subdivided into social involvement, school and family. Psy
colog
ic Sociode
mograp hic L ife st yle s Ris c B eha vio rs S oci al S up po rt P h ys ic a l H ealt h Personal w ell-being Health indicators Family S tru ture qu arre
ls, r
elat
ion
ship
w
hith
par
ents
Use of health services
SCHOOL
Enjoiy achiv ement
type of school Relations with peers
and the neighborhood SOCIAL ENVOL VEMENT Self-rated health in adolescents Life satisfaction Psychological w ell-being Age Gender Socioeconomic position Sedentarism Physical activity Bullying Involv
ement in fights Sexual initiation
Alcohol Smoking
Fruit consumption
543
or many); frequency of meals with parents (less than once a week or twice or more times a week); frequency of conversations with parents (never/rarely, sometimes, or always); family members’ interest in the adolescent’s school life (no one, parents, or other family member) and relationship with parents. The latter variable was scored from 0 to 6 and categorized as either bad, from 0 to 4, or good, from 5 or 6. The questions used were “My parents are always there for me when I need them”; “They make me feel loved and cared for”; “I can talk to them about any problems I might have”; “We have a lot of arguments”; “They give me the attention that I need”; and “They make me feel bad about myself ”.
Regarding social support from school, the following variables were examined: satisfaction with school life (likes or does not like school); school type (public or private) and a positive relationship with peers (considers them nice and helpful).
3. Lifestyle
This block included questions about fruit consumption ive days a week (at least once, less or more, ive days or more per week), frequency of breakfast (every day or never/rarely/ sometimes), time spent watching TV (less than 1 hour/day, 2 hours/day; or 3 hours/day or more), time spent per day playing videogames or on the computer (less than 1 hour, 2 hours; or 3 hours or more), and physical activity over the last seven days (active: 300 minutes or more or inactive/insuiciently active: up to 299 minutes). Physical activity was based on the instrument of the National Health Survey of School (PeNSE)16. We calculated the time
of physical activity accumulated in the last seven days using a combination of the following activities: commuting to school on foot or by bicycle, physical education classes at school and other extracurricular physical activities.
4. Psychological indicators
This block was evaluated using two visual scales: life satisfaction and psychological well-being. The “Satisfaction with Life Scale”18 uses an ascending scale from 1 to 10 on the day of
interview, where the lowest value represents low life satisfaction and the highest value represents high life satisfaction. Subsequently, these responses were categorized as either positive (6 to 10) or negative (1 to 5). The “Faces Scale”18 was used for psychological well-being. This schematic
instrument is composed of seven faces that refer to the prevailing mood over the two weeks prior to the interview. Psychological well-being answers were categorized as very high (face 1), high (face 2), or moderate to low (faces 3 to 7) based on a previous study19.
5. Health indicator
Anthropometry was evaluated using body mass index (BMI), which was calculated and classiied as percentiles by age group according to the World Health Organization (2007). According to this classiication, a BMI below the 3rd percentile was considered low; between
the 3rd and 85th percentiles, it was considered adequate or normal; between the 85th and 97th
percentiles, it was considered as overweight; and above the 97th percentile, it was considered
DATA ANALYSIS
The descriptive and univariate analysis of the SRH were carried out. Variables associated at the level of p ≤ 0.20 were included in the multivariate analysis. All variables of each domain were entered simultaneously in the model.
The analyses were carried out using multiple logistic regressions to obtain odds ratios (OR) and 95% conidence intervals (95%CI). The inal analysis included all variables that remained statistically associated with SRH at the level of p ≤ 0.05. To assess the model, we used the Hosmer and Lemeshow Test.
Weights were used to correct diferences in the selection probabilities of each individual. All analyses were weighted for the sample design efect through the command SVY of the STATA 10.0 software.
All participants and their parents gave their written consent to participate in the study. The study was approved by the Institutional Review Board of Universidade Federal de Minas Gerais, under case no. ETIC 253/06.
RESULTS
Regarding SRH, 11.2% (n = 120) out of 1,042 adolescents considered their health from very poor to reasonable and 88.8% (n = 915) from good to very good.
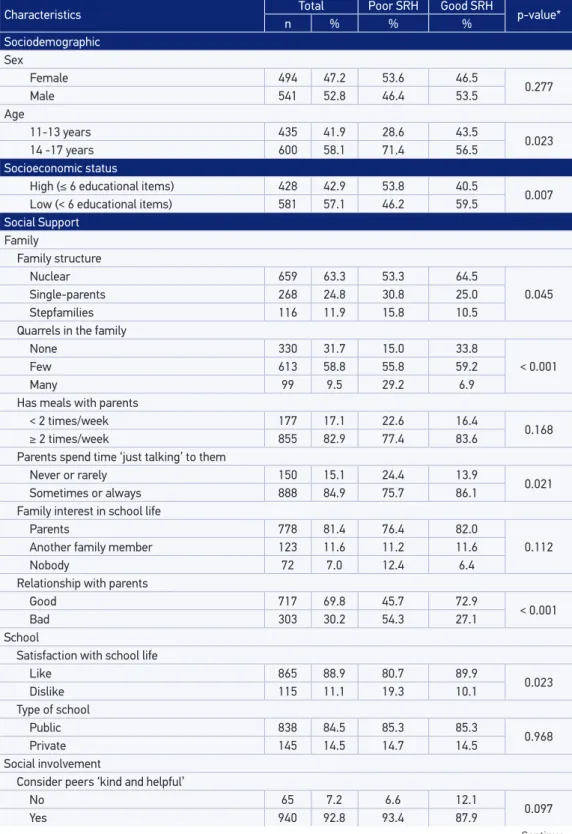
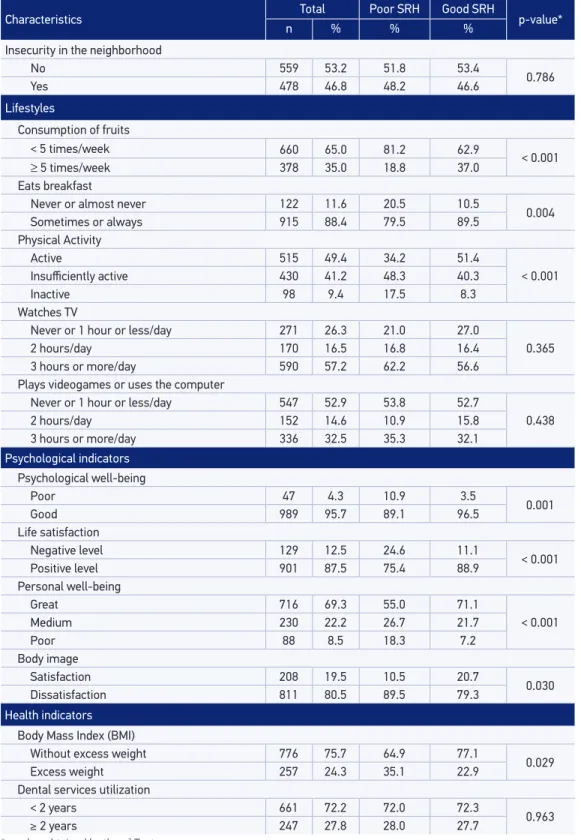
Table 1 shows the univariate analysis according to all blocks. In the sociodemographic domain, age and low socioeconomic status (SES) were signiicantly associated with poor SRH. With respect to the social support sub-blocks, in the family subdomain, single-parent households and stepfamilies, reports of family quarrels, rarely or never engaging in conversation with the parents and bad relationship with parents were all associated with poor health perception. In the school subdomain, dislike of school life was associated with poor health ratings (p ≤ 0,05). In the social involvement subdomain, no factors were associated with SRH. In the lifestyles domain, low consumption of fruits, not eating breakfast and physical inactivity were associated with poor SRH (p ≤ 0.05). Regarding the psychological indicators, all variables were signiicantly associated with poor SRH. For the physical health domain, only overweight was associated with a poor evaluation.
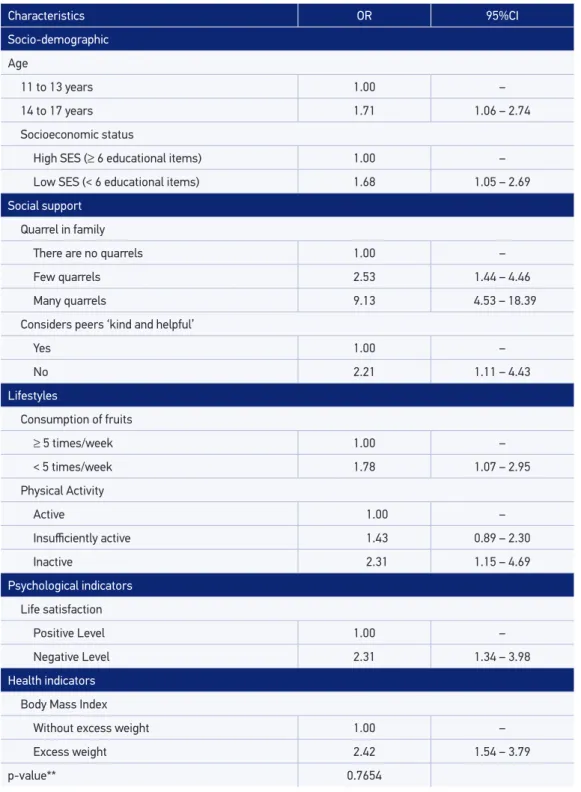
Table 2 presents results of the multivariate analyses. Given the existence of a signiicant multicollinearity between “low consumption of fruits” and “not eating breakfast”, only “low consumption of fruits” was kept into the multivariate model. The variables were: age 14 – 17 years, low SES, report of quarrels in the family, report of unkind and unhelpful peers, consumption of fruits < 5 times/week, physical inactivity, overweight and low level of life satisfaction. The model showed a very good it by the Hosmer and Lemeshow Test (p = 0.7654).
545
Characteristics Total Poor SRH Good SRH p-value*
n % % %
Sociodemographic Sex
Female 494 47.2 53.6 46.5
0.277
Male 541 52.8 46.4 53.5
Age
11-13 years 435 41.9 28.6 43.5
0.023
14 -17 years 600 58.1 71.4 56.5
Socioeconomic status
High (≤ 6 educational items) 428 42.9 53.8 40.5
0.007
Low (< 6 educational items) 581 57.1 46.2 59.5
Social Support Family
Family structure
Nuclear 659 63.3 53.3 64.5
0.045
Single-parents 268 24.8 30.8 25.0
Stepfamilies 116 11.9 15.8 10.5
Quarrels in the family
None 330 31.7 15.0 33.8
< 0.001
Few 613 58.8 55.8 59.2
Many 99 9.5 29.2 6.9
Has meals with parents
< 2 times/week 177 17.1 22.6 16.4
0.168
≥ 2 times/week 855 82.9 77.4 83.6
Parents spend time ‘just talking’ to them
Never or rarely 150 15.1 24.4 13.9
0.021
Sometimes or always 888 84.9 75.7 86.1
Family interest in school life
Parents 778 81.4 76.4 82.0
0.112
Another family member 123 11.6 11.2 11.6
Nobody 72 7.0 12.4 6.4
Relationship with parents
Good 717 69.8 45.7 72.9
< 0.001
Bad 303 30.2 54.3 27.1
School
Satisfaction with school life
Like 865 88.9 80.7 89.9
0.023
Dislike 115 11.1 19.3 10.1
Type of school
Public 838 84.5 85.3 85.3
0.968
Private 145 14.5 14.7 14.5
Social involvement
Consider peers ‘kind and helpful’
No 65 7.2 6.6 12.1
0.097
Yes 940 92.8 93.4 87.9
Table 1. Sociodemographic characteristics, social support, lifestyles, psychological indicators and health according to self-rated health among adolescents. Beagá Health Study, 2008 – 2009.
Characteristics Total Poor SRH Good SRH p-value*
n % % %
Insecurity in the neighborhood
No 559 53.2 51.8 53.4
0.786
Yes 478 46.8 48.2 46.6
Lifestyles
Consumption of fruits
< 5 times/week 660 65.0 81.2 62.9
< 0.001
≥ 5 times/week 378 35.0 18.8 37.0
Eats breakfast
Never or almost never 122 11.6 20.5 10.5
0.004
Sometimes or always 915 88.4 79.5 89.5
Physical Activity
Active 515 49.4 34.2 51.4
< 0.001
Insuiciently active 430 41.2 48.3 40.3
Inactive 98 9.4 17.5 8.3
Watches TV
Never or 1 hour or less/day 271 26.3 21.0 27.0
0.365
2 hours/day 170 16.5 16.8 16.4
3 hours or more/day 590 57.2 62.2 56.6
Plays videogames or uses the computer
Never or 1 hour or less/day 547 52.9 53.8 52.7
0.438
2 hours/day 152 14.6 10.9 15.8
3 hours or more/day 336 32.5 35.3 32.1
Psychological indicators Psychological well-being
Poor 47 4.3 10.9 3.5
0.001
Good 989 95.7 89.1 96.5
Life satisfaction
Negative level 129 12.5 24.6 11.1
< 0.001
Positive level 901 87.5 75.4 88.9
Personal well-being
Great 716 69.3 55.0 71.1
< 0.001
Medium 230 22.2 26.7 21.7
Poor 88 8.5 18.3 7.2
Body image
Satisfaction 208 19.5 10.5 20.7
0.030
Dissatisfaction 811 80.5 89.5 79.3
Health indicators Body Mass Index (BMI)
Without excess weight 776 75.7 64.9 77.1
0.029
Excess weight 257 24.3 35.1 22.9
Dental services utilization
< 2 years 661 72.2 72.0 72.3
0.963
≥ 2 years 247 27.8 28.0 27.7
*p-value obtained by the χ2 Test.
547
Table 2. Results of the multivariate logistic regression of poor self-rated health among adolescents (n = 974). Beagá Health Study, 2008 – 2009.
Characteristics OR 95%CI
Socio-demographic
Age
11 to 13 years 1.00 –
14 to 17 years 1.71 1.06 – 2.74
Socioeconomic status
High SES (≥ 6 educational items) 1.00 –
Low SES (< 6 educational items) 1.68 1.05 – 2.69
Social support
Quarrel in family
There are no quarrels 1.00 –
Few quarrels 2.53 1.44 – 4.46
Many quarrels 9.13 4.53 – 18.39
Considers peers ‘kind and helpful’
Yes 1.00 –
No 2.21 1.11 – 4.43
Lifestyles
Consumption of fruits
≥ 5 times/week 1.00 –
< 5 times/week 1.78 1.07 – 2.95
Physical Activity
Active 1.00 –
Insuiciently active 1.43 0.89 – 2.30
Inactive 2.31 1.15 – 4.69
Psychological indicators Life satisfaction
Positive Level 1.00 –
Negative Level 2.31 1.34 – 3.98
Health indicators
Body Mass Index
Without excess weight 1.00 –
Excess weight 2.42 1.54 – 3.79
p-value** 0.7654
DISCUSSION
Our results show that the self-rated health in the population studied can be inluenced by individual and family characteristics in a large urban center. SRH among Brazilian adolescents seemed to be a multidimensional indicator associated with ive of the six blocks investigated: sociodemographic, social support, lifestyle, psychological and physical health. Brazilian adolescents living in large cities seemed to have similar factors associated with SRH when compared to those living in developed countries, suggesting that, beyond physical health, other factors may inluence the SRH.
Regarding sociodemographic factors, older age and socioeconomic status have been described as risk factors for poor self-rated health in Brazilian adolescents, as well as in international studies4,5,7. In this study, the prevalence of poor SRH increases with age,
suggesting that adolescents may become increasingly preoccupied with their health as they age, with similar health perception patterns as adults.
According to UNICEF (2007), the lack of educational and cultural resources should rank alongside lack of income, and that the educational resources of the household, in particular, play a critical role in children’s educational achievements14. Therefore, in the present study,
the lack of educational items was associated with poor SRH. Previous studies support this association, and showed that the possession of household assets contribute to the perception of satisfactory health21,22.
Karademas et al.8 say that the major determinant of children’s and adolescents’ health
and psychological indicators is the social environment in which they grow up and live, such
Figure 2. Presence of family quarrels, relationship with parents, ights with parents and family structure among adolescents (n = 1,042). Beagá Health Study, 2008 – 2009.
Many quarrels
Bad relation shipswith
parents (p < 0.001)
My parents and I argue a lot
(p < 0.001)
Stepfamilies Single-parents
Family Structure (p = 0.539) Nuclear
Quarrel in Family (%)
Few quarrels
There are no quarrels 50
60 70
40
30
20
10
549
as family and school. They showed the strong relationship of family-related factors with children and adolescents’ health.
In our study, regarding family context, only one variable remained in the inal model: report of quarrels, with a remarkable dose-response with poor SRH. The highest magnitude of association was with many quarrels (OR = 4.53), despite large 95% conidence intervals, due to a relatively small sample (n = 99). These indings corroborate previous studies reporting the importance of the family environment on the self-rated health of adolescents8,10. Looking
at the univariate association and trying to understand the above inding, we performed a bivariate analysis of reports of quarrels and the relationship of the adolescents with parents. It was noted that adolescents who reported quarrels in the family also reported worse relationships with parents (Figure 2), suggesting that quarrels that occurred in the family might be related to the adolescents and their parents, possibly explaining why the model could not include both variables.
The existence of family conlicts seems to be more important for the self-rated health of adolescents than the other variables in the family domain of the framework proposed (Figure 1). Mechanic and Hansell6 found that family structure is not associated with physical
and psychological symptoms, unlike the existence of family conlicts. Other studies show that adolescents who live in single-parent families have worse health assessments, but they argued that this is not a direct efect, and is probably mediated by family SES and the quality of family interactions10. A previous study9 suggested that parental support may be more important than
support from peers or other adults to promote a better self-rated health in adolescents. Adolescents who consider their colleagues as unkind and unhelpful had poorer SRH as compared to their counterparts. This variable is part of the social subdomain of the conceptual model proposed, and can inform about the relationships with colleagues/ peers. Some authors show that peer support also inluences adolescent health. In particular, relationships with colleagues are one of the most important parts of an adolescent’s social life; being supported by friends is associated with better self-rated health4,9,10.
In the lifestyle domain, unhealthy behaviors, represented by the low consumption of fruit and physical inactivity, were associated with poor SRH. Previous studies3,23-25 with adults
have found persistent relationships between dietary habits, physical activity and SRH. In the study based on the Nord-Trøndelag Health Study (HUNT), which included 2,741 adolescents aged 13 – 19 years old, the absence of exercise was associated with poor self-rated health7.
In the literature4,26, we also found that physical health status is a relevant predictor of
SRH among adolescents, despite the inluence of personal, socio-environmental, behavioral and psychological factors. Considering BMI as an objective physical health indicator, being overweight remained associated with health perception in the inal model. According to the literature, a high BMI may inluence the subjective health of individuals4.
SRH. So, we can add to the body of the literature the same inding for adolescents living in an urban area in a developing country.
The Beagá Health Study seems to have external validity when compared with some estimates provided by the School-based Health Survey (PeNSE, 2009). This school survey interviewed 60,973 adolescents in the 9th grade of elementary school (13 to 15 years old) in all
Brazilian capitals and the Federal District in 200916. The citywide PeNSE showed that in Belo
Horizonte 36.8% of school children reported fruit consumption in ive or more days per week, similar to that found herein (35.0%). Likewise, regarding violence in Belo Horizonte, the proportion of adolescents involved in ights (12.9%) was very similar to that found in this study (14.6%). PeNSE, like other studies involving adolescents in Brazil, did not evaluate SRH, which precludes comparison with the results of our study.
Possible limitations include the cross-sectional nature of this study, which does not allow causal or temporal inferences about the associations found26. Also, researching SRH poses
diiculties because of the need for extensive information that enables researchers to control for potential confounders27. Although the present study included information regarding
diferent aspects of adolescent health and its determinants, it did not investigate reported morbidity, but only objectively measured the weights and heights of participants. Thus, a more in-depth analysis regarding the physical health dimensions of SRH was limited.
Importantly, the Odds Ratio can overestimate or underestimate the strength of an association. But the choice of Binary Logistic Regression, which provides the Odds Ratio, was made on the basis of this method being suitable for outcomes considered “rare”, as is the case in the present study that the prevalence of poor SRH was equal to 11.2% in the total sample, and 7.63% among teens aged 11 – 13 years old, and 13.71% between adolescents aged 14 – 17 years old.
Moreover, other factors not investigated here may also be associated with subjective health and may interact with the blocks studied, such as relationship with teachers, presence of siblings, reports of co-morbidity, child labor, and/or domestic violence.
CONCLUSIONS
Self-rated health and its determinants, as reported in this study, have been only incipiently evaluated in the literature, despite its importance and contemporaneity. In our study population, SRH was associated with individual and socio-environmental factors, including family, peers, school and neighborhood. This composition reassembles the theoretical framework of child well-being proposed by UNICEF14, which was considered a strong
indicator of social inequities28.
551
1. Larson JS. The World Health Organization’s deinition of health: Social versus spiritual health. Soc Indic Res 1996; 38(2): 181-92.
2. Boardman JD. Self-rated health among U.S. adolescents. J Adolesc Health 2006; 38(4): 401-8.
3. Idler EL, Benyamini Y. Self-rated health and mortality: a review of twenty-seven community studies. J Health Soc Behav 1997; 38(1): 21-37.
4. Vingilis ER, Wade TJ, Adlaf E. What factors predict student self-rated physical health? J Adolesc 1998; 21(1): 83-97. 5. Page RM, Suwanteerangkul J. Self-rated health,
psychosocial functioning, and health-related behavior among Thai adolescents. Pediatr Int 2009; 51(1): 120-5. 6. Mechanic D, Hansell S. Adolescent competence,
psychological well-being, and self-assessed physical health. J Health Soc Behav 1987; 28(4): 364-74. 7. Breidablik HJ, Meland E, Lydersen S. Self-rated health in
adolescence: a multifactorial composite. Scand J Public Health 2008; 36(1): 12-20.
8. Karademas EC, Peppa N, Fotiou A, Kokkevi A. Family, school and health in children and adolescents: indings from the 2006 HBSC study in Greece. J Health Psychol 2008; 13(8): 1012-20.
9. Vilhjalmsson R. Efects of Social Support on Self-Assessed Health in Adolescence. J Youth Adolesc 1994; 23(4):437-52. 10. Heard HE, Gorman BK, Kapinus CA. Family structure and self-rated health in adolescence and young adulthood. Popul Res Policy Rev 2008; 27(6): 773-97.
11. Call KT, Nonnemaker J. Socioeconomic disparities in adolescent health: contributing factors. Ann N.Y. Acad Sci 1999; 896: 352-5.
12. Braga LS, Macinko J, Proietti FA, César CC, Lima-Costa MF. Diferenciais intra-urbanos de vulnerabilidade da população idosa. Cad Saúde Pública 2010; 26(12): 2307-15. 13. Friche AA, Diez-Roux AV, César CC, Xavier CC, Proietti FA, Caiafa WT. Assessing the psychometric and ecometric properties of neighborhood scales in developing countries: Saúde em Beagá Study, Belo Horizonte, Brazil, 2008-2009. J Urban Health 2013; 90(2): 246-61.
14. United Nations Children’s Fund. Child poverty in perspective: An overview of child well-being in rich countries. Florence: UNICEF Innocenti Research Centre; 2007. (Report Card nº 7)
15. Universidade Federal de Pelotas (CPE/UFPel). Centro de Pesquisas Epidemiológicas. Estudo da Coorte de nascimentos de 1993 em Pelotas/RS. Pelotas: Faculdade de Medicina/Universidade Federal de Pelotas; 1993. Available from: http://www.epidemio-ufpel.org.br/site/ content/coorte_1993/index.php (Cited Mar 09, 2012).
16. Brasil. Instituto Brasileiro de Geograia e Estatística. Pesquisa Nacional de Saúde do Escolar (PeNSE-2009). Rio de Janeiro: IBGE; 2009.
17. World Health Organization. Physical status: the use and Interpretation of Anthropometry. Geneva: WHO; 1995. (Technical Report Series No. 854)
18. McDowell I, Newell C. Measuring health: A guide to rating scales and questionnaires. New York: Oxford University Press; 1996.
19. Silva RA, Horta BL, Pontes LM, Faria AD, Souza LDM, Cruzeiro ALS, et al. Bem-estar psicológico e adolescência: fatores associados. Cad Saúde Pública 2007; 23(5): 1113-8. 20. de Onis M, Onyango AW, Borghi E, Siyam A, Nishida C, Siekmann J. Development of a WHO growth reference for school-aged children and adolescents. Bull World Health Organ 2007; 85(9): 660-7. 21. Martikainen P, Adda J, Ferrie JE, Smith GD, Marmot
M. Efects of income and health on GHQ depression and poor self rated health in white collar females and males in the Whitehall II study. J Epidemiol Community Health 2003; 57(9): 718-23.
22. Szwarcwald CL, Souza-Júnior PRB, Esteves MAP, Damacena GN, Viacava F. Socio-demographic determinants of self-rated health in Brazil. Cad Saúde Pública 2005; 21: S54-64.
23. Peres MA, Masiero AV, Longo GZ, Rocha GC, Matos IB, Najnie K, et al. Auto-avaliação da saúde em adultos no Sul do Brasil. Rev Saúde Pública 2010;44(5): 901-11. 24. Tsai J, Ford ES, Li C, Zhao G, Pearson WS, Balluz LS.
Multiple healthy behaviors and optimal self-rated health: indings from the 2007 Behavioral Risk Factor Surveillance System Survey. Prev Med 2010; 51(3-4): 268-74. 25. Harrington J, Perry IJ, Lutomski J, Fitzgerald AP, Shiely
F, McGee H, et al. Living longer and feeling better: healthy lifestyle, self-rated health, obesity and depression in Ireland. Eur J Public Health 2009; 20(1): 91-5. 26. Barros MBA, Zanchetta LM, Moura EC, Malta DC.
Auto-avaliação da saúde e fatores associados, Brasil, 2006. Rev Saúde Pública 2009; 43(S2): 27-37. 27. Franks P, Gold MR, Fiscella K. Sociodemographics,
self-rated health, and mortality in the US. Soc Sci Med 2003; 56(12): 2505-14.
28. Pickett KE, Wilkinson RG. Child wellbeing and income inequality in rich societies: ecological cross sectional study. BMJ 2007; 335: 1080-5.
Received on: 03/13/2014
Final version presented on: 10/18/2014 Accepted on: 11/07/2014