Maria Helena Baena de Moraes Lopes
I, Juliana Neves da Costa
I, Mariana Bezzon Bicalho
II,
Ticiane Ellen Casale
I, Agnês Raquel
Camisão
I, Marcella Lima Victal Fernandes
II Universidade Estadual de Campinas, Nursing School. Campinas, São Paulo, Brazil. II Universidade de São Paulo, Ribeirão Preto College of Nursing. Ribeirão Preto, São Paulo, Brazil.
How to cite this article:
Lopes MHBM, Costa JN, Bicalho MB, Casale TE, Camisão AR, Fernandes MLV. Profile and quality of life of women in pelvic floor rehabilitation. Rev Bras Enferm [Internet]. 2018;71(5):2496-505. DOI: http://dx.doi.org/10.1590/0034-7167-2017-0602
Submission: 10-08-2017 Approval: 02-06-2018
ABSTRACT
Objective: Describe the sociodemographic, clinical, and sexual profi le, identify profi le variables that affect the Health-Related Quality of
Life (HRQoL), and evaluate the correlation between two HRQoL questionnaires used in a pelvic fl oor rehabilitation program. Method:
This is an observational, analytical, and cross-sectional study, based on patient records and two questionnaires for HRQoL evaluation.
Results: Women presented a mean age of 55.4 years; were married; white; had stress, urge, or mixed urinary incontinence (UI) of moderate to large urine release; and daily or diurnal UI. Only 50.5% had an active sex life and most had sexual complaints. The change
in sexual activity and some types of UI affected the HRQoL. The two questionnaires presented a correlation. Conclusion: The profi le and
correlation between the questionnaires are consistent with the literature. The type of UI and changes in sexual activity affect the HRQoL.
Descriptors: Pelvis Diaphragm; Nursing; Urinary Incontinence; Quality of Life; Women’s Health.
RESUMO
Objetivo: Descrever o perfi l sociodemográfi co, clínico e sexual, identifi car variáveis do perfi l que interferem na Qualidade de Vida Relacionada à Saúde (QVRS) e avaliar correlação entre dois questionários de QVRS usados em um Programa de
Reabilitação do Assoalho Pélvico. Método: Estudo observacional, analítico e transversal, com base em fi chas de atendimento e
dois questionários de avaliação da QVRS. Resultados: As mulheres possuíam idade média de 55,4 anos, eram casadas, brancas,
tinham incontinência urinária (IU) de esforço, de urgência ou mista, com perdas urinárias de moderada a grande quantidade, diárias e diurnas. Apenas 50,5% tinham vida sexual ativa e a maioria apresentava queixas sexuais. A mudança na atividade
sexual e alguns tipos de IU afetaram a QVRS. Os dois questionários apresentaram correlação. Conclusão: O perfi l e a correlação
entre os questionários condizem com a literatura. Tipo de IU e mudança na atividade sexual afetam a QVRS.
Descritores: Diafragma da Pelve; Enfermagem; Incontinência Urinária; Qualidade de Vida; Saúde da Mulher.
RESUMEN
Objetivo: Describir el perfi l sociodemográfi co, clínico y sexual; identifi car variables del perfi l que interfi eren en la Calidad de Vida Relacionada a la Salud (CVRS) y evaluar correlación entre dos cuestionarios de CVRS usados en un Programa de
Rehabilitación del Piso Pélvico. Método: Estudio observacional, analítico, transversal, basado en fi chas de atención y en dos
cuestionarios de evaluación de CVRS. Resultados: La media etaria de las mujeres era de 55,4 años, casadas, blancas, con
incontinencia urinaria (IU) de esfuerzo, de urgencia o mixta, con pérdidas urinarias de moderada a gran cantidad, diarias y diurnas. Solo 50,5% llevaba vida sexual activa. La mayoría expresaba quejas sexuales. El cambio en la actividad sexual y
algunos tipos de IU afectaron la CVRS. Los cuestionarios demostraron correlación. Conclusión: El perfi l y la correlación entre
ambos cuestionarios concuerdan con la literatura. El tipo de UI y los cambios en la actividad sexual afectan la CVRS.
Descriptores: Diafragma Pélvico; Enfermería; Incontinencia Urinaria; Calidad de Vida; Salud de la Mujer.
Profi le and quality of life of women in pelvic fl oor rehabilitation
Perfi l e qualidade de vida de mulheres em reabilitação do assoalho pélvico
Perfi l y calidad de vida de mujeres en rehabilitación del piso pélvico
Juliana Neves da Costa E-mail: julianancosta@yahoo.com.br
Lopes MHBM, Costa JN, Bicalho MB, Casale TE, Camisão AR, Fernandes MLV.
INTRODUCTION
The prevalence of urinary incontinence (UI) among women
varies from 25% to 30%(1). Women with UI report physical and
social limitations. In addition to having a negatively affected emotional state and social life, they are strongly impacted by
the disease in terms of health-related quality of life (HRQoL)(2).
Learning about the profile and evaluating the impact of UI on the HRQoL of these women allows for a better understand-ing of the patient’s point of view. In addition, identifyunderstand-ing and characterizing factors related to HRQoL in women with UI can lead to the development of preventive, diagnostic, and
therapeu-tic strategies to improve the QoL of this population(2) and may
help identify predictors for the definition of treatment options(3).
The Pelvic Floor Rehabilitation Program (PFRP) is an ex-tension project that helps women with UI and other pelvic floor disorders; and trains undergraduates, postgraduates, and health professionals for the provision of care to such women. It uses health education strategies and promotes pelvic floor muscle training and electrotherapy through individual activi-ties performed by the nurse for the treatment and prevention of these disorders. In this program, the process of evaluation and measurement of treatment results is performed using proper instruments, such as the bladder diary and the tampon test, and HRQoL evaluation questionnaires specifically used for UI already validated in Brazil: the International Consultation on Incontinence Questionnaire-Short Form (ICIQ-SF); and the King’s Health Questionnaire (KHQ).
HRQoL is an important aspect in the evaluation of the results of the UI treatment. However, the questionnaires to be applied should be validated and reliable, which can add relevant information to clinical practice and that are easily
applicable(4). For this reason, these specific questionnaires
for patients with UI and lower urinary tract symptoms (LUTS) were selected.
Considering the above, the objectives of this study were to describe the sociodemographic, clinical, sexual and HRQoL profile of women treated in the PFRP; evaluate which char-acteristics of the profile affect the HRQoL; and check for a correlation between the results obtained with the application of the two HRQoL questionnaires used in this program. The correlation between the two questionnaires was evaluated in
the processes of translation and validation in Portuguese(5),
but it is recommended to confirm the results in a different population.
OBJECTIVES
Primary objective
To describe the sociodemographic, clinical, sexual, and HRQoL profile of women from the PFRP.
Secondary objectives
To evaluate which characteristics of the profile affect the HRQoL and verify if there is a correlation between the results obtained with the application of the two HRQoL questionnaires used in this program.
METHOD
Ethical aspect
The study was approved by the Research Ethics Committee of Universidade Estadual de Campinas.
Study design
This is an observational, analytical, and retrospective study.
Study site
Data were obtained from patient records and through the ap-plication of HRQoL questionnaires given to women who started treatment for UI in the PFRP at a basic healthcare unit in the municipality of Campinas, São Paulo. The description of patients
seen there and the protocols have already been published(6).
Participants and sample size
The study included HRQoL records and questionnaires that corresponded to the initial care provided in the PFRP, which presented sociodemographic data, records of signs and symptoms of UI or lower urinary tract symptoms, evaluation of complaints, sex life information, physical examination, and HRQoL assess-ment. The study sample consisted of the records of 94 women seen in the PFRP from March 2007 to December 2016.
Variables
According to the study objectives, the following independent variables were selected from patient records: sociodemographic characteristics (age, marital status, color, schooling); clinical characteristics (weight and BMI); types of UI (stress UI [SUI], urge UI [UUI], mixed UI [MUI], and nocturnal enuresis); amount of urine release (drops, small, moderate, large); frequency of urine release (sporadically, at least once a month, at least once a week, daily); period of the day when urine was lost (day, night, day and night); comorbidities; sexual activity (active or inactive); sexual problems (vaginal dryness, dyspareunia); urine release during intercourse or coital incontinence (yes or no); self-assessment of sex life (very good, good, satisfactory, bad, very bad); changes in sexual activity due to UI (yes or no). The QoL scores of the KHQ questionnaire were defined as dependent variables. The sociode-mographic, clinical, and sexual profile variables were analyzed only in relation to the KHQ domains. In addition to these eight domains, the Severity Measures (SM) scale was included in the
analysis, as performed in a previous study(7).
Data measurement
The ICIQ-SF is composed of four questions, which add up to 21 points as follows: assessment of urine release frequency (0-5 points); amount of urine release (0-6 points); impact of UI on the QoL (0-10 points); and a self-diagnosis of the perception of incontinence causes. The ICIQ-SF score is calculated adding the scores of questions 3, 4, and 5. The scores range from 0 to
21; the higher the score obtained, the worse the QoL(7).
items); Emotions (E–3 items); and Sleep/energy (S/E–2 items)(5). In
addition to these domains, the KHQ includes two independent scales: Severity measures, which evaluates the UI severity; and the Symptom severity scale, which analyzes the presence and intensity of urinary symptoms. The analysis is based on each domain, so there is no general score. The eight domains are scored between
0 and 100; higher scores indicate worse QoL in that domain(5).
Data analysis
In addition to the descriptive analysis of the variables, the Spearman’s coefficient was calculated verify if there is a correlation between the ICIQ-SF score and the KHQ domains and severity measures; and a correlation between the profile characteristics and the QoL. Non-parametric Mann-Whitney or Kruskal-Wallis tests were used to evaluate the interference of the following variables in the QoL: SUI; UUI; MUI; nocturnal enuresis; sexual activity; vaginal dryness; dyspareunia; and change in sexual activity.
RESULTS
In addition to patient records, the HRQoL questionnaires of 94 women were analyzed. The mean age of participants was 55.4 (SD=16.24) years. Most of them were married (50.5%), with incomplete high school (55.3%), and white (86.5%). Their mean weight was 69.87 kg (SD=15.78) and BMI was 28.36 (SD=6.01). The most frequent types of UI were SUI (77.7%) and UUI (53.2%). As MUI refers to simultaneous occurrence of the two types, some cases were MUI (43 cases, or 45.7%). Most of them reported moderate to large urine release (58.1%), daily (71.8%), and diurnal (51.2%). Regarding sexual activity, most of them were sexually active (50.5%), and complained of vaginal dryness (54.8%) and dyspareunia (50.9%), but considered their sex life as good or optimal (54%). Regard-ing coital incontinence, 38.6% reported urine release durRegard-ing intercourse. Most of them (68.8%) did not report changes in sexual activity due to UI, including cases with and without coital incontinence. Regarding comorbidities, they presented systemic arterial hypertension (SAH) more frequently (45.7%).
Table 1 shows the significant correlations between sociode-mographic variables and KHQ domains. The correlations are weak, with negative correlations between age and social limita-tions and between age and sleep/energy.
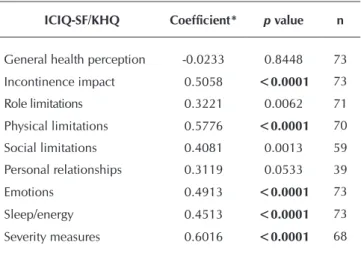
A correlation was observed between practically all KHQ domains and ICIQ-SF scores, except for the domains of general health perception and personal relationships. For the domains of incontinence impact (r=0.5058, p<0.0001), physical limitations (r=0.5776, p<0.0001), and severity measures (r=0.6016, p<0.0001), the correlation was positive and moderate (Table 2).
Table 1 – Significant correlations between the sociodemo-graphic variables and the King’s Health Question-naire domains among women attending the Pelvic Floor Rehabilitation Program, Campinas, São Paulo, Brazil, 2016
Correlation Coefficient* p value n
Weight x Role limitations 0.3223 0.0128 59
Age x Social limitations -0.3012 0.0194 60
Age x Sleep/energy -0.2337 0.0451 74
Weight x Severity measures 0.2723 0.0405 57
Note: *Spearman’s correlation coefficient.
Table 2 – Correlation between the score from the International Consultation on Incontinence Questionnaire-Short Form and the King’s Health Questionnaire domains among women attending the Pelvic Floor Rehabilitation Program, Campinas, São Paulo, Brazil, 2016
ICIQ-SF/KHQ Coefficient* p value n
General health perception -0.0233 0.8448 73
Incontinence impact 0.5058 <0.0001 73
Role limitations 0.3221 0.0062 71
Physical limitations 0.5776 <0.0001 70
Social limitations 0.4081 0.0013 59
Personal relationships 0.3119 0.0533 39
Emotions 0.4913 <0.0001 73
Sleep/energy 0.4513 <0.0001 73
Severity measures 0.6016 <0.0001 68
Note: *Spearman’s correlation coefficient.
Chart 1 below shows the comparisons between the KHQ domains and UI types. Considering the different UI types, the impact was higher in participants with UUI (p=0.0117) or MUI (p=0.0020). The same was observed between Role limitations and UUI (p=0.0147) and MUI (p=0.0259), and between Severity measures and MUI (p=0.0104). Nocturnal enuresis had an impact on the following domains: Role limita-tions (p=0.0063); Physical limitalimita-tions (p=0.0163); Emolimita-tions (p=0.0070); and Severity measures (p=0.0048). Missing data due to unanswered questions led to varied numbers of responses in Chart 1.
It should be noted that, because the symptom presence or absence was analyzed, some cases presented concomitant SUI and MUI or UUI and coital incontinence. Although coital
incontinence is a type of UI(8), its related data are presented in
Lopes MHBM, Costa JN, Bicalho MB, Casale TE, Camisão AR, Fernandes MLV.
Chart 1 – Comparisons between the King’s Health Questionnaire domains and the urinary incontinence types, Campinas, São Paulo, Brazil, 2016
Domain SUI n Mean Standard deviation Min. Q1 Median Q3 Max. p value*
GHP Yes 62 38.71 19.03 0.00 25.00 25.00 50.00 75.00 0.8376
No 14 39.29 21.29 25.00 25.00 25.00 50.00 75.00
II Yes 62 62.37 33.32 0.00 33.33 66.67 100.00 100.00 0.6887
No 14 59.52 32.50 33.33 33.33 33.33 100.00 100.00
RL Yes 59 42.37 34.51 0.00 16.67 33.33 66.67 100.00 0.8465
No 13 42.31 41.73 0.00 0.00 33.33 83.33 100.00
PL Yes 59 40.68 35.32 0.00 0.00 33.33 66.67 100.00 0.6724
No 12 37.50 42.71 0.00 0.00 25.00 83.33 100.00
SL Yes 50 22.44 26.98 0.00 0.00 11.11 33.33 88.89 0.9835
No 10 25.56 32.73 0.00 0.00 11.11 55.56 77.78
PR Yes 32 30.21 32.91 0.00 0.00 33.33 41.67 100.00 0.3339
No 8 52.08 48.34 0.00 0.00 58.33 100.00 100.00
E Yes 61 38.62 32.18 0.00 11.11 33.33 66.67 100.00 0.4432
No 12 48.15 37.41 0.00 22.22 33.33 83.33 100.00
S/E Yes 61 37.16 28.93 0.00 16.67 33.33 50.00 100.00 0.6067
No 13 32.05 28.43 0.00 16.67 33.33 33.33 100.00
SM Yes 58 48.16 25.07 0.00 26.67 46.67 66.67 100.00 0.4990
No 11 44.24 23.53 20.00 26.67 46.67 60.00 100.00
Domain UUI n Mean Standard deviation Min. Q1 Median Q3 Max. p value*
GHP Yes 42 37.50 20.10 0.00 25.00 25.00 50.00 75.00 0.4078
No 34 40.44 18.48 0.00 25.00 50.00 50.00 75.00
II Yes 42 70.63 28.71 0.00 33.33 66.67 100.00 100.00 0.0117
No 34 50.98 35.04 0.00 33.33 33.33 100.00 100.00
RL Yes 42 50.40 34.63 0.00 33.33 41.67 83.33 100.00 0.0147
No 30 31.11 34.39 0.00 0.00 16.67 66.67 100.00
PL Yes 41 45.12 38.59 0.00 0.00 50.00 83.33 100.00 0.2564
No 30 33.33 32.46 0.00 0.00 33.33 66.67 100.00
SL Yes 36 22.53 24.70 0.00 0.00 16.67 33.33 77.78 0.6204
No 24 23.61 32.32 0.00 0.00 5.56 44.44 88.89
PR Yes 24 39.58 37.04 0.00 0.00 33.33 58.33 100.00 0.1869
No 18 27.08 36.45 0.00 0.00 8.33 33.33 100.00
E Yes 42 42.86 32.05 0.00 22.22 33.33 66.67 100.00 0.3239
No 31 36.56 34.45 0.00 11.11 33.33 66.67 100.00
S/E Yes 42 40.08 26.81 0.00 16.67 33.33 50.00 100.00 0.0568
No 32 31.25 30.75 0.00 16.67 16.67 50.00 100.00
SM Yes 42 51.75 24.14 0.00 33.33 53.33 73.33 93.33 0.0739
No 27 40.99 24.58 0.00 20.00 40.00 60.00 100.00
Domain MUI n Mean Standard deviation Min. Q1 Median Q3 Max. p value*
GHP Yes 37 38.51 20.06 0.00 25.00 25.00 50.00 75.00 0.9096
No 39 39.10 18.84 0.00 25.00 25.00 50.00 75.00
II Yes 37 73.87 27.37 0.00 66.67 66.67 100.00 100.00 0.0020
No 39 50.43 34.09 0.00 33.33 33.33 100.00 100.00
RL Yes 36 50.93 33.79 0.00 33.33 50.00 75.00 100.00 0.0259
No 36 33.80 35.74 0.00 0.00 16.67 66.67 100.00
PL Yes 35 48.57 38.00 0.00 0.00 66.67 83.33 100.00 0.0802
No 36 31.94 33.18 0.00 0.00 25.00 58.33 100.00
SL Yes 31 23.66 24.97 0.00 0.00 22.22 33.33 77.78 0.3796
No 29 22.22 30.86 0.00 0.00 0.00 44.44 88.89
Domain MUI n Mean Standard deviation Min. Q1 Median Q3 Max. p value*
PR Yes 20 35.83 34.32 0.00 0.00 33.33 50.00 100.00 0.5271
No 20 33.33 40.10 0.00 0.00 25.00 58.33 100.00
E Yes 36 44.83 32.20 0.00 22.22 33.33 72.22 100.00 0.2821
No 37 36.64 33.83 0.00 11.11 33.33 66.67 100.00
S/E Yes 36 41.20 27.74 0.00 16.67 33.33 50.00 100.00 0.0668
No 36 31.58 29.20 0.00 16.67 16.67 50.00 100.00
SM Yes 36 54.63 24.21 0.00 36.67 60.00 73.33 100.00 0.0104
No 33 39.80 23.18 0.00 20.00 33.33 60.00 100.00
Domain Nocturnal enuresis n Mean Standard deviation Min. Q1 Median Q3 Max. p value*
GHP Yes 23 41.30 20.79 0.00 25.00 50.00 50.00 75.00 0.4622
No 55 37.74 18.75 0.00 25.00 25.00 50.00 75.00
II Yes 23 72.46 27.80 33.33 33.33 66.67 100.00 100.00 0.0742
No 53 57.23 34.20 0.00 33.33 66.67 100.00 100.00
RL Yes 24 59.72 38.04 0.00 33.33 66.67 100.00 100.00 0.0063
No 48 33.68 31.23 0.00 0.00 33.33 58.33 100.00
PL Yes 23 55.07 36.73 0.00 16.67 66.67 100.00 100.00 0.0163
No 48 32.99 34.29 0.00 0.00 25.00 66.67 100.00
SL Yes 20 30.00 32.66 0.00 0.00 22.22 66.67 77.78 0.3558
No 40 19.44 24.62 0.00 0.00 11.11 33.33 88.89
PR Yes 13 30.77 35.25 0.00 0.00 33.33 33.33 100.00 0.7300
No 27 36.42 38.13 0.00 0.00 33.33 66.67 100.00
E Yes 24 55.09 33.65 0.00 27.78 55.56 88.89 100.00 0.0070
No 49 32.88 30.43 0.00 11.11 33.33 44.44 100.00
S/E Yes 24 47.22 33.21 0.00 16.67 41.67 75.00 100.00 0.0625
No 51 31.00 24.97 0.00 16.67 33.33 50.00 100.00
SM Yes 22 60.61 25.52 13.33 46.67 63.33 80.00 100.00 0.0048
No 47 41.42 22.02 0.00 20.00 40.00 60.00 86.67
Note: GHP – General health perception; II – Incontinency impact; RL – Role limitations; PL – Physical limitations; SL – Social limitations; PR – Personal relation-ships; E – Emotions; S/E - Sleep/energy; SM – Severity measures. *p-value obtained through the Mann-Whitney test.
Chart 2 – Comparisons between the King’s Health Questionnaire domains and the aspects related to sexual activity, Campinas, São Paulo, Brasil, 2016
Domain Sexual activity n Mean Standard deviation Min. Q1 Median Q3 Max. p value*
GHP Yes 39 38.46 19.74 0.00 25.00 25.00 50.00 75.00 0.9051
No 37 39.19 19.13 0.00 25.00 25.00 50.00 75.00
II Yes 39 64.10 29.99 0.00 33.33 66.67 100.00 100.00 0.6275
No 37 59.46 36.12 0.00 33.33 66.67 100.00 100.00
RL Yes 39 43.16 34.98 0.00 16.67 33.33 66.67 100.00 0.7827
No 33 41.41 36.83 0.00 0.00 33.33 66.67 100.00
PL Yes 39 41.88 36.25 0.00 0.00 33.33 66.67 100.00 0.5955
No 33 38.02 36.96 0.00 0.00 33.33 66.67 100.00
SL Yes 34 25.82 28.13 0.00 0.00 22.22 44.44 77.78 0.3390
No 26 19.23 27.32 0.00 0.00 11.11 22.22 88.89
PR Yes 34 34.80 34.66 0.00 0.00 33.33 50.00 100.00
-No 6 33.33 51.64 0.00 0.00 0.00 100.00 100.00
E Yes 38 42.40 32.25 0.00 11.11 33.33 66.67 100.00 0.4515
No 35 37.78 34.11 0.00 11.11 33.33 68.67 100.00
S/E Yes 39 38.03 28.08 0.00 16.67 33.33 50.00 100.00 0.3647
No 35 34.29 29.69 0.00 16.67 16.67 50.00 100.00
SM Yes 35 50.29 23.17 0.00 33.33 46.67 66.67 93.33 0.3133
No 34 44.71 26.24 0.00 20.00 43.33 60.00 100.00
Chart 1 (concluded)
Lopes MHBM, Costa JN, Bicalho MB, Casale TE, Camisão AR, Fernandes MLV.
Domain Vaginal dryness n Mean Standard deviation Min. Q1 Median Q3 Max. p value*
GHP Yes 32 36.72 21.05 0.00 25.00 25.00 50.00 75.00 0.7290
No 22 38.64 16.77 25.00 25.00 25.00 50.00 75.00
II Yes 32 62.50 32.52 0.00 33.33 66.67 100.00 100.00 0.7319
No 22 65.15 34.85 0.00 33.33 66.67 100.00 100.00
RL Yes 32 38.54 34.51 0.00 8.33 33.33 66.67 100.00 0.5663
No 21 45.24 37.69 0.00 16.67 33.33 66.67 100.00
PL Yes 31 31.72 33.98 0.00 0.00 16.67 66.67 100.00 0.1260
No 21 47.62 38.47 0.00 16.67 33.33 66.67 100.00
SL Yes 29 19.16 23.17 0.00 0.00 11.11 33.33 77.78 0.3344
No 15 28.15 29.36 0.00 0.00 22.22 55.56 77.78
PR Yes 19 26.32 33.48 0.00 0.00 16.67 50.00 100.00 0.1229
No 16 42.71 34.94 0.00 25.00 33.33 66.67 100.00
E Yes 31 34.41 31.99 0.00 0.00 33.33 55.56 100.00 0.0548
No 21 50.26 29.53 0.00 33.33 44.44 66.67 100.00
S/E Yes 32 32.81 28.55 0.00 16.67 33.33 50.00 100.00 0.1732
No 21 43.65 29.10 0.00 16.67 33.33 66.67 100.00
SM Yes 28 47.62 25.58 0.00 30.00 46.67 60.00 100.00 0.8154
No 21 48.89 26.02 0.00 33.33 46.67 60.00 100.00
Domain Dyspareunia n Mean Standard deviation Min. Q1 Median Q3 Max. p value*
GHP Yes 25 41.00 20.26 0.00 25.00 50.00 50.00 75.00 0.4982
No 23 36.96 21.15 0.00 25.00 25.00 50.00 75.00
II Yes 25 64.00 33.22 0.00 33.33 66.67 100.00 100.00 0.8196
No 23 62.32 32.26 0.00 33.33 66.67 100.00 100.00
RL Yes 25 37.33 32.73 0.00 16.67 33.33 66.67 100.00 0.3068
No 21 49.21 38.90 0.00 16.67 33.33 100.00 100.00
PL Yes 25 37.33 35.12 0.00 0.00 33.33 66.67 100.00 0.3828
No 20 47.50 38.34 0.00 8.33 50.00 75.00 100.00
SL Yes 21 22.75 24.21 0.00 0.00 22.22 33.33 77.78 0.8044
No 18 23.46 28.74 0.00 0.00 11.11 44.44 77.78
PR Yes 19 27.19 34.79 0.00 0.00 16.67 50.00 100.00 0.2013
No 15 37.78 31.16 0.00 16.67 33.33 50.00 100.00
E Yes 24 37.96 31.58 0.00 11.11 33.33 66.67 100.00 0.2914
No 21 47.09 30.41 0.00 22.22 44.44 66.67 100.00
S/E Yes 25 39.33 28.82 0.00 16.67 33.33 50.00 100.00 0.7961
No 21 42.86 30.08 0.00 16.67 33.33 66.67 100.00
SM Yes 21 51.43 23.68 0.00 40.00 53.33 60.00 93.33 0.7519
No 21 50.79 27.61 0.00 33.33 46.67 73.33 100.00
Domain Coital
incontinence n Mean Standard deviation Min. Q1 Median Q3 Max. p value*
GHP Yes 20 33.75 20.32 0.00 25.00 25.00 50.00 75.00 0.3772
No 30 40.83 20.22 25.00 25.00 25.00 50.00 75.00
II Yes 20 66.67 34.20 0.00 33.33 66.67 100.00 100.00 0.4910
No 30 61.11 31.66 0.00 33.33 66.67 100.00 100.00
RL Yes 20 54.17 38.95 0.00 16.67 66.67 91.67 100.00 0.1783
No 29 38.51 33.95 0.00 16.67 33.33 66.67 100.00
PL Yes 19 46.49 39.51 0.00 0.00 66.67 83.33 100.00 0.5653
No 28 38.10 34.50 0.00 8.33 33.33 66.67 100.00
SL Yes 16 33.33 32.96 0.00 0.00 16.67 66.67 77.78 0.2181
No 25 18.67 23.73 0.00 0.00 11.11 22.22 77.78
PR Yes 15 43.33 36.08 0.00 16.67 33.33 83.33 100.00 0.1994
No 22 30.30 37.67 0.00 0.00 16.67 50.00 100.00
E Yes 20 43.89 27.57 0.00 27.78 33.33 61.11 100.00 0.9579
No 28 44.44 35.14 0.00 11.11 38.89 72.22 100.00
DISCUSSION
UI can affect the QoL of women and their psychological
and social wellbeing(9), depending on the severity and type
of incontinence, and the number of urine release episodes in
women affected by these symptoms(2). Because it is a
multi-factorial etiology, UI affects several dimensions of the QoL of women, such as physical condition, cognitive function, sexual satisfaction, daily activities, emotional wellbeing, and family and
social life(10). These patients may feel embarrassed, anguished,
and stressed due to UI, and experience impaired self-confidence
and fear that other people will notice it(11).
Despite its high prevalence and negative impact on quality of
life(3), the public health system still has no specialized services
to provide care to these women, and the PFRP is a pioneer-ing initiative. However, some factors may influence the low number of participants in the program, such as embarrassment and belief that UI is part of the aging process, among others. In addition, care is provided once a week to up to four patients per day, with each patient having a follow-up of 12 weeks or more, which limits the capacity for care.
In the present study, nocturnal enuresis affected four KHQ domains: Role limitations; Physical limitations and Emotions;
and Severity measures, as observed in a previous study(12),
in which women with nocturnal enuresis presented worse QoL. UUI affected the domains of Incontinence impact and Role limitations. MUI affected the same domains and Severity
measures. Because MUI is a situation of both SUI and UUI, the results were expected to be similar to those found for UUI cases which, due to the unpredictability of urine release epi-sodes, may cause greater embarrassment. In addition, the loss of urine in stress situations can explain the greater number of domains affected when compared to the UUI. In MUI, as it involves UUI, its impact on the QoL of these women may be particularly important, because UUI increases with age and
becomes the most prevalent type among elderly women(1). These
findings are similar to those obtained in a study conducted with
Spanish women(13), in which the HRQoL dimensions related to
daily activities (work, study, and household activities, among others) and self-care (bathing and dressing) were worse in the UI women.
SUI did not affect any KHQ domain, in agreement with a
previous study(14) in which women with medium to moderate
urine release presented higher scores in QoL assessment ques-tionnaires, and the less severe the urine release symptoms, the greater their sexual satisfaction. In addition, women with SUI, when compared to those with UUI, did not present significantly affected QoL, also in agreement with this study.
A study conducted in Turkey(9) showed similar results, except
for SUI, probably because the women were elderly, with a mean age of 77 years. In this sense, it is known that the alterations due to aging in the urethral support are more prominent and increase the susceptibility to this type of UI. Women without
SUI presented better QoL, as did women without UUI or MUI(9).
S/E Yes 20 44.17 30.24 0.00 25.00 33.33 58.33 100.00 0.2545
No 29 36.21 30.88 0.00 16.67 33.33 50.00 100.00
SM Yes 18 53.33 27.44 0.00 33.33 53.33 80.00 100.00 0.6483
No 26 49.49 24.01 0.00 33.33 46.67 66.67 100.00
Domain
Changes in sexual activity
due to UI
n Mean Standard deviation Min. Q1 Median Q3 Max. p value*
GHP Yes 13 32.69 18.78 0.00 25.00 25.00 50.00 50.00 0.6740
No 30 37.50 19.42 0.00 25.00 25.00 50.00 75.00
II Yes 13 82.05 22.01 33.33 66.67 100.00 100.00 100.00 0.0069
No 30 53.33 32.28 0.00 33.33 33.33 66.67 100.00
RL Yes 13 51.28 39.36 0.00 16.67 66.67 83.33 100.00 0.3595
No 29 37.93 34.76 0.00 16.67 33.33 50.00 100.00
PL Yes 13 69.23 34.59 0.00 50.00 83.33 100.00 100.00 0.0015
No 29 28.16 31.53 0.00 0.00 16.67 50.00 100.00
SL Yes 11 37.37 28.66 0.00 11.11 33.33 66.67 77.78 0.0235
No 24 17.59 24.72 0.00 0.00 0.00 27.78 77.78
PR Yes 10 63.33 31.23 16.67 33.33 58.33 100.00 100.00 0.0004
No 23 18.12 24.57 0.00 0.00 0.00 33.33 100.00
E Yes 13 72.65 20.60 33.33 55.56 66.67 88.89 100.00 <0.0001
No 28 26.19 23.27 0.00 11.11 22.22 33.33 100.00
S/E Yes 13 56.41 25.04 16.67 50.00 50.00 66.67 100.00 0.0084
No 29 33.33 28.87 0.00 16.67 33.33 33.33 100.00
SM Yes 13 71.28 23.16 20.00 60.00 73.33 86.67 100.00 0.0006
No 25 40.00 21.52 0.00 26.67 40.00 53.33 80.00
Note: GHP – General health perception; II – Incontinency impact; RL – Role limitations; PL – Physical limitations; SL – Social limitations; PR – Personal relation-ships; E – Emotions; S/E - Sleep/energy; SM – Severity measures; UI – Urinary incontinence. *p-value obtained through the Mann-Whitney test.
Lopes MHBM, Costa JN, Bicalho MB, Casale TE, Camisão AR, Fernandes MLV.
Coital incontinence can lead to disharmony between the couple and affect sexual activity, as a result of embarrassment, shame,
and low self-esteem, affecting the QoL(14-15). In fact, although
women with coital incontinence did not present impact on the QoL, when evaluated by the KHQ, the variable of “changes in sexual activity” affected six KHQ domains and the Severity measures. Although more than half of the women with an active sexual life considered it good or optimal, approximately 46% considered it ordinary or very bad, which was consistent with a study conducted in Brazil, in which difficulty reaching orgasm, lack of sexual desire, and dyspareunia were more common in UI
women(14). Likewise, another study with Brazilian women seen
in urogynecology clinics found that more than 64% of sexually active patients had sexual dysfunction. Most of them were
mar-ried (73%), non-hypertensive (73.8%), or diabetic (91.5%)(16)—a
similar profile to the one found in this study.
Among sexually active women analyzed by Karbage et al.(16),
48.3% reported coital incontinence: 68.3% with penetration; 27% with orgasm; and 4.7% in both situations. In addition, 58% reported that fear of urinary release sometimes, usually, or always interfered negatively in sexual intercourse. Women with coital incontinence had worse sexual function than those without. Coital incontinence was associated with low sexual desire and infrequent orgasm, and its prevalence was 45%. In this study, the prevalence of coital incontinence was similar: 38%.
Changes in sexual activity due to UI affected KHQ six do-mains and Severity measures, increasing their scores, which indicates worse QoL, as UI women feel embarrassed,
inse-cure, and frustrated(16). Although urine release during sexual
intercourse did not affect the KHQ domains, unlike in another
study(17), changes in sexual activity are an aspect that should be
investigated during care provision to UI patients. In addition, wellbeing is lower in women who report UI and decreases as
UI severity increases, leading to reduced HRQoL(18). The impact
of UI on sexual activity may be associated not only with the urine release itself, but also with psychological insecurity and self-image worsening due to embarrassment, which may be
more frequent in patients with severe UI(19).
This study confirms the positive correlation of ICIQ-SF with almost all KHQ domains, except for Personal relationships and General health perception. A study conducted by Tamanini et
al.(7) that validated the ICIQ-SF construct using the KHQ also
observed a moderate association between the results obtained with the two instruments, perhaps due to differences between them. The KHQ evaluates “bladder disorders”; that is, it includes other lower urinary tract symptoms in addition to UI and has
scales of different scoring systems with more items(7).
The findings obtained in this study are consistent with the results of other studies, although they were conducted using different questionnaires, and show a negative impact of UI on several dimensions of the lives of these women. A cross-sectional
study(20) observed a strong negative association in the
dimen-sions of QoL related to energy, social isolation, and physical mobility. The fact that it affects energy suggests that UI is a chronic disease, which affects daily life in different moments, and could explain the perception of fatigue that contributes to
the fact that UI patients do not seek care(20).
Social isolation may be associated with UI due to problems such as odor, frequent change of protection, and consequent refusal to visit public places, which probably limits contact with other people. Physical activity may be affected due to frequent bathroom visits and risk of urine release during the practice. The KHQ dimension of Personal relationships may be related to aspects of family and
sexual life(21). The impact of UI on social life reduces the number
of times these patients visit public places, travel, sleep in places other than their own homes, and visit friends due to the urine odor and the possibility of not having proper place for urination and
personal hygiene(10,14). In a previous study(14), QoL measured by
KHQ showed higher scores in domains of Incontinence impact (57.14) and Severity Measures (45.71), and similar results were found when comparing different types of UI and KHQ domains.
The sociodemographic variables were analyzed only in relation to the KHQ domains, because it is the most comprehensive and
specific HRQoL for urinary disorders(21). Weak correlations were
observed between some domains and the variables of age and weight. Negative correlations between age and the domains of Social limitations and Sleep/energy may indicate that UI affects young people more frequently, because they are more socially active and UI is culturally considered an inherent phenomenon
of aging(3), but it is an assumption that still needs to be confirmed.
Although this study did not present the results related to the provision of care in the PFRP - as it was not an objective of this study - analysis of collected data shows such data are relevant
to care planning and evaluation. Indeed, Nystrom et al.(22)
showed that validated instruments are able to measure clinically relevant UI improvements when the evaluation is performed at the beginning and the end of the treatment.
Study limitations
Although the results of this study show associations, they need to be investigated in longitudinal studies. Multiple analyses and small sample size did not allow the exclusion of women with more than one type of UI for separate analyses according to the type of UI. In addition, validated questionnaires for sexual activity assessment were not used.
Contributions to nursing, health care, and public policy areas
The profile of women participating in the PFRP is similar to that of other studies and the results are consistent with those of
other research, allowing them to be partially generalized(9,12-16,20).
The QoL evaluation of women with UI using validated ques-tionnaires is important for nursing care planning and evaluation, because it measures clinically relevant improvements in patients with UI. As the two questionnaires have correlations, the health center may use whichever is the most suitable to its service. Proper treatment, in turn, can reduce the negative impact of UI on the HRQoL of these women, optimize healthcare resources, and promote public policies to minimize such a prevalent condition.
CONCLUSION
daily and diurnal. Also, most of them do not have the chronic diseases that are prevalent in the general population, although almost half of them report SAH. Only 50.5% have an active sex life and most of them have sexual complaints. Changes in sexual activity is the variable that affected the highest number of QoL domains evaluated through the KHQ.
A correlation was observed between virtually all KHQ do-mains and ICIQ-SF scores, except for the domain of Personal relationships, confirming the findings of previous studies. Con-sidering the above, HRQoL questionnaires are recommended when evaluating this issue, at the beginning and at the end of the treatment, to measure the results.
REFERENCES
1. Minassian VA, Sun H, Yan XS, Clarke DN, Stewart WF. The interaction of stress and urgency urinary incontinence and its effect on quality of life. Int Urogynecol J[Internet]. 2015[cited 2017 Sep 16];26(2):269-76. Available from: https://link.springer.com/arti cle/10.1007%2Fs00192-014-2505-8
2. Kwon BE, Kim GY, Son YJ, Roh YS, You MA. Quality of life of women with urinary incontinence: a systematic literature review. Int Neurourol J[Internet]. 2010[cited 2017 Dec 14];14(3):133-8. Available from: https://www.ncbi.nlm.nih.gov/pmc/articles/PMC2998399/
3. Sensoy N, Dogan H, Ozek B, Karaaslan L. Urinary incontinence in women: prevalence rates, risk factors and impact on quality of life. Pak J Med Sci[Internet]. 2013[cited 2017 Dec 14];29(3):818-22. Available from: https://www.ncbi.nlm.nih.gov/pmc/articles/ PMC3809317/pdf/pjms-29-818.pdf
4. Hewison A, McCaughan D, Watt I. Assessing quality of life with incontinence. Nurs Times[Internet]. 2015[cited 2017 Dec 14];111(20):21-3. Available from: https://www.ncbi.nlm.nih.gov/pubmed/26548261
5. Tamanini JT, D’Ancona CA, Botega NJ, Rodrigues Netto Jr NJ. Validação do “King’s Health Questionnaire” para o português em mulheres com incontinência urinária. Rev Saúde Publica[Internet]. 2003 [cited 2017 Sep 16];37(2):203-11. Available from: http:// www.scielo.br/pdf/rsp/v37n2/15287.pdf
6. Lopes MHBM, Costa JN, Lima JLDA, Oliveira LDR, Caetano AS. Pelvic floor rehabilitation program: report of 10 years of experience. Rev Bras Enferm[Internet]. 2017[cited 2017 Sep 16];70(1):219-23. Available from: http://www.scielo.br/pdf/reben/v70n1/en_0034-7167-reben-70-01-0231.pdf
7. Tamanini JTN, Dambros M, D’Ancona CAL, Palma PCR, Rodrigues Netto N. Validation of the “International Consultation on Incontinence Questionnaire - Short Form” (ICIQ-SF) for Portuguese. Rev Saúde Pública[Internet]. 2004[cited 2017 Sep 16];38(3):438-44. Available from: http://www.scielo.br/pdf/rsp/v38n3/en_20662.pdf
8. Haylen BT, Ridder D, Freeman RM, Swift SE, Berghmans B, Lee J, et al. An International Urogynecological Association (IUGA)/ International Continence Society (ICS) joint report on the terminology for female pelvic floor dysfunction. Neurourol Urodyn[Internet]. 2010[cited 2017 Sep 16];29:4-20. Available from: http://onlinelibrary.wiley.com/doi/10.1002/nau.20798/epdf
9. Goral Turkcu S, Kukulu K. Urinary incontinence and quality of life of women living in nursing homes in the Mediterranean region of Turkey. Psychogeriatr[Internet]. 2017[cited 2017 Sep 16];1-7. Available from: http://onlinelibrary.wiley.com/doi/10.1111/ psyg.12271/epdf
10. Faria K, Pedrosa LAK. Avaliação da qualidade de vida e função sexual de mulheres com e sem incontinência urinária. Rev Eletr Enf [Internet]. 2012[cited 2017 Sep 16];4(2):366-73. Available from: https://www.revistas.ufg.br/fen/article/view/12486
11. Pakgohar M, Hamid TA, Ibrahim R, Vahid-Dastjerdi M. Portrait representation of postmenopausal women’s experiences of living with urinary incontinence. J Women Aging[Internet]. 2015[cited 2017 Sep 16];27:81–95.Available from: http://www.tandfonline. com/doi/full/10.1080/08952841.2014.928145?scroll=top&needAccess=true
12. Abdelwahab HA, Soltan EM, Metawee MA, Sherief MH, Metwally AH. Nocturnal Enuresis in women and its relation to urinary incontinence. Arab J Urol[Internet]. 2015[cited 2017 Sep 16];13(3):199-202. Available from: http://www.sciencedirect.com/science/ article/pii/S2090598X15000418?via%3Dihub
13. Villoro R, Merino M, Hidalgo-Vega A, Jimenez M, Martinez L, Aracil J. Women with urinary incontinence in Spain: health-related quality of life and the use of healthcare resources. Maturitas[Internet]. 2016 [cited 2017 Sep 16];94:52-7.Available from: http:// www.maturitas.org/article/S0378-5122(16)30194-3/fulltext
14. Senra C, Pereira MG. Quality of life in women with urinary incontinence. Rev Assoc Med Bras[Internet]. 2015 [cited 2017 Sep 16];61(2):178-83. Available from: http://www.scielo.br/pdf/ramb/v61n2/0104-4230-ramb-61-02-0178.pdf
15. Caruso S, Brescia R, Matarazzo MG, Giunta G, Rapisarda AMC, Cianci A. Effects of urinary incontinence subtypes on women’s sexual function and quality of life. Urology[Internet]. 2017 [cited 2017 Sep 16];pii. Available from: http://www.goldjournal.net/ article/S0090-4295(17)30646-5/pdf
16. Karbage SAL, Santos ZMSA, Frota MA, Moura HJ, Vasconcelos CTM, Vasconcelos Neto JA, et al. Quality of life of Brazilian women with urinary incontinence and the impact of their sexual function. Eur J Obstet Gynecol Reprod Biol[Internet]. 2016[cited 2017 Sep 16];201:56-60. Available from http://www.ejog.org/article/S0301-2115(16)30115-4/pdf
Lopes MHBM, Costa JN, Bicalho MB, Casale TE, Camisão AR, Fernandes MLV.
and outcomes in women attending a urogynaecology clinic. Int Urogynecol J[Internet]. 2017[cited 2017 Sep 16];[ahead of print]. Available from: https://link.springer.com/article/10.1007%2Fs00192-017-3380-x
18. Smith AP. Female urinary incontinence and wellbeing: results from a multi-national survey. BMC Urol[Internet]. 2016[cited 2017 Sep 16];16(1):22. Available from: https://bmcurol.biomedcentral.com/articles/10.1186/s12894-016-0140-z
19. Felippe MR, Zambon JP, Girotti ME, Burti JS, Hacad CR, Cadamuro L, et al. What is the real impact of urinary incontinence on female sexual dysfunction? a case control study. Sex Med[Internet]. 2017[cited 2017 Sep 16];5(1):e54-e60. Available from: http:// www.smoa.jsexmed.org/article/S2050-1161(16)30070-8/pdf
20. Bedretdlnova D, Fritel X, Zins M, Ringa V. The effect of urinary incontinence on health-related Quality of Life: is it similar in men and women? Urology[Internet]. 2016[cited 2017 Sep 16];91:83-9. Available from: http://www.goldjournal.net/article/ S0090-4295(15)01186-3/pdf
21. Fitz FF, Costa TF, Yamamoto DM, Resende APM, Stupp L, Sartori MGF, et al. Impacto do treinamento dos músculos do assoalho pélvico na qualidade de vida em mulheres com incontinência urinária. Rev Assoc Med Bras[Internet]. 2012[cited 2017 Sep 27];58(2):155-9. Available from: http://www.scielo.br/pdf/ramb/v58n2/v58n2a10.pdf