Accounting choices in Brazil: identifying the characteristics of publicly
traded companies that opted to maintain versus derecognise deferred
assets
Fernando Drago Lorencini - Brazil
M.Sc. in Accountancy from FUCAPE Business School, Brazil Faculty, MBA Program, FUCAPE Business School, Brazil E-mail:[email protected]
Fábio Moraes da Costa - Brazil
Ph.D. in Controllership and Accountancy from University of São Paulo, Brazil Associate Professor at FUCAPE Business School, Brazil
E-mail: [email protected]
Received on 1.5. 2011 - Accepted on 1.12.2011 - 5th version on 3.9. 2012
ABSTRACT
The issuance of Brazilian Law 11.638/2007 is a critical step in the convergence of the Brazilian Generally Accepted Accounting Principles (GAAPs) towards International Financial Reporting Standards. After the law was implemented and later modified by Provisional Executive Order 449/2008 (converted into Law 11.941/2009), certain accounting choices were allowed during the transition period. The Brazilian GAAPs allowed for restructuring costs and costs related to opening a new facility to be recognised as assets. As a transitional provision, companies were allowed to choose between maintaining or eliminating these values. In this paper, we attempted to identify which company characteristics were associated with this accounting choice. The final sample consisted of Brazilian companies listed on the BM&FBOVESPA, and a logistic regression identified two characteristics. Participation in one of the three different corporate governance levels of the BM&FBOVESPA was associated with the choice to derecognise the deferred assets, while companies decided to maintain the deferred asset if it was relatively large. The empirical evidence reported here contributes to the literature by explaining the manner in which a set of firm characteristics is related to a firm’s accounting choices.
1 Note that the Central Bank of Brazil only adopted some of the technical decrees from the CPC.
2 This measure is referred to as Law 11.941/2009 throughout the text instead of as Provisional Measure 449/2008.
1 INTRODUCTION
The passage of Law 11.638/2007 marked the beginning of a transition process in Brazilian accounting procedures. The gradual change towards the international accounting model embodied by the International Financial Reporting Standards (IFRS) was carried out by the Committee of Ac-counting Standards (Comitê de Pronunciamentos Contá-beis - CPC) and ratified by regulatory organisations, such as the Securities and Exchange Commission (Comissão de Valores Mobiliários - CVM), the Federal Accounting Council (Conselho Federal de Contabilidade - CFC), the Superintendent of Private Securities (Superintendência de Seguros Privados - SUSEP), and the Central Bank of Brazil1(Banco Central do Brasil - Bacen).
The transition can be divided into two phases: the first phase was during 2008, when the initial changes were im-plemented with the introduction of Law 11.638/2007 and initial decrees from the CPC; the second phase refers to the adoption of the complete set of CPC decrees released through 2010.
This study focuses on the first phase, during which bu-sinesses had to apply specific rules during the transition period. The Brazilian legislation permitted two corpora-te accounting choices: maintaining or derecognising the balance of deferred assets and the balance of revaluation reserves. Thus, Brazil represents a natural experiment on these two choices.
As will be discussed later, the majority of companies that had a balance in revaluation reserves opted to maintain that balance. Thus, we use information on these balances as a control variable and focus on the choice of maintaining or derecognising deferred assets.
The original text of Law 11.638/2007 allowed pre-ope-rational costs and expenses to be cast in deferred assets with restructuring in case the company thought that they would benefit in the future. However, CPC 04 – Intangible Assets established that such costs should be treated as expenses.
The potential conflict between the text of the Law and the technical announcements from the CPC was resolved through the revision of Provisional Measure 449/2008 (MP 449/2008). This measure included Ar-ticle 299-A in Law 6.404/1976, establishing that the existing balances on 31/12/2008 would be classified as deferred assets and could not be allocated to another
group. These balances could remain assets under this classification until they were fully amortised. Later, Provisional Measure 449/2008 was converted into Law 11.941/20092.
After the publication of Law 11.941/2009, the CPC emitted Technical Decree CPC 13 – Initial Adoption of Law 11.638/07 and Provisional Measure 449/08. The ap-plication of this decree became obligatory for publicly tra-ded companies after the publication of Deliberation CVM 565/2008. This document established an option for costs recognised as deferred assets that could not be reclassified to other groups: these costs could be subtracted from the opening balance on the date of transition or maintained in this group until their complete amortisation.
Thus, the initial adoption of Law 11.941/2009 and the CPC’s Technical Decree 13 introduced new accounting choices for companies that were defined by Fields, Lys, and Vincent (2001) as decisions in which the principal objec-tive is to influence the result of the accounting system. In this context, this study investigates the following problem: What are the characteristics differentiating companies that decided to maintain versus derecognise the balance of de-ferred assets?
The literature on accounting choices was analysed, and the following potential explanatory variables were identi-fied: the company’s level of corporate governance accor-ding to BM&FBOVESPA, earnings-based rewards to admi-nistrators; the issuance of American Depositary Receipts (ADRs), audits performed by one of the four large auditing firms, revaluation reserves on the transition date, the level of indebtedness, and the relative size of the deferred assets.
The results obtained from the logistic regression model suggest that participating in different levels of corporate governance and the relative size of the balance of deferred assets are associated with the accounting choice regarding deferred assets. There is also evidence that auditing by the four large firms (“Big Four”) was associated with maintai-ning the balance of deferred assests, in contrast with ex-pectations. As will be discussed later, due to sample size, the BigFour variable potentially captures other firm cha-racteristics, as demonstrated in recent studies (Lawrence, Minutti-Meza, & Zhang, 2011). Thus, this finding should be interpreted with caution.
2 THEORETICAL FRAMEWORK
According to Paulo (2007), accounting information is influenced by alternative measurement and disclosure cri-teria, so the administrator can choose between the standar-ds and practices allowed by existing regulations. According to Fields et al. (2001), accounting choices made by mana-gers are influenced by the existence of agency costs,
infor-mation asymmetry, and externalities.
Fields et al. (2001) presented two contractual issues that may lead to agency conflict: executive compen-sation and bond covenants. The tie between execu-tive compensation and earnings and the existence of contractual clauses in debt collection processes create incentives for certain accounting choices to be made to meet a specific set of goals (Watts & Zimmerman, 1986). Such factors can be exacerbated by the fact that managers and suppliers of capital (shareholders and creditors) hold different sets of information, negatively impacting the return required to justify an investment in the firm (Bartov & Bodnar, 1996).
Externalities: The management of accounting in-formation can be defined as the use of discretionary actions by administrators to change the interpretation of the company’s economic and financial reality. Ac-cording to Stolowy and Breton (2004), this practice is motivated by the possibilities of transferring wealth be-tween the company and society (political costs), using wealth to acquire resources (capital costs), or transfer-ring wealth to the administrators themselves (compen-sation plans).
Each accounting choice is expected to be directed by a set of economic incentives (Fields, Lys, & Vincent, 2001). In Brazil, many studies were developed to focus on earnings management and its relationship with different levels of corporate governance, bonus programs for admi-nistrators, and taxes (see, for example, Paulo, 2007, and Perlingeiro, 2009). Compensation plans and tax levels are commonly cited incentives in the literature and are rela-ted to certain choices (Watts & Zimmerman, 1986).
In the next section, we describe the variables that were used in this article based on the literature on accounting choices.
2.1 Different levels of corporate governance
Various corporate governance mechanisms are esta-blished in a firm to minimise agency conflict by alig-ning interests (Shleifer & Vishny, 1997). Andrade and Rossetti (2007, p.138) argued that the processes esta-blished by a corporation’s senior management to meet their goals can be divided into four groups: processes that protect the rights of the parties, systems that di-rect and monitor the company’s activities, the power structure within the corporation, and the regulatory system governing the company’s internal and external relations.
The New Market, which was created in 2000, is an example of a voluntary mechanism of signalling an enhanced corporate governance structure. Santana (2008, p.11) stated that the goal of membership in the New Market is to meet the demands of investors. Fur-thermore, Corporate Governance levels 1 and 2 serve as thresholds allowing for the gradual adaptation of
already listed companies (for cases in which direct migration to the maximum level is not considered fe-asible).
In an empirical study of publicly traded Brazilian companies in the period between 2003 and 2004, Ra-mos and Martinez (2006) investigated whether “good” corporate governance practices minimise earnings management and found that firms in New Market le-vels 1 and 2 showed less variability in discretionary accruals compared to those that did not adhere to the programs.
In contrast, Silveira (2006) found no statistical evidence that companies listed at levels 1 and 2 of Bovespa’s corporate governance and that pay their ma-nagers through stock options have higher levels of ear-nings management than unlisted companies.
Thus, this article used different levels of corporate governance as variables that could explain the accoun-ting choice analysed here. The expectation is that this group of companies has a greater incentive to ensure that their financial statements are comparable with those of international companies and thus that these companies would opt to derecognise their deferred assets to reduce accounting differences.
2.2 Administrative participation in profits
As discussed previously, authors such as Watts and Zimmerman (1986) claim that administrators compen-sated based on earnings have a greater incentive to in-crease earnings by, for example, manipulating the rules used to calculate earnings or choosing rules that favour increased earnings reports. This assertion is supported by evidence from Healy (1985) and DeGeorge, Patel, and Zeckhauser (1999).
The choice of whether to maintain or derecognise the balance could alter the compensation of adminis-trators. Derecognising the balance of deferred assets against accumulated profits would reduce expenses by amortisation in subsequent periods, giving adminis-trators an incentive to choose this option. Thus, it is expected that administrators will have an incentive to derecognise the balance of deferred charges to avoid the recognition of these expenses.
2.3 Issuance of ADRs
Lopes and Tukamoto (2007) studied earnings ma-nagement by comparing publicly traded Brazilian com-panies that issued ADRs with those that did not. Their results did not show statistically significant differences in the level of “management” of financial results ba-sed on the issuance of ADRs. The degree of conditional conservatism was also not affected by the issuance of ADRs (Santos & Costa, 2008).
sub-3 Assuming that the ADR issuers are in levels II and III.
mission to the regulatory structures demanded by the Securities and Exchange Commission (SEC) required to issue ADRs can increase the company’s visibility. Con-sidering that these companies follow both the Brazilian and the North American accounting models3, re is an incentive to make these results highly comparable. Be-cause the United States Generally Accepted Accounting Principles (US-GAAPs) do not allow for the recognition of deferred assets, companies issuing ADRs would have an incentive to lower the balance of this group of assets.
2.4 Auditing
Almeida and Almeida (2007) presented evidence of a difference in the level of discretionary accruals between publicly traded companies audited by the Big Four (De-loitte Touche Tohmatsu, Ernst & Young, KPMG, and Pri-cewaterhouseCoopers) and other auditing firms. The re-sults suggest that the Big Four are associated with a lower degree of earnings management.
Azevedo and Costa (2008) observed the effect of changing the auditing firm on earnings management in publicly traded Brazilian companies and found that a change in auditing firm does not necessarily reduce the level of earnings management in Brazilian companies. As accounting scandals that occurred in the internatio-nal market led to a growing appreciation of corporate governance practices, Martinez (2010) investigated the correlations between the characteristics of a firm’s exe-cutive board and auditing firm and the propensity to manage earnings in Brazil. These results showed that national auditing firms were more permissive regarding management practices compared to international firms.
Recently, Lawrence, Minutti-Meza, and Zhang (2011) studied whether the auditing firm influences accounting choices and the quality of disclosed information or whe-ther the effect of the auditing firm arises from owhe-ther fac-tors. Using a matching procedure, the authors presented evidence that the firm’s characteristics are more relevant than those of the auditing firm. Higher quality could result from a better governance structure. Beasley and Petroni (2001) pointed to the relationship between the characteristics of corporate governance, especially the Board of Directors, and the contracting of auditing firms and found that companies with more independent Boar-ds tend to employ higher quality firms (Lin & Liu, 2009). As a result, firms with stronger governance structures present more accurate information (Lopes & Walker, 2012). The current study also uses corporate governan-ce structure as a variable with the expectation that this effect is minimal.
Auditors have an incentive to behave conservatively (Watts, 2003; Feldman & Read, 2010), and derecognising the balance would make the values similar to those of the international model. Thus, it is expected that companies audited by the Big Four will opt to derecognise the balance of the deferred assets.
2.5 Relative size of the deferred balance
Companies with significant balances of deferred assets could have different economic incentives than those with smaller (or insignificant) balances. The me-thodology for retroactive adjustment can lead the com-pany to derecognise the amount directly into equity, depending on the magnitude of its impact (Cormier, Demaria, Lapointe-Antunes, & Teller, 2009). Compa-nies with significant balances of deferred assets are ex-pected to opt to maintain these balances. However, it is important to control for the size of the company in this analysis because the impact of reducing earnings or future amortisation should be evaluated in light of the company’s size.
2.6 Revaluation of fixed assets
Another relevant change introduced by Law 11.638/2007 was the elimination of the spontaneous revaluation of goo-ds. The accounting treatment given to the revaluation re-serve balance according to Technical Decree CPC 13 is si-milar to that given to the balance of deferred assets.
The study conducted by Schvirck and Giasson (2008) sought to distinguish between the economic profiles of companies that revaluate assets and those that do not. The authors concluded that companies that do not revaluate their fixed assets have better economic-financial indica-tors than those that do revaluate their fixed assets. Lopes and Walker (2012) demonstrated that the option to reva-luate assets in Brazil is linked to the economic incentives of management rather than the attempt to demonstrate the economic value of assets.
Because the option to maintain or derecognise the re-valuation reserve may be associated with similar incenti-ves to the accounting choice for deferred assets, this choi-ce was included as a control variable for companies that had revaluation reserves on 31/12/2007.
2.7 Indebtedness
The ratio between the use of debt capital and the use of equity in the financial structure is determined by se-veral internal and external factors. Silva (2008) analy-sed the determinants and economic consequences of accounting choices from the perspective of contractual covenants. The results revealed no evidence of changes in opportunistic voluntary practices to avoid violating accounting covenants and showed that administrators take real actions to impact the company’s cash flow.
Table 1 Identiicacion of companies with balances of
deferred assets subject to choice
Parent Company Consolidated
Compannies with deferred
assets on 31/12/2007 151 189
(-) reclassiication of a deferred
assets balanced to other groups (55) (45)
(=) Companies with a deferred
assets balance subject to choice 96 144
3 METHODOLOGY
The variable studied in this paper is dichotomous because the companies could choose to maintain or de-recognise the balance of deferred assets. In this case, it is considered appropriate to implement a logistic re-gression. The sample used in this study, which is des-cribed in Table 1, consists of 96 observations of parent company’s financial statements and 144 consolidated statements. Given the sample size, a stepwise procedu-re was used to mitigate the potential spurious effects of variables unrelated to this choice.
The independent variables used in this study were selected based on the literature and are as follows: the company’s level of corporate governance according to BM&FBOVESPA, whether the company’s administrators share in earnings, whether the company issues ADRs in the New York Stock Exchange, whether the company is audited by a Big Four auditing firm, the relative size of the deferred assets, the presence of a revaluation reserve of fixed assets, and the level of debt.
This study seeks to determine the relationship betwe-en a firm’s characteristics and its choice regarding de-ferred assets. There may be endogeneity between some variables, such as the choice of an auditing firm and the probability of making a specific accounting choice. Thus, these results should be interpreted primarily based on the relationships between the variables rather than as in-dicators of causality.
3.1 Instruments of data collection
Brazil is different from many countries in its re-quirement of the publication of individual financial statements (parent company) and consolidated sta-tements. The empirical evidence in the literature on accounting choices is generally based on consolida-ted data (Fields et al., 2001; Beatty & Weber, 2003; Cormier et al., 2009), and the literature considers the subsidiary company’s choices to be defined by those of the parent company.
To contribute to this debate, in this study, the parent company’s choice was taken into account based on indi-vidual statements to enable the company’s decision to be identified without interference from other effects, such as the performance of controlling stockholders in subsidia-ries. Using a sensitivity analysis and according to the inter-national literature, the analysis was also performed using consolidated financial statements. For example, some pa-rent companies act as holding companies, with a significant part of earnings and assets only represented in the conso-lidated form.
The information was primarily collected throu-gh the Economática database, with the main filter set as non-financial companies listed on BM&FBovespa that had a balance of deferred assets on 31/12/2007. After identifying these companies, their accounting
statements were obtained through the Securities and Exchange Commission’s website (Standard Financial Statements/Demonstrações Financeiras Padronizadas - DFP). Some companies, such as Magnetisa, Datasul, and Eleva, were excluded because they had cancelled their registration during 2008 and thus did not submit financial statements during the period in which the choice was made.
The explanatory notes of each company were analy-sed to identify the choice of whether to maintain or de-recognise the balance of deferred assets. Analysing the notes is justified because if a company had a “zero” ba-lance at the end of 2008, its choice to have a low baba-lance of deferred assets or simply a reduction would be ex-plained by a transfer to other groups, such as intangible assets, according to CPC 13. The companies that simply transferred the balance were excluded from the analysis because they did not make a decision; instead, they were constrained by another accounting decree.
The explanatory notes of 151 companies (189 con-solidated) that had balances in deferred assets for the year 2007 were analysed. Only 55 of these companies (45 consolidated) reclassified their balances to other groups. After this exclusion, the final sample consisted of 96 companies (144 consolidated) with a balance of deferred assets subject to choice, as shown in Table 1 below.
The companies were divided in two groups:
- Group 1: 54 companies (91 consolidated) that op-ted to maintain the balances in December 2008 after the reclassifications were made mandatory and
- Group 2: 42 companies (53 consolidated) that op-ted to derecognise the balance of deferred assets in De-cember 2008.
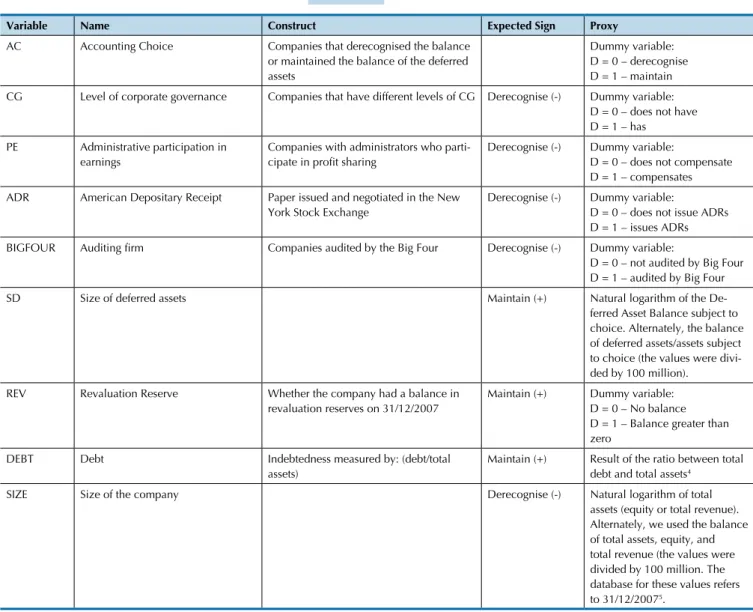
Table 2 Variables
Variable Name Construct Expected Sign Proxy
AC Accounting Choice Companies that derecognised the balance
or maintained the balance of the deferred assets
Dummy variable: D = 0 – derecognise D = 1 – maintain
CG Level of corporate governance Companies that have different levels of CG Derecognise (-) Dummy variable: D = 0 – does not have D = 1 – has
PE Administrative participation in earnings
Companies with administrators who parti
-cipate in proit sharing Derecognise (-) Dummy variable: D = 0 – does not compensate D = 1 – compensates
ADR American Depositary Receipt Paper issued and negotiated in the New
York Stock Exchange
Derecognise (-) Dummy variable: D = 0 – does not issue ADRs D = 1 – issues ADRs
BIGFOUR Auditing irm Companies audited by the Big Four Derecognise (-) Dummy variable:
D = 0 – not audited by Big Four D = 1 – audited by Big Four
SD Size of deferred assets Maintain (+) Natural logarithm of the
De-ferred Asset Balance subject to choice. Alternately, the balance of deferred assets/assets subject
to choice (the values were divi -ded by 100 million).
REV Revaluation Reserve Whether the company had a balance in
revaluation reserves on 31/12/2007
Maintain (+) Dummy variable: D = 0 – No balance D = 1 – Balance greater than zero
DEBT Debt Indebtedness measured by: (debt/total
assets)
Maintain (+) Result of the ratio between total debt and total assets4
SIZE Size of the company Derecognise (-) Natural logarithm of total
assets (equity or total revenue).
Alternately, we used the balance
of total assets, equity, and
total revenue (the values were
divided by 100 million. The database for these values refers to 31/12/20075.
4 The use of total assets instead of equity is justiied by the reduced number of observations because some companies have negative equity. The results were also calculated with this speciication, and the conclusions were similar in terms of statistical signiicance and coeficient signs.
5 Selecting the 2007 database is justiied to avoid endogeneity problems, given that the 2008 values were already impacted by the accounting choice made regarding deferred assets.
the third quarter of 2008 was used as a proxy becau-se the amount does not appear on the 2008 financial statements (“zero” balance). Note that some companies continued to recognise pre-operating expenses and res-tructuring during 2008 because Provisional Measure 449/2008 was only published in December 2008.
Information on companies that issued ADRs were collected through the New York Stock Exchange’s web-site. This procedure was adopted in case there were no companies that emitted an ADR after the 2008 balance, as such a situation would skew the analysis.
The variables related to the type of auditing com-pany (Big Four or not), different levels of corporate governance, and compensation of administrators based on profits were obtained through the Annual Informa-tion (Informações Anuais - IAN) available on the Secu-rities Commission’s website.
3.2 Model
In this study, the dependent variable is the binary variable capturing the choice between two valid accounting choices.
The dummy variable for Accounting Choice (AC) was defined as 0 if the AC was to derecognise the balance of the deferred assets and 1 if the AC was to maintain the deferred balance until the end of its amortisation period. Note that the variable AC was calculated for both indivi-dual and consolidated financial statements because some parent companies do not have balances, unlike their sub-sidiaries. The results will be presented for the parent com-pany, and later, data based on consolidated statements will be shown to determine the sensitivity of the results and enable comparisons.
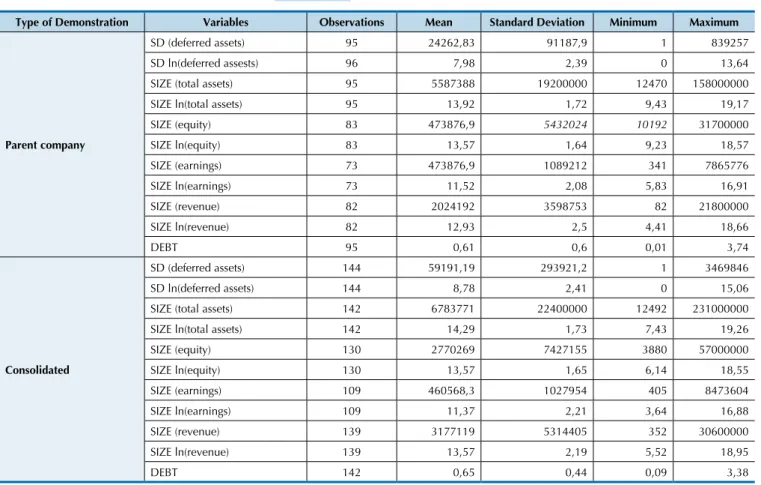
Table 3 Descriptive Statistics
Type of Demonstration Variables Observations Mean Standard Deviation Minimum Maximum
Parent company
SD (deferred assets) 95 24262,83 91187,9 1 839257
SD ln(deferred assests) 96 7,98 2,39 0 13,64
SIZE (total assets) 95 5587388 19200000 12470 158000000
SIZE ln(total assets) 95 13,92 1,72 9,43 19,17
SIZE (equity) 83 473876,9 5432024 10192 31700000
SIZE ln(equity) 83 13,57 1,64 9,23 18,57
SIZE (earnings) 73 473876,9 1089212 341 7865776
SIZE ln(earnings) 73 11,52 2,08 5,83 16,91
SIZE (revenue) 82 2024192 3598753 82 21800000
SIZE ln(revenue) 82 12,93 2,5 4,41 18,66
DEBT 95 0,61 0,6 0,01 3,74
Consolidated
SD (deferred assets) 144 59191,19 293921,2 1 3469846
SD ln(deferred assets) 144 8,78 2,41 0 15,06
SIZE (total assets) 142 6783771 22400000 12492 231000000
SIZE ln(total assets) 142 14,29 1,73 7,43 19,26
SIZE (equity) 130 2770269 7427155 3880 57000000
SIZE ln(equity) 130 13,57 1,65 6,14 18,55
SIZE (earnings) 109 460568,3 1027954 405 8473604
SIZE ln(earnings) 109 11,37 2,21 3,64 16,88
SIZE (revenue) 139 3177119 5314405 352 30600000
SIZE ln(revenue) 139 13,57 2,19 5,52 18,95
DEBT 142 0,65 0,44 0,09 3,38
SD = size of deferred assets; SD (deferred assets) = balance of deferred assets subject to choice; SD ln(deferred assets) = natural logarithm of the balance of deferred assets subject to choice; SIZEi = size of the company; SIZEi (total assets) = balance of total assets; SIZEi ln(total assets) = natural logarithm of total assets; SIZEi (equity) = balance of equity; SIZEi ln(equity) = natural logarithm of equity; SIZEi (earnings) = balance of earnings; SIZEi ln(earnings) = natural lo-garithm of earnings; SIZEi (revenue) = amount of total revenue; SIZEi ln(revenue) = natural lolo-garithm of revenue; and ENDIV = value of indebtedness (debt/ total assets).
6 The results were also calculated without a control for outliers, and the results are qualitatively similar, with the same statistical signiicance and coeficient signs.
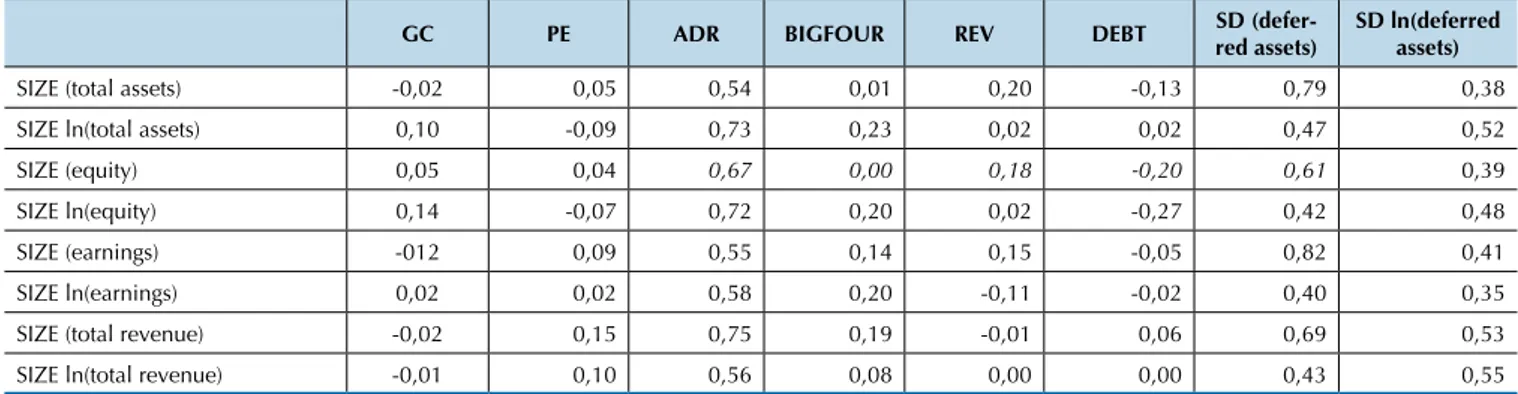
Table 4 Matrix of Correlations
GC PE ADR BIGFOUR REV DEBT SD
(defer-red assets)
SD ln(deferred assets)
CG 1,00
PE 0,09 1,00
ADR 0,21 0,06 1,00
BIGFOUR 0,28 0,07 0,12 1,00
REV -0,10 0,06 0,01 -0,23 1,00
DEBT -0,18 -0,05 -0,05 0,06 0,01 1,00
SD (deferred assets) -0,09 0,11 0,33 0,15 0,06 0,06 1,00
SD ln(deferred assets) 0,06 0,14 0,44 0,07 -0,08 0,06 0,50 1,00
continues
4 DATA ANALYSIS
4.1 Descriptive statistics and frequency analysis
To reduce the effect of outliers, the Windsor technique was applied to the following variables: size of deferred as-sets (SD), size of the company (SIZE), and debt (DEBT).
Thus, 2% of the total sample was treated (1% from each tail of the distribution)6. Alternately, the natural logarithm was used for the SD and SIZE variables. The descriptive statis-tics are shown in Table 3 below.
he test group consisted of 96 companies (144 con-solidated) that had a balance of deferred assets subject to choice according to the provisions of Law 11.941/2009. Of these companies, 54 (91 consolidated) opted to maintain their balances and 42 (53 consolidated) wrote of the
GC PE ADR BIGFOUR REV DEBT SD (defer-red assets)
SD ln(deferred assets)
SIZE (total assets) -0,02 0,05 0,54 0,01 0,20 -0,13 0,79 0,38
SIZE ln(total assets) 0,10 -0,09 0,73 0,23 0,02 0,02 0,47 0,52
SIZE (equity) 0,05 0,04 0,67 0,00 0,18 -0,20 0,61 0,39
SIZE ln(equity) 0,14 -0,07 0,72 0,20 0,02 -0,27 0,42 0,48
SIZE (earnings) -012 0,09 0,55 0,14 0,15 -0,05 0,82 0,41
SIZE ln(earnings) 0,02 0,02 0,58 0,20 -0,11 -0,02 0,40 0,35
SIZE (total revenue) -0,02 0,15 0,75 0,19 -0,01 0,06 0,69 0,53
SIZE ln(total revenue) -0,01 0,10 0,56 0,08 0,00 0,00 0,43 0,55
Table 4 continued
Table 5 Estimation of logit model for the parent company (equation 1)
ACi = β0 + β1CGi+ β2PEi + β3ADRi+ β4BIGFOURi+ β5SDi + β6REVi+ β7DEBTi + β8SIZEi+ε
AC 1 2 3 4 5 6 7 8
CG -1,23** -1,47** -0,99* -1,22** -1,63*** -1,70*** -1,27** -1,50**
BIGFOUR 1,79*** 1,43** 1,67*** 1,59** 1,81** 1,47** 1,15* 1,18*
SD
SD ln(deferred assets) 0,27** 0,22* 0,30** 0,24*
SD (deferred assets) 3,28** 2,82* 2,58* 4,22**
SIZE
SIZE ln(total assets) -0,46**
SIZE (total assets) -0,02**
SIZE ln(equity) -0,30*
SIZE (equity) -0,03**
SIZE ln(earnings) -0,30**
SIZE (earnings) -0,11*
SIZE ln(total revenue) -0,41**
SIZE (total revenue) -0,04**
Number of observations 92 92 81 81 79 71 71 79
Prob>Chi2 0,001 0,001 0,007 0,001 0,001 0,004 0,017 0,005
Pseudo R2 0,15 0,15 0,13 0,16 0,18 0,15 0,11 0,14
Table 4 indicates that the correlations are typically smaller than 0.20, with two exceptions. he companies that issue ADRs are typically large, and thus, the correlations between this variable and the proxies for size are larger (0.54 to 0.78). he size of deferred assets and the size of the company are also correlated (0.35 to 0.82), as larger compa-nies generally have higher balances of pre-operating costs and restructuring expenses. It is expected that controlling for size (SIZE) in the regressions will allow for the incre-mental contribution of the variables size (SD) and ADR to be evaluated.
4.2 Results of the logit regression
Equation 1 presents the (stepwise) logistic regression model (stepwise) used in this study with the variables des-cribed in Table 2.
Equation (1) – Model
ACi = β0 + β1CGi+ β2PEi + β3ADRi+ β4BIGFOURi+ β5SDi
+ β6REVi+ β7DEBTi + β8SIZEi+ε 1
Note that eight speciications were used because of the diferent measures of the size of the deferred asset balance (SD) and the company (SIZE). Each speciication uses one form of measurement for deferred assets (natural logari-thm of the deferred asset balance or the balance of deferred assets divided by 100 million) and the size of the company (natural logarithm or the balance of total assets, equity, ear-nings, or total revenue divided by 100 million.
ACi = dummy variable that is equal to 1 when firm i opts to maintain the balance of deferred assets and 0 if it opts to derecognise the balance; CGi = dummy variable that is equal to 1 when firm i participates in different levels of corporate governance of BM&FBovespa and 0 when it does not participate; ADRi = dummy variable that is equal to 1 when firm i has a program for ADRs and 0 when it does not; PEi = dummy variable equal to 1 when firm i has a program for administrative participation in earnings and 0 when it does not; BIGFOURi = dummy variable equal to 1 when firm i is audited by a Big Four firm and 0 if not; SDi = size of deferred assets for firm i; SD ln(deferred assets)i = natural logarithm of the balance of the deferred assets of firm i; SD (deferred assets) i = balance of the deferred assets of firm i divided by 100 million; REVi = dummy variable that is equal to 1 when firm i had a balance in the 2007 revaluation reserve account; DEBTi = value of indebtedness (debt/equity) for firm i; SIZEi =size of company i; SIZEi ln(total assets) = natural logarithm of the total assets of company i; SIZEi (total assets) = balance of the total assets of firm i divided by 100 million; SIZEi ln(equity) = natural logarithm of the equity of company i; SIZEi (equity) = balance of the equity of firm i divided by 100 million; SIZEi ln(earnings) = natural logarithm of the earnings of company i; SIZEi (earnings) = balance of the earnings of firm i di-vided by 100 million; SIZEi ln(revenue) = natural logarithm of the earnings of company i; SIZEi (revenue) = balance of the revenue of firm i divided by 100 million.
*, **, and *** indicate statistical signiicance at the levels of 10%, 5%, and 1%, respectively.
7 According to IAS 16 – Property, Plant and Equipment and IAS 38 – Intangible Assets.
8 The auditing companies are from different sectors and there is not more than one Big Four irm with more than two clients in each sector. The auditing irms and the respective sectors (number of clients) are (a) KPMG – Energy (5), Food and drinks (4), Textiles (3), Steel (2), and Vehicles (2); (b) PriceWaterhouseCoopers – Chemicals (3); (c) Deloitte – Pulp and Paper (3), Trade (2); and Ernst & Young – Transportation (2).
As shown in Table 5, the variables CG, BigFour, SD, and SIZE have statistically significant impacts on the ac-counting choice depending on the specification of the model. Some variables are only significant at 10%, but it is important to note that there were fewer than 100 observations.
As expected, companies with officially recognised le-vels of corporate governance opted to derecognise the balance of deferred assets. One possible explanation for this finding is that the desire to voluntarily signal a strong corporate governance structure may be linked to an attempt to approach the international accounting model7. These results fit with those of other studies that show a difference in the behaviour of managers and their accounting choices when companies intend to signal “good” governance practices (Ramos & Martinez, 2006; Lopes & Walker, 2012).
The size of the deferred asset balance (SD) was also related to the decision to maintain the balance. When controlling for the size of the company (SIZE), a larger balance size corresponded with a greater probability that the company chose to maintain that balance. This fact confirms the expectation that the managers evalu-ated the impact of the ownership structure and/or the earnings of the company, supporting the evaluation of this trade-off presented by Cormier, Demaria, Lapoin-te-Antunes, and Teller (2009).
The ADR variable did not have a significant impact in the sample studied here. Thus, there is no eviden-ce that the behaviours of the companies in this sample group were influenced by their dual listing. It is not pos-sible to say that the choice results from an attempt to make the Brazilian accounting model similar to the U.S. model (US-GAAPs). Note that the lack of statistical sig-nificance in the ADR results could be because only 15 firms in the sample issued ADRs, as shown in Table 4 (23 consolidated).
Administrative participation in earnings did not have a significant impact on the accounting choice, in-dicating that the managers may not consider the amor-tisation expense to be significant. Another explanation for this result is that the choice to maintain or
derecog-nise the deferred asset balance may not impact stock prices, which would fit with the conclusion of Rezende (2005) that deferred assets are not relevant for the Bra-zilian market.
he REV variable also did not have a statistically signii-cant impact. hus, it was not possible to determine conclu-sively whether a balance in the revaluation reserve inluen-ced the decision to maintain or derecognise the balance of deferred assets. he evidence may show that incentives to maintain the revaluation balance, such as covenants, can be diferent from incentives to maintain or derecognise the deferred assets.
The behaviour of companies audited by the Big Four firms was expected to be different from that of com-panies audited by other firms. However, as shown in Table 1, the expectation was that firms audited by a Big Four firm would decide to derecognise the balance be-cause of their attempt to approximate the international model.
he obtained association between Big Four auditing irms and maintaining the balance was not expected ba-sed on the literature review. he coeicient should be in-terpreted with caution because the Big Four variable can indirectly capture other irm characteristics (Lawrence et al., 2011). Because the total sample size was 96 observa-tions (144 consolidated), it was not possible to control for factors such as economic sector8.
Thus, to more thoroughly evaluate whether the re-sults reflect the influence of the size of the auditing firm on accounting choices, the eight original specifi-cations were changed to exclude the variable Big Four and include dummy variables for each of the Big Four firms (instead of a single variable representing all four companies).
Table 6 Estimation of the model for parent companies (Equation 1 with dummies for each Big Four irm)
ACi = β0 + β1CGi+ β2PEi + β3ADRi+ βnBIGFOURi+ β5SDi + β6REVi+ β7DEBTi + β8SIZEi+ε
AC 1 2 3 4 5 6 7 8
CG -0,88* -1,27** - -0,98* -1,26** -1,18** -0,85** -1,32**
BIGFOUR
KPMG 1,80*** 1,76** 1,69*** 1,69*** 1,74** 1,22** 1,12*
PWC 1,66** 1,69** 1,68** 1,34* 1,68**
SD
SD ln(deferred assets) 0,34** 0,29** 0,36** 0,24*
SD(deferred assets) 4,31** 3,79** 2,67* 4,76**
SIZE
SIZE ln(total assets) -0,41**
SIZE (total assets) -0,02**
SIZE ln(equity) -0,32**
SIZE (equity) -0,03**
SIZE ln(earnings) -0,38**
SIZE (earnings) -0,09*
SIZE ln(total revenue) -0,25**
SIZE (total revenue) -0,04**
Number of observations 92 92 81 81 71 71 79 79
Prob>Chi2 0,001 0,000 0,003 0,001 0,002 0,006 0,044 0,003
Pseudo R2 0,17 0,19 0,14 0,19 0,20 0,15 0,08 0,17
ACi = dummy variable that is equal to 1 when irm i opts to maintain the balance of deferred assets and 0 if it opts to derecognise the balance; CGi = dummy variable that is equal to 1 when irm i participates in different levels of corporate governance of BM&FBovespa and 0 when it does not participate;
ADRi = dummy variable that is equal to 1 when irm i issues ADRs and 0 when it does not; PEi= dummy variable that is equal to 1 when irm i has a pro -gram for administrative participation in earnings and 0 when it does not; BIGFOURi = dummy variable that indicates whether irm i is audited by a Big Four irm; KPMG = dummy variable that is equal to 1 if irm i is audited by KPMG and 0 otherwise; PwC = dummy variable that is equal to 1 if irm i is audited by PricewaterhouseCoopers and 0 otherwise; Deloitte = dummy variable that is equal to 1 if irm i is audited by Deloitte and 0 otherwise; Ernst & Young = dummy variable that is equal to 1 if irm i is audited by Ernst & Young and 0 otherwise; SDi = size of the deferred assets of irm i; SD ln(deferred assets) i = natural logarithm of the balance of the deferred assets of irm i; SD (deferred assets) i = balance of the deferred assets of irm i divided by 100 million;
REVi = dummy variable that is equal to 1 when irm i has a balance in the 2007 revaluation reserve account; DEBTi = value of indebtedness (debt/equity) of irm i; SIZEi = size of company i; SIZEi ln(total assets) = natural logarithm of the total assets of company i; SIZEi (total assets) = balance of the total assets of irm i divided by 100 million; SIZEi ln(equity) = natural logarithm of the equity of company i; SIZEi (equity) = balance of the equity of irm i divided by 100 million; SIZEi ln(earnings) = natural logarithm of the earnings of company i; SIZEi (earnings) = balance of the earnings of irm i divided by 100 million; SIZEi ln(revenue) = natural logarithm of the earnings of company i; SIZEi (revenue) = balance of the revenue of irm i divided by 100 million.
*, **, and *** indicate statistical signiicance at the 10%, 5%, and 1% levels, respectively.
Σ
4n=1
9 Only the results for the regressions that used the dummies for each Big Four irm are shown. The results with the BIGFOUR dummy are similar to those shown in Table 4 in terms of coeficient signs and statistical signiicance.
Two of the auditing irms are positively associated with companies that maintained the balance (KPMG and Pri-cewaterhouseCoopers). No coeicient was statistically sig-niicant for Deloitte, and Ernst & Young was only signii-cant for the eighth speciication. hus, the results can be interpreted based on Lawrence et al. (2011), who showed that diferences in quality between companies based on whether they are audited by the Big Four irms can only re-lect client characteristics; they cannot rere-lect the inluence of the auditing company.
Because the results are not consistent among each of the Big Four irms, it is not possible to say that the efect in Table 5 was caused by the size of the auditing irm. An alternative explanation for this result is the establishment of individual policies by each auditing irm or even the fact
that diferent irms audit clients from diferent sectors. Fu-ture studies on accounting choices should use other control variables, such as sector, to segregate the irm characteris-tics from the auditor.
4.3 Sensitivity analysis
To evaluate whether the characteristics that guided the parent companies’ choices are similar for the entire econo-mic group, logistic regression was used for the consolida-ted inancial statements using the BIGFOUR9 variable and dummies for each Big Four irm: KPMG, PWC, Deloitte, and Ernst & Young.
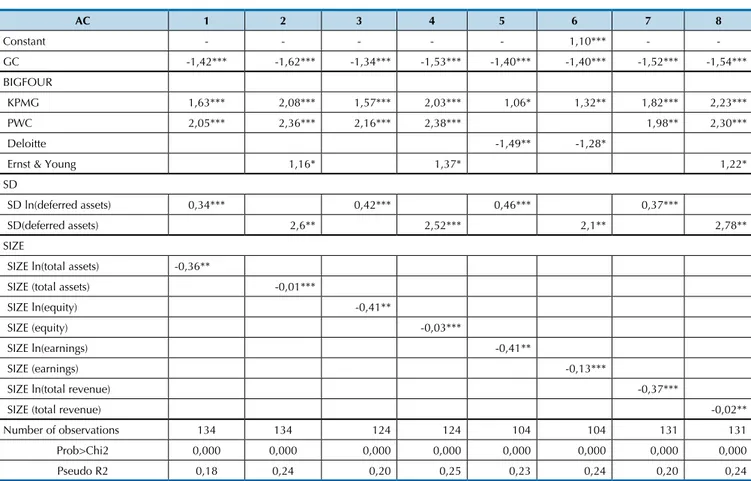
corpo-Table 7 – Estimation of the model for consolidated statements (equação 1 whit dummies for each Big Four irm)
ACi = β0 + β1CGi+ β2PEi + β3ADRi+ βnBIGFOURi+ β5SDi + β6REVi+ β7DEBTi + β8SIZEi+ε
AC 1 2 3 4 5 6 7 8
Constant - - - 1,10*** -
-GC -1,42*** -1,62*** -1,34*** -1,53*** -1,40*** -1,40*** -1,52*** -1,54***
BIGFOUR
KPMG 1,63*** 2,08*** 1,57*** 2,03*** 1,06* 1,32** 1,82*** 2,23***
PWC 2,05*** 2,36*** 2,16*** 2,38*** 1,98** 2,30***
Deloitte -1,49** -1,28*
Ernst & Young 1,16* 1,37* 1,22*
SD
SD ln(deferred assets) 0,34*** 0,42*** 0,46*** 0,37***
SD(deferred assets) 2,6** 2,52*** 2,1** 2,78**
SIZE
SIZE ln(total assets) -0,36**
SIZE (total assets) -0,01***
SIZE ln(equity) -0,41**
SIZE (equity) -0,03***
SIZE ln(earnings) -0,41**
SIZE (earnings) -0,13***
SIZE ln(total revenue) -0,37***
SIZE (total revenue) -0,02**
Number of observations 134 134 124 124 104 104 131 131
Prob>Chi2 0,000 0,000 0,000 0,000 0,000 0,000 0,000 0,000
Pseudo R2 0,18 0,24 0,20 0,25 0,23 0,24 0,20 0,24
ACi = dummy variable that is equal to 1 when irm i opts to maintain the balance of deferred assets and 0 if it opts to derecognise the balance; CGi = dummy variable that is equal to 1 when the corporate governance of irm i is recognised by BM&FBovespa and 0 when it does not participate; ADRi = dummy variable that is equal to 1 when irm i issues ADRs and 0 when it does not; PEi = dummy variable that is equal to 1 when irm i has a program for administrative participation in earnings and 0 when it does not; BIGFOURi = dummy variable that is equal to 1 when irm i is audited by a Big Four irm and 0 otherwise; KPMG = dummy variable that is equal to 1 when irm i is audited by KPMG and 0 otherwise; PwC = dummy variable that is equal to 1 when irm i is audited by PricewaterhouseCoopers and 0 otherwise; Deloitte = dummy variable that is equal to 1 when irm i is audited by Deloitte and 0 otherwise; Ernst & Young = dummy variable that is equal to 1 when irm i is audited by Ernst & Young and 0 otherwise; SDi = size of the deferred assets of irm i; SD ln(deferred assets) i = natural logarithm of the balance of the deferred assets of irm i; SD (deferred assets) i = balance of the deferred assets of irm i divided by 100 million; REVi = dummy variable that is equal to 1 when irm i had a balance in its 2007 revaluation reserve account; DEBTi = value of indebtedness (debt/equity) for irm i; SIZEi = size of company i; SIZEi ln(total assets) = natural logarithm of the total assets of company i; SIZEi (total assets) = balance of the total assets of irm i divided by 100 million; SIZEi ln(equity) = natural logarithm of the equity of company i; SIZEi (equity) = balance of the equity of irm i divided by 100 million; SIZEi ln(earnings) = natural logarithm of the earnings of company i; SIZEi (earnings) = balance of the earnings of irm i divided by 100 million; SIZEi ln(revenue) = natural logarithm of the earnings of company i; SIZEi (revenue) = balance of the revenue of irm i divided by 100 million.
*, **, and *** indicate statistical signiicance at the levels of 10%, 5%, and 1%, respectively.
Σ
4n=1
rate governance according to BM&FBOVESPA (CG), the relationship was reversed. It is not possible to claim that auditing performed by a Big Four irm implies the choice to maintain the deferred asset balance. he coeicients are positive and signiicant for KPMG and PWC (except for
speciications 5 and 6). For Ernst & Young, the coeicients are positive and signiicant at the 10% level only for three speciications (2, 4, and 8). For Deloitte, the coeicients are only statistically signiicant for two speciications (5 and 6), but they are negative, unlike the others.
The sensitivity analysis indicates that the same cha-racteristics explain the decision to maintain or dere-cognise the balance of deferred assets for the parent
company and for the economic group as a whole. These results can contribute to future research on intragroup accounting choices.
5 CONCLUSION
Laws 11.638/2007 and 11.941/2009 introduced sig-nificant changes to accounting standards in Brazil. The
choi-Almeida, J. E. F., & choi-Almeida, J. C. G. (2007). Auditoria e earnings management: estudo empírico nas empresas de capital aberto auditadas pelas Bigfour e demais irmas de auditoria. Anais do Congresso USP de Controladoria e Contabilidade, Universidade de São Paulo, São Paulo, Brasil, 7.
Andrade, A., & Rossetti, J. P. (2007). Governança corporativa: fundamentos, desenvolvimento e tendências. (3. ed.). São Paulo: Atlas.
Azevedo, F. B., & Costa, F. M. (2008). Efeito da troca da irma de auditoria no gerenciamento de resultados das companhias abertas brasileiras.
Anais do Congresso da Associação Nacional dos Programas de Pós-Graduação em Ciências Contábeis - ANPCONT, Salvador/BA, São Paulo, Brasil, II.
Bartov, E., & Bodnar, G. M. (1996, July). Alternative accounting methods, information asymmetry and liquidity: theory and evidence. he Accounting Review, 71 (3), 397-418.
Beasley, M. S., & Petroni, K. (2001). Board independence and audit-irm type. Auditing: A Journal of Practice & heory, 20 (1), 97-114. Beatty, A., & Weber, J. (2003, January). he efects of debt contracting on
voluntary accounting method changes. he Accounting Review, 78, (1), 119-142.
Comissão de Valores Mobiliários (1999). Deliberação n. 294 de 26 de março de 1999. Diário Oicial [da] República Federativa do Brasil, Brasília, 30 março, Seção 1, p. 205.
Comissão de Valores Mobiliários. (2008). Deliberação n. 565/2008, de 17 de dezembro de 2008. Aprova o Pronunciamento Técnico CPC 13 emitido pelo Comitê de Pronunciamentos Contábeis que trata da Adoção Inicial da Lei n. 11.638/07. Rio de Janeiro: Comissão de Valores Mobiliários.
Comitê de Pronunciamentos Contábeis. (2008). Pronunciamento Técnico CPC 13, de 05 de dezembro de 2008. Brasília.
Cormier, D., Demaria, S., Lapointe-Antunes, P., & Teller, R. (2009). First-time adoption of IFRS, managerial incentives, and value-relevance: some french evidence. Journal of International Accounting Research, 8 (2), 1-22.
DeGeorge, F., Patel, J., & Zeckhauser, R. (1999). Earnings management to exceed thresholds. Journal of Business, 72, 1-33.
Dias Filho, J. M., & Machado, L. H. B. (2004). Abordagens da pesquisa em contabilidade. In: Iudícibus, S., & Lopes, A. B. (Orgs.). Teoria avançada da contabilidade (pp. 15-64). São Paulo: Atlas. Feldman, D. A., & Read, W. J. (2010, May). Auditor conservatism ater
Enron. Auditing: A Journal of Practice and heory, 29 (1), 267-278. Fields, T. D., Lys, T. Z., & Vincent, L. (2001). Empirical research on
accounting choice. Journal of Accounting and Economics, 31, 255-307.
Hair, J. F. Jr., Anderson, R. E., Tatham, R. L., & Black, W. C. (2006). Análise multivariada de dados. (5. ed.). São Paulo: Bookman.
Healy, P. M. (1985, April). he efect of bonus schemes of accounting decisions (Symposium on Management Compensation and the Managerial Laboratory Market). Journal of Accounting & Economics, Rochester, 7, 85-107.
Jensen, M. C., & Meckling, W. H. (1976). heory of the irm: managerial behavior, agency costs and ownership structure. Journal of Financial Economics, 3 (4), 305-360.
Lawrence, A., Minutti-Meza, M., & Zhang, P. (2011, January). Can Big 4 versus Non-Big 4 diferences in audit-quality proxies be attributed to client characteristics? he Accounting Review, 86 (1), 259-286.
Lei n. 6.404, de 15 de dezembro de 1976. (1976). Diário Oicial [da] União, Brasília, 17 dezembro. Recuperado de http://www.planalto. gov.br/ccivil_03/LEIS/L6404consol.htm.
Lei n. 11.638, de 28 de dezembro de 2007. (2007). Diário Oicial [da] União, Brasília, Sessão 1 ed. extra, p. 2.
Lei n. 11.941, de 27 de maio de 2009. (2009). Diário Oicial [da] União, Brasília, 28 maio, Sessão 1, p. 3.
Lin, Z, J., & Liu, M. (2009). he impact of corporate governance on auditor choice: Evidence from China. Journal of International Accounting, Auditing and Taxation, 18, 44-59.
Lopes, A., & Tukamoto, Y. S. (2007, janeiro-março). Contribuição ao estudo do gerenciamento de resultados: uma comparação entre as companhias abertas brasileiras emissoras de ADRs e não emissoras de ADRs. Revista de Administração – RAUSP, São Paulo, 42 (1), 86-96. Lopes, A., & Walker, M. (2012). Asset revaluations, future irm
performance and irm-level corporate governance arrangements: new evidence from Brazil? British Accounting Review (Forthcoming). Martinez, A. L. (2010). Quando o conselho de administração e auditoria
evitam earnings management? Evidências empíricas para empresas brasileiras. Revista de Informação Contábil, 4, 76-93.
Martins, G. A. (2001). Estatística geral e aplicada. São Paulo: Atlas.
Medida provisória n. 449, de 3 de dezembro de 2008. (2008). Diário Oicial [da] União, Brasília, 4 dezembro, Sessão 1, p. 41.
Paulo, E. (2007). Manipulação das informações contábeis: uma análise teórica e empírica sobre os modelos operacionais de detecção de gerenciamento de resultados. Tese de doutorado em Ciências Contábeis, Departamento de Contabilidade e Atuária, Universidade de São Paulo, São Paulo, SP, Brasil.
Perlingeiro, B. C. L. (2009). Teoria das escolhas contábeis: fair value de derivativos em bancos no Brasil. Dissertação de mestrado em Ciências Contábeis, Departamento de Contabilidade e Atuária da Universidade de São Paulo, São Paulo, SP, Brasil.
References
ces made regarding deferred assets.
This analysis identified 96 companies (144 consoli-dated) that could opt to maintain or lower the balances of their deferred assets. The analysis identified three variables that were related to the decision of how to treat this balance: the levels of corporate governance according to BM&FBovespa, audit performance by Big Four firms, and the size of the deferred assets, con-trolling for the size of the company. These results have implications for regulators and companies.
The results regarding governance indicate that companies that seek to attract investors through the BM&FBOVESPA system are more likely to implement international accounting policies. This fact, combined with the non-significant result for the ADR variable, may imply that companies that had exposure to diffe-rent accounting models before the convergence in Bra-zil prefer an accelerated reduction of these differences.
The variable indicating whether a company is audi-ted by a Big Four firm raises new questions regarding why the clients of large auditing firms behave differen-tly than those who are audited by smaller firms. The
results show that the variable indicating the size of the auditor can be an indirect proxy for sets of firm charac-teristics, making it difficult to interpret these results. This issue presents an opportunity for future research because it is related to accounting choices, which is a theme that has received little attention in Brazil and is increasingly discussed in the literature (Lawrence et al., 2011).
The size of deferred assets can influence a company’s choice as to whether the balance should be maintained. This behaviour is consistently supported after controlling for company size (SIZE) using different measurements. This fact highlights that the size of the balance can be fundamental in directing choices (Cormier et al., 2009). These results suggest that a similar study should be per-formed on accounting choices made for the adoption of International Accounting Standards in Brazil.
Ramos, G. M., & Martinez, A. L. (2006, julho-dezembro). Governança corporativa. Revista Contemporânea de Contabilidade (RCC), ano III, 1 (6), 143-164.
Rezende, A. J. (2005, janeiro-junho). A relevância da informação contábil no processo de avaliação de empresas da nova e velha economia – uma análise de investimentos em ativos intangíveis e seus efeitos em value-relevance do lucro e patrimônio líquido. Brazilian Business Review, 2 (1), 33-52.
Santana, M. H. (2008). he novo mercado. In Focus 5: Novo Mercado and its followers: case studies in corporate governance reform. Global Corporate Governance Forum. International Finance Corporation. Santos, L. S. R., & Costa, F. M. (2008, setembro-dezembro).
Conservadorismo contábil e timeliness: evidências empíricas nas demonstrações contábeis de empresas brasileiras com ADRs negociados na Bolsa de Nova Iorque. Revista de Contabilidade e Finanças, 19 (48), 27-36.
Schvirck, E. (2006). A reavaliação de ativos e seus impactos na análise das demonstrações contábeis no Brasil. Dissertação de mestrado em Controladoria e Contabilidade, Programa de Pós-Graduação da Universidade de São Paulo, São Paulo, SP, Brasil.
Schvirck, E., & Giasson, O. R. (2008). Peril econômico-inanceiro de
empresas que fazem e que não fazem reavaliação de ativos. BBR.
Brazilian Business Review, Vitória, 5, 255-270.
Shleifer, A., & Vishny, R. W. (1997, June). A survey of corporate governance. Journal of Finance, LII, (2), 737-783.
Silva, A. H. C. (2008). Escolha de práticas contábeis no Brasil: uma análise sob a ótica da hipótese dos covenants contratuais. Tese de doutorado em Ciências Contábeis, Programa de Pós-Graduação da Universidade de São Paulo, São Paulo, SP, Brasil.
Silveira, A. M., Barros, L. A. B. C., & Famá, R. (2004). Qualidade da governança corporativa no Brasil e os fatores que a determinam.
Anais do Encontro Anual da ANPAD, Curitiba, 1-16, 27.
Silveira, M. A. (2006). Gerenciamento de resultados e opções de ações: uma pesquisa em companhias abertas no Brasil. Anais do Congresso USP de Controladoria e Contabilidade, São Paulo, USP, CD-ROM, 6. Stolowy, H., & Breton, G. (2004). Accounts manipulation: a literature
review and proposed conceptual framework. Review of Accounting and Finance, 3, 5-92.
Watts, R. L. (2003, September). Conservatism in accounting part I: explanations and Implications. Accounting Horizons, 17 (3), 207-221. Watts, R. L., & Zimmerman, J. L. (1986). Positive accounting theory. New