Correlation between placental thickness in the
second and third trimester and fetal weight
Correlação entre a espessura da placenta
no segundo e terceiro trimester e peso fetal
Morteza Sanei taheri2haMid reza haghighatkhah2
Abstract
PURPOSE: To investigate relationship between placental thickness during the second and third trimesters and placental and birth weights. METHODS: From January 2011 to June 2012, a total of 250 singleton pregnant women presented at our antenatal clinic were enrolled in this prospective study. All recruited women were assessed at the 1st trimester
screening for baseline demographic and obstetric data. The placental thickness was measured trans-abdominally by placing the ultrasound transducer perpendicularly to the plane of the placenta, in the area of the cord insertion at second and third trimester. Pearson’s correlation analysis was used to establish the degree of relationship between placental thickness and birth and placental weights. RESULTS: Of 250 recruited participants, 205 women were able to complete the study. The mean age of cases was 26.4±5.1. Values of mean birth and placental weights were 305.56±657.0 and 551.7±104.8 grams respectively. Ultrasonographic measures of placental thickness in second and third trimester and changes between them were 21.68±4.52, 36.26±6.46 and 14.67±5.67 mm respectively. There was a signiicant positive correlation between placental thickness and birth weight in the second and third trimesters (r=0.15, p=0.03; r=0.14, p=0.04 correspondingly). CONCLUSION: According to our study, birth weight has a positive relation with both second and third trimester placental thickness; however, placental thickness change could not predict low birth weight.
Resumo
OBJETIVO: Investigar a relação entre espessura da placenta no segundo e terceiro trimestre e peso ao nascer e da placenta. MÉTODOS: Um total de 250 gestantes portadoras de um feto único que atenderam nossa clínica pré-natal de janeiro a junho de 2012 foram incluídas no estudo. Todas as mulheres recrutadas foram avaliadas na triagem do 1o trimestre a respeito dos dados demográicos e obstétricos basais. A espessura da placenta foi medida
trans-abdominalmente colocando-se o transdutor do ultrassom perpendicular ao plano da placenta, na área de inserção do cordão, no segundo e terceiro trimestre. A análise de correlação de Pearson foi utilizada para estabelecer o grau de relação entre a espessura da placenta e o peso ao nascer e da placenta. RESULTADOS: Entre as 250 participantes recrutadas, 205 conseguiram completar o estudo. A média de idade das mulheres foi de 26,4±5,1 anos. O peso médio ao nascer e da placenta foram, respectivamente, de 305,56±657,0 e 551,7±104,8 gramas. As medidas ultrassonográicas da espessura da placenta no segundo e terceiro trimestre e as mudanças entre eles foram, respectivamente, de 21,68±4,52, 36,26±6,46 e 14,67±5,67 mm. Houve uma correlação positiva signiicativa entre a espessura da placenta no segundo e terceiro trimestre e o peso ao nascer (r=0.15, p=0.03; r=0.14, p=0.04). CONCLUSÃO: Com base em nosso estudo, o peso ao nascer tem correlação positiva com a espessura da placenta tanto no segundo como no terceiro semestre; entretanto, a espessura da placenta não pode predizer baixo peso ao nascer.
1Department of Obstetrics and Gynecology, Tajrish Hospital, Shahid Beheshti University of Medical Sciences – Tehran, Iran. 2Department of Radiology, Tajrish Hospital, Shahid Beheshti University of Medical Sciences – Tehran, Iran.
Conlict of interests: none.
Keywords
Placenta Fetal development Birth weight Ultrasonography
Palavras-chave
Placenta Desenvolvimento fetal Peso ao nascer Ultrassonograia
Correspondence
Aida Moeini, M.D. Department of Obstetrics and Gynecology, Tajrish Hospital Tajrish Sq, Tehran, Iran
Received
06/18/2013
Accepted with modiications
07/12/2013
Introduction
The human placenta develops with the principal function of providing nutrients and oxygen to the fetus1.
Adequate fetal growth and subsequent normal birth weight depends on the eficient delivery of nutrients from the mother to the fetus via normally functioning utero-placental organ2. It is clear that normal development of
placenta during gestation is necessary for supporting of a healthy fetus3. On the other hand, any impairment in its
development may have a profound impact on fetal devel-opment and pregnancy outcome1. The ratio of the birth
weight to the placental weight has been used since the 1940s as an index for the appropriateness of fetal growth4.
The deinitive placenta is clearly visible on ultrasound from approximately 9–10 weeks of gestation, when it demonstrates a uniformly granular echogenic pattern5.
Ultrasonography (US) enables the evaluation of the placenta and the detection of placental abnormalities using differ-ent parameters such as placdiffer-ental thickness and volume or especial techniques like three-dimensional (3D) power Doppler6-10. Recent studies focused on 3D measurement
of placenta to predict the adverse pregnancy outcome; however, this technique is relatively new, needs complex clinical setting and gives conlicting results regarding its reproducibility in evaluating placenta1. Ultrasound
measurement of placental thickness is a relative simple, reproducible and clinical useful way, which had been used for more than two decades6-8.
Some investigators showed in two different studies that placental size in mid-pregnancy independently has relation-ship with birth parameters9,10; although most of the placental
growth occurred in the third trimester. Other researchers like Goldenberg et al.11 stated that birth size was only predicted
in the third trimester by fetal ultrasound measurements. Many studies were retrospective or cross-sectional in design and could not truly show the relationship between placental measurements and fetal outcome6,10. It seems reasonable that
serial evaluation of placental thickness in second and third trimester could help to determine normal development and functional placenta and deserve as a good predictor of fetal growth and birth weight.
The aim of this prospective longitudinal study was to investigate the relationship between placental thick-ness during the second and third trimesters and placental and birth weights.
Methods
A total of 250 pregnant women aged between 15 and 45 years presented at our antenatal clinic of Tajrish Hospital were enrolled in a prospective observational study from January 2011 to June 2012. The exclusion criteria were
systemic illness or genetic abnormality, for example, sickle cell disease, morbid obesity, missing records and unwilling to incorporate in the study. All patients provided an informed written consent after they were fully instructed about the investigation. The study was approved by ethical committee of Shahid Beheshti University of Medical Sciences.
All recruited women were observed at the 1st
trimes-ter screening at antenatal clinic and assessed for baseline demographic and obstetric data including age, parity, body mass index (BMI) and past medical events. Smoking, alcohol and drug use were also determined. At second and third trimester (15–20 and 30–34 weeks of gestation re-spectively), the maternal weight, weight gain, BMI, BMI gain and data of ultrasound examination were recorded. At the time of delivery after assessment of maternal weight as mentioned above, the birth weight (in grams), fetal sex, and mode of delivery were taken. After delivery, the placenta was weighed in grams as previously described by Azpurua et al.2. Fetal and neonatal status and morbidity
including baby Apgar scores, fetal distress or fetal death and admission to the neonatal intensive care unit were also determined. All the examinations and data recording were performed by two senior resident physicians.
All pregnant women underwent ultrasound evalua-tion of placental thickness at the time of second trimester (15–20 weeks of gestation) as well as third trimester (30–34 weeks of gestation). All sonographic examinations were performed trans-abdominally using a Hitachi EUB 525 Color Doppler ultrasound scanner (Gyeonggi-do, South Korea) with a 3.5-MHz convex-array transducer. The pla-cental thickness was measured by placing the ultrasound transducer perpendicularly to the plane of the placenta, in the area of the cord insertion, near the mid-placental por-tion as described by Hoddick et al.12. Each evaluation was
performed by one of two experienced sonographers of our hospital with minimum inter- and intra-observer variability. Results were given as mean plus or minus SD. Statistical analysis was performed using the SPSS 16.0 statistical software package (SPSS Inc., Chicago, IL, USA) using One-way ANOVA and one-way repeated measures ANOVA tests. Pearson’s correlation analysis was used to establish the degree of relationship between placental thickness and birth and placental weights. P values of less than 0.05 were considered statistically signiicant.
Results
(18%) mothers had history of previous disease including diabetes, hypertension, thyroid disease and infertility. Two cases of intrauterine fetal demise were occurred in the study group. No cases of hydrops fetalis or a speciic infectious disease (syphilis, cytomegalovirus infection, toxoplasmosis, schistosomiasis) were reported.
Mean±SD of gestational age was 268.2±22.3 days. Values of mean birth and placental weights were 3,051.5±657.0 and 551.7±104.8 grams respectively. The percentage of macrosomia (>4,000 g) and low birth weight (<2,500 g) neonates at delivery were 2.5 and 14.6% respectively. The delivery mode was normal vaginal (NVD) in 121 women (59%) and cesarean in 84 cases (41%). Baby Apgar score of less than 3, 3 to 7 and greater than 7 were observed in 4 (2%), 19 (9.3%) and 182 (88.7%) newborns respectively.
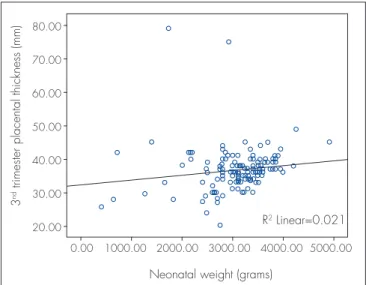
Ultrasonographic measures of placental thickness in second and third trimester and changes between them were 21.6±4.5 (range: 14.9-35 mm), 36.2±6.4 (range: 20-79 mm) and 14.67±5.67 mm respectively. There was a signiicant positive correlation between placental thick-ness and birth weight in the second and third trimesters (r=0.15, p=0.03; r=0.14, p=0.04 correspondingly) (Figures 1 and 2). However, no correlation was observed with pla-cental thickness change (p=0.7). Plapla-cental weight did not correlate with both second and third trimester’s placental thickness (r=0.005, p=0.9; r=0.003, p=0.9 respectively).
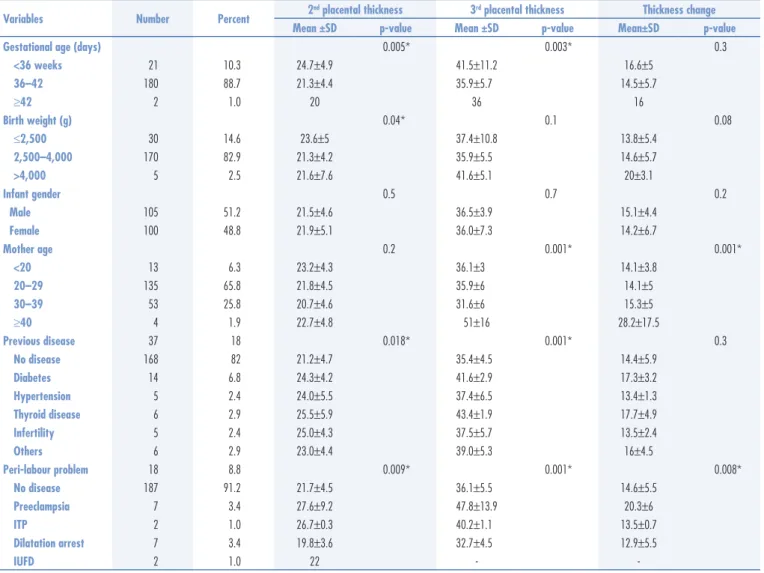
On the other hand, placental thickness change was related to mother’s age, weight and height (r=0.2, p=0.003; r=0.16, p=0.02; r=0.14, p=0.04 respectively). As it can be observed in the Table 2, mothers with gestational age less than 36 weeks, age greater than 40 years, history
of diabetes or thyroid disease and suffering from ITP or preeclampsia had thicker placenta in the third trimester. This pattern was also observed for second trimester placental thickness but not for mother age. Placental thickness of second trimester were classiied into 3 sub-groups of ≤17, 17–27 and >27 mm (based on ROC-curve). Evaluation of birth weight in these sub-groups shows a signiicant lower birth weight in the thickest sub-group (3,100.1±565.6 g in thickness of ≤17 mm, 3,176.6±626.1 gr in thickness of 17–27 mm and 2,714.2±919.6 gr in thickness of >27 mm [p=0.005]). Also, this pattern was observed in placental thickness of third trimester (2,966.9±845.6 g in thickness of ≤30 mm, 3,195.8±410.5 gr in thickness of 30–40 mm and 2,828.5±580.9 g in thickness of >40 mm [p= 0.001]).
Table 1. Baseline characteristics of pregnant women at irst visit
Variables n %
Gravity
1 104 50.7
2 65 31.7
3 24 11.7
≥4 12 5.9
Parity
0 130 63.4
1 58 28.3
2 12 5.9
≥3 5 2.5
Abortion
0 157 76.6
1 42 20.5
≥2 61 2.5
Mean weight±SD (kg) 63.4±8.0
Mean height±SD (cm) 160.6±7.8
Mean BMI±SD (kg/m2) 19.8±3.1
Mean FBS±SD (mg/dl) 85.6±12.9
BMI: body mass index; FBS: fasting blood sugar; SD: standard deviation.
Figure 1. Scatter-plot illustrating the association between the placental thickness measured by ultrasound at second trimester and neonatal birth weight (r=0.15, p=0.03)
2
nd trimester placental thickness (mm)
Neonatal weight (grams) 0.00
35.00
30.00
25.00
20.00
15.00
10.00
1000.00 2000.00 3000.00 4000.00 5000.00
Figure 2. Scatter-plot illustrating the association between the placental thickness measured by ultrasound at third trimester and neonatal birth weight (r=0.14, p=0.04)
3
nd trimester placental thickness (mm)
Neonatal weight (grams)
R2 Linear=0.021
0.00 80.00
70.00
60.00
50.00
40.00
30.00
20.00
placental growth of forty singleton pregnant women. They showed a signiicant correlation (r>0.79) between second-trimester placental growth rate and birth weight9.
In study of Kinare et al.10, mid-pregnancy placental
volume was related to birth weight. Correlation of pla-cental thickness with gestational age and fetal growth was also reported in a research by Karthikeyan et al.19.
Sonographic measurement of placental thickness is a relative simple and clinical useful way to detect ‘early warning signs’ which could be done in any unequipped obstetrician center20. Cooley et al.21 suggested that
an-tenatal ultrasound of the placenta may aid detection of placental disease. They showed the placental thickness in the second trimester was less in pregnant women complicated by chorioamnionitis21. Unfortunately, even
sonologists make limited attention to placental thickness in their routine evaluation of pregnancy20. In a research
held in Nigeria, signiicant positive correlation were found between placental thickness and estimated fetal
Discussion
Several parameters were used to assess fetal growth in order to quantify intrauterine environmental adequacy and fetal well-being13-15. Normal placental function
and structure is a necessary factor for the formation of a healthy fetus and consequently normal birth weight16.
Early detection of any pathology in the placental bed and villi helps obstetrician to consider prenatal care precisely17. The rate of placental growth appears to be
an important determinant of birth weight, with the rate between 17 and 20 weeks gestation being a predictor of fetal abdominal and head circumference, femoral length and biparietal diameter; weaker associations are observed for placental growth earlier in pregnancy18.
Several aspects of placental growth including volume, weight, and plate area were investigated in different researches in order to ind their correlation with fetal anthropometry2. For example, Clapp et al.9 evaluated
Table 2. Labor characteristics and second and third trimester’s placental thickness according delivery outcome data
Variables Number Percent 2
nd placental thickness 3rd placental thickness Thickness change
Mean ±SD p-value Mean ±SD p-value Mean±SD p-value
Gestational age (days) 0.005* 0.003* 0.3
<36 weeks 21 10.3 24.7±4.9 41.5±11.2 16.6±5
36–42 180 88.7 21.3±4.4 35.9±5.7 14.5±5.7
≥42 2 1.0 20 36 16
Birth weight (g) 0.04* 0.1 0.08
≤2,500 30 14.6 23.6±5 37.4±10.8 13.8±5.4
2,500–4,000 170 82.9 21.3±4.2 35.9±5.5 14.6±5.7
>4,000 5 2.5 21.6±7.6 41.6±5.1 20±3.1
Infant gender 0.5 0.7 0.2
Male 105 51.2 21.5±4.6 36.5±3.9 15.1±4.4
Female 100 48.8 21.9±5.1 36.0±7.3 14.2±6.7
Mother age 0.2 0.001* 0.001*
<20 13 6.3 23.2±4.3 36.1±3 14.1±3.8
20–29 135 65.8 21.8±4.5 35.9±6 14.1±5
30–39 53 25.8 20.7±4.6 31.6±6 15.3±5
≥40 4 1.9 22.7±4.8 51±16 28.2±17.5
Previous disease 37 18 0.018* 0.001* 0.3
No disease 168 82 21.2±4.7 35.4±4.5 14.4±5.9
Diabetes 14 6.8 24.3±4.2 41.6±2.9 17.3±3.2
Hypertension 5 2.4 24.0±5.5 37.4±6.5 13.4±1.3
Thyroid disease 6 2.9 25.5±5.9 43.4±1.9 17.7±4.9
Infertility 5 2.4 25.0±4.3 37.5±5.7 13.5±2.4
Others 6 2.9 23.0±4.4 39.0±5.3 16±4.5
Peri-labour problem 18 8.8 0.009* 0.001* 0.008*
No disease 187 91.2 21.7±4.5 36.1±5.5 14.6±5.5
Preeclampsia 7 3.4 27.6±9.2 47.8±13.9 20.3±6
ITP 2 1.0 26.7±0.3 40.2±1.1 13.5±0.7
Dilatation arrest 7 3.4 19.8±3.6 32.7±4.5 12.9±5.5
IUFD 2 1.0 22 -
-*Statically signiicant.
weight in the second and third trimesters (r=0.61 and r=0.57 respectively)22.
In contrary to some other researches, our study evalu-ates both second and third trimester’s placental thickness and their relationship with birth weight in a prospective longitudinal model. A weak but positive correlation be-tween placental thickness and birth weight in the second as well as third trimesters was observed accordingly.
Many pathological conditions could induce placento-megaly a result of inlammation, edema, or compensatory hypertrophy6. This subject was observed in our cases, as
mothers with gestational age less than 36 weeks, his-tory of diabetes or thyroid disease and suffering from ITP or preeclampsia had thicker mean placenta in both trimesters. In a study by Elchalal et al.6 a linear increase
of placental thickness was found to correlate with ges-tational age throughout pregnancy. They also showed a higher percentage of thick placenta in birth weight at term above 4,000 g or less than 2,500 g. However, they did not ind any difference between patients with thick placenta and control group in terms of diabetes and hypertension. The authors insisted that increased placental thickness is not diagnostic of any speciic dis-order but may contribute to the management of a fetus at risk6. As it was shown in our study, patients with ITP
or preeclampsia had thicker placenta in comparison with normal pregnant women. This observation was similar to the reports of previous studies23,24. Raio et al.25 stated
that abnormally thick placentas have been correlated with adverse pregnancy outcome. Also, more frequent thick placentas in cases with absent end-diastolic umbilical arterial low were found. It seems that intervillous per-fused more slowly when the villous tree is too complex or too dense26. Recently, investigators are trying to increase
detection rate of early sign for impaired placentation by combination of ultrasound indings with placental hor-mones such as human chorionic gonadotrophin (hCG), progesterone and pregnancy associated placenta protein A (PAPP-A)1. Ultrastructural study of Macara et al.27 of
placenta indicates that thickening of the basal lamina and increased deposition of collagen and laminin together with congestion of the capillaries by erythrocytes is the cause of limited oxygen transfer from the intervillous space to the growth retarded fetus. In a recent study, investigators proposed that sonographic increment of placental thick-ness during second trimester is due to over-inlation of the intervillous space by maternal blood rather than by adaptive formation of functional placental tissue28.
Deinition of placentomegaly was different in vari-ous reports on the basis of gestational age, measure-ment technique and feto-maternal condition during pregnancy. Elchalal et al.6 deined a thick placenta
(above 90th percentile) as thicker than 35 mm, when
measured between 20 and 22 gestational weeks, and as thicker than 51 mm between 32 and 34 gestational weeks6. Dombrowski et al.24 used cut off at least 4 cm
to diagnose thick placenta in a representative portion perpendicular to the chorionic plate. Habib16 used
placental thickness of less than 2 cm at 36 weeks’ gestation as a sensitive cut-off point for detecting low birth weight infants. A placental thickness more than 40 mm at term is associated with gestational diabetes, intrauterine infections and hydrops fetalis29. La Torre
et al.30 opined that at no stage of pregnancy placental
thickness exceeded 40 mm indirectly, thus indicating the cut off value for the upper limit. According to the present study, mother with placental thickness of more than 27 mm in second trimester and more than 37 mm in third trimester bear smaller babies. On the basis of the indings of this longitudinal research, it seems that using cut points for placental thickness can help obstetrician to predict newborn birth weight and identify the fetus in danger of being low birth weight. However, we realize that the study could have some weaknesses. The main bias is that the study has low number of patients. Hence, we recommend evaluation of these parameters with more subjects to ind this cut point with more power.
1. Suri S, Muttukrishna S, Jauniaux E. 2D-ultrasound and endocrinologic evaluation of placentation in early pregnancy and its relationship to fetal birthweight in normal pregnancies and pre-eclampsia. Placenta. 2013 Jun 8. DOI: 10.1016/j.placenta.2013.05.003. [Epub ahead of print]
2. Azpurua H, Funai EF, Coraluzzi LM, Doherty LF, Sasson IE, Kliman M, et al. Determination of placental weight using two-dimensional sonography and volumetric mathematic modeling. Am J Perinatol. 2010;27(2):151-5. DOI:10.1055/s-0029-1234034.
3. Salaia CM, Zhang J, Miller RK, Charles AK, Shrout P, Sun W. Placental growth patterns affect birth weight for given placental weight. Birth Defects Res Clin Mol Teratol. 2007;79(4):281-8.
4. Thomson AM, Billewicz WZ, Hytten FE. The weight of the placenta in relation to birthweight. J Obstet Gynaecol Br Commow. 1969;76(10):865-72.
5. Jauniaux E, Jurkovic D, Campbell S. In vivo investigations of anatomy and physiology of early human placental circulations. Ultrasound Obstet Gynecol. 1991;1(6):435-45.
6. Elchalal U, Ezra Y, Levi Y, Bar-Oz B, Yanai N, Intrator O, Nadjari M. Sonographically thick placenta: a marker for increased perinatal risk – a prospective cross-sectional study. Placenta. 2000;21(2-3):268-72. 7. Chen M, Leung KY, Lee CP, Tang MH, Ho PC. Placental volume
measured by three-dimensional ultrasound in the prediction of fetal alpha (0)-thalassemia: a preliminary report. Ultrasound Obstet Gynecol. 2006;28(2):166-72.
8. Hafner E, Metzenbauer M, Höinger D, Munkel M, Gassner R, Schuchter K, et al. Placental growth from the irst to the second trimester of pregnancy in SGA-foetuses and pre-eclamptic pregnancies compared to normal foetuses. Placenta. 2003;24(4):336-42. 9. Clapp JF 3rd, Rizk KH, Appleby-Wineberg SK, Crass JR.
Second-trimester placental volumes predicts birth weight at term. J Soc Gynecol Investig. 1995;2(1):19-22.
10. Kinare AS, Natekar AS, Chinchwadkar MC, Yajnik CS, Coyaji KJ, Fall CH, et al. Low midpregnancy placental volume in rural Indian women: a cause for low birth weight? Am J Obstet Gynecol. 2000;182(2):443-8.
11. Goldenberg RL, Cliver SP, Neggers Y, Copper RL, DuBard MD, Davis RO, et al. The relationship between maternal characteristics and fetal and neonatal anthropometric measurements in women delivering at term: a summary. Acta Obstet Gynecol Scand. 1997;165:8-13.
12. Hoddick WK, Mahony BS, Callen PW, Filly RA. Placental thickness. J Ultrasound Med. 1985;4(9):479-82.
13. Wolf H, Oosting H, Treffers PE. A longitudinal study of the relationship between placental fetal growth measured by ultrasonography. Am J Obstet Gynecol. 1989;161(5):1140-5.
14. Hafner E, Philipp T, Schuchter K, Dillinger-Paller B, Philipp K, Bauer P. Second-trimester measurements of placental volume by three-dimensional ultrasound to predict small-for-gestational-age infants. Ultrasound Obstet Gynecol. 1998;12(2):97-102. 15. Hoogland HJ, de Haan J, Martin CB Jr. Placental size during early
pregnancy and fetal outcome: a preliminary report of a sequential ultrasonographic study. Am J Obstet Gynecol. 1980;138(4):441-3. 16. Habib FA. Prediction of low birth weight infants from ultrasound
measurement of placental diameter and placental thickness. Ann Saudi Med. 2002;22(5-6):312-4.
17. Tongsong T, Boonyanurak P. Placental thickness in the irst half of pregnancy. J Clin Ultrasound. 2004;32(5):231-4.
18. Holroyd CR, Harvey NC, Crozier SR, Winder NR, Mahon PA, Ntani G, et al. Placental size at 19 weeks predicts offspring bone mass at birth: indings from the Southampton Women’s Survey. Placenta. 2012;33(8):623-9. doi:10.1016/j.placenta.2012.04.007.
19. Karthikeyan T, Subramaniam RK, Johnson W, Prabhu K. Placental thickness & its correlation to gestational age & foetal growth parameters – a cross sectional ultrasonographic study. J Clin Diagn Res. 2012;6(10):1732-5. DOI:10.7860/JCDR/2012/4867.2652. 20. Harris RD, Cho C, Wells WA. Sonography of the placenta with
emphasis on pathological correlation. Semin Ultrasound CT MR. 1996;17(1):66-89.
21. Cooley SM, Donnelly JC, Walsh T, McMahon C, Gillan J, Geary MP. The correlation of ultrasonographic placental architecture with placental histology in the low-risk primigravid population. J Perinat Med. 2013 Mar 21:1-5. DOI:10.1515/jpm-2013-0015. [Epub ahead of print]
22. Ohagwu CC, Abu PO, Ezeokeke UO, Ugwu AC. Relationship between placental thickness and growth parameters in normal Nigerian foetuses. Afr J Biotechnol. 2009;8(2):133-8.
23. Jauniaux E. Placental ultrasonographic measurement: what can we learn and is it worth doing routinely? Ultrasound Obstet Gynecol. 1992;2(4):241-2.
24. Dombrowski MP, Wolfe HM, Saleh A, Evans MI, O’Brien J. The sonographically thick placenta: a predictor of increased perinatal morbidity and mortality. Ultrasound Obstet Gynecol. 1992;2(4):252-5.
25. Raio L, Ghezzi F, Cromi A, Nelle M, Dürig P, Schneider H. The thick heterogeneous (jellylike) placenta: a strong predictor of adverse pregnancy outcome. Prenat Diagn. 2004;24(3):182-8. 26. Nordenvall M, Ullberg U, Laurin J, Lingman G, Sandstedt B,
Ulmsten U. Placental morphology in relation to umbilical artery blood velocity waveforms. Eur J Obstet Gynecol Reprod Biol. 1991;40(3):179-90.
27. Macara L, Kingdom JC, Kaufmann P, Kohnen G, Hair J, More IA, et al. Structural analysis of placental terminal villi from growth-restricted pregnancies with abnormal umbilical artery Doppler waveforms. Placenta. 1996;17(1):37-48.
28. Porat S, Fitzgerald B, Wright E, Keating S, Kingdom JC. Placental hyperinlation and the risk of adverse perinatal outcome. Ultrasound Obstet Gynecol. 2013 Jan 3. doi:10.1002/uog.12386. [Epub ahead of print]
29. Benirschke K, Kaufmann P. Pathology of human placenta. 4th ed. New York: Springer; 2000. Chapter 12: Anatomy and pathology of the umbilical cord and major foetal vessels; p. 335-98. 30. La Torre R, Nigro G, Mazzocco M, Best AM, Adler SP. Placental