Received 25 Jan 2015|Accepted 4 Mar 2015|Published 29 Apr 2015
Id1 suppresses anti-tumour immune responses
and promotes tumour progression by impairing
myeloid cell maturation
Marianna Papaspyridonos
1,*
,w, Irina Matei
1,*, Yujie Huang
1,3,*, Maria do Rosario Andre
1,4,
Helene Brazier-Mitouart
1, Janelle C. Waite
5, April S. Chan
1, Julie Kalter
5, Ilyssa Ramos
5, Qi Wu
5,
Caitlin Williams
1, Jedd D. Wolchok
6,7, Paul B. Chapman
8, Hector Peinado
1,9, Niroshana Anandasabapathy
10,
Allyson J. Ocean
11, Rosandra N. Kaplan
12, Jeffrey P. Greenfield
3, Jacqueline Bromberg
8,
Dimitris Skokos
5,* & David Lyden
1,13,*
A central mechanism of tumour progression and metastasis involves the generation of an immunosuppressive ‘macroenvironment’ mediated in part through tumour-secreted factors. Here we demonstrate that upregulation of the Inhibitor of Differentiation 1 (Id1), in response to tumour-derived factors, such as TGFb, is responsible for the switch from dendritic cell (DC) differentiation to myeloid-derived suppressor cell expansion during tumour progression. Genetic inactivation of Id1 largely corrects the myeloid imbalance, whereas Id1 overexpression in the absence of tumour-derived factors re-creates it. Id1 overexpression leads to systemic immunosuppression by downregulation of key molecules involved in DC differentiation and suppression of CD8 T-cell proliferation, thus promoting primary tumour growth and metastatic progression. Furthermore, advanced melanoma patients have increased plasma TGFb levels and express higher levels of ID1 in myeloid peripheral blood cells. This study reveals a critical role for Id1 in suppressing the anti-tumour immune response during tumour progression and metastasis.
DOI: 10.1038/ncomms7840 OPEN
A
pivotal mechanism of tumour outgrowth and progression to metastatic disease involves the ability of tumours to use a complex set of immunosuppressive mechanisms that prevent the immune system from mounting an efficientanti-tumour response1. Defective differentiation of bone marrow
(BM)-derived myeloid cells (BMDCs) occurring in response to circulating tumour-derived factors is thought to lie at the core of
this systemic tumour-induced immunosuppression1–3. Many
tumour-derived factors, including vascular endothelial growth factor (VEGF), interleukin-4 (IL-4), IL-6, IL-13 and transforming
growth factor beta (TGFb), regulate redundant pathways likely
related to myeloid cell differentiation4,5. In particular, these
factors prevent the terminal differentiation of BMDCs into fully functional antigen-presenting cells (APCs), such as dendritic cells
(DCs) and macrophages6,7. Instead, tumour-derived factors
redirect myeloid differentiation towards the accumulation and expansion of a heterogeneous population of immature myeloid
cells called myeloid-derived suppressor cells or MDSCs1,8,9.
DCs are the most potent APCs that are able to recognize, acquire, process and present antigens to naive, resting T cells for
the induction of an antigen-specific immune response10.
Increasing evidence shows that the main DC pathway affected in cancer patients is the myeloid DC pathway, particularly post
chemotherapy11. The consequences of decreased numbers of
functionally competent DCs in tumour-bearing hosts are clear: a
decline in APCs renders immunostimulation less effective6,7. In
contrast, an increase in MDSCs can have a profound
immunosuppressive effects through T-cell suppression3,5,12,13.
MDSCs use a variety of antigen-specific and non-specific immunosuppressive mechanisms to suppress T-cell function, including increased arginase activity levels as well as nitric oxide
and reactive oxygen species (ROS) production14–17. MDSCs have
been found to accumulate in the circulation, lymphoid organs,
primary and metastatic organs of most tumour models18, and in
patients with various types of cancers including renal, breast and
colorectal cancers19–21. MDSCs are thought to contribute towards
the limited effectiveness of cancer vaccines and other therapies,
such as anti-VEGF treatment4,5. However, it currently remains
unknown whether tumour-secreted factors drive an alternative developmental pathway that co-regulates the decline in DCs and expansion of MDSCs via the upregulation of common transcriptional regulators during tumour progression.
The Inhibitor of Differentiation 1 (Id1) is a member of a family of transcriptional regulators that prevent basic helix–loop–helix
transcription factors from binding DNA22,23. Increased Id1
protein expression in tumours has been shown to correlate with
both cancer progression and poor prognosis24,25. Furthermore,
Id1 regulates endothelial cell differentiation and fosters tumour
vasculogenesis26,27, promotes progression from micro- to
macro-metastatic disease28 via endothelial progenitor cell mobilization
and has been involved in myeloid development29–32. However,
Id1 has not been previously involved in regulating the crosstalk between tumours and the host immune system at a systemic level and promoting tumour progression and metastasis via the suppression of myeloid cell differentiation.
In this study, we identify Id1 as a novel pivotal regulator of the switch from DC differentiation to MDSC expansion during tumour progression. We demonstrate that upregulation of Id1,
primarily in response to tumour-derived TGFb, redirects BMDC
differentiation towards Id1-high expressing MDSCs with a reciprocal decrease in DC numbers. Id1 overexpression results in a systemic immunosuppressive phenotype that inhibits CD8 T-cell proliferation and increases primary tumour growth and metastatic progression. Our observations confirm and extend the promise of Id1 as a biomarker of cancer progression and as a therapeutic target in the management of advanced malignancies.
Results
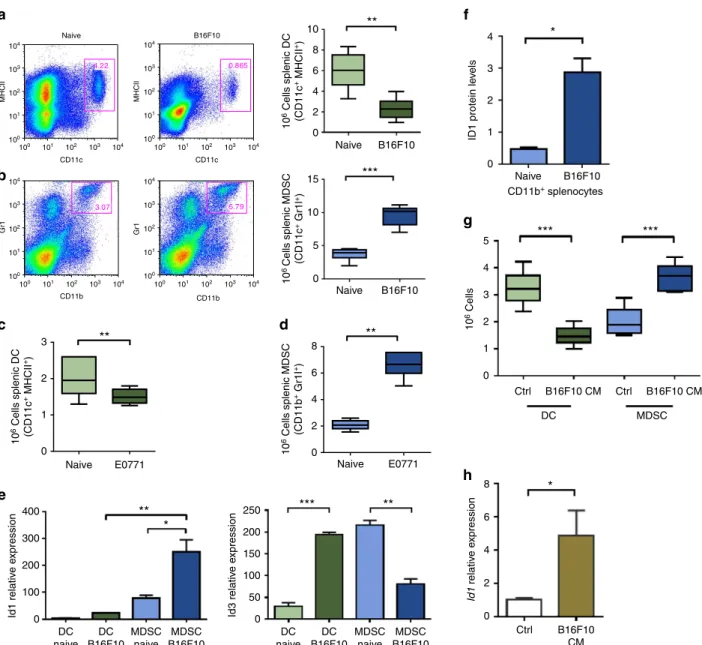
Tumour-secreted factors favourId1-high MDSC expansion. To assess differences in myeloid cell differentiation during tumour progression, we used the syngeneic B16F10 melanoma tumour model. Twenty-one days following inoculation of C57BL/6 mice with B16F10 melanoma cells (at the advanced metastatic stage), spleens were harvested and splenocytes were analysed by flow cytometry. We observed a decrease in the frequency and absolute
numbers of DCs, defined as CD11cþMHCIIþ cells, in B16F10
melanoma-bearing mice compared with non-tumour-bearing
mice (2.6-fold; Fig. 1a), with both CD8þ and CD8 DCs being
affected but preserved at equal ratios (Supplementary Fig. 1A). Conversely, we detected an increase in the frequency and absolute
numbers of MDSCs, defined as CD11bþGr1þ cells, in
tumour-bearing mice compared with controls (2.5-fold; Fig. 1b). Similar findings were observed in mouse spleens isolated 21 days after orthotopic implantation with the mammary adenocarcinoma E0771 cell line (Fig. 1c,d and Supplementary Fig. 1B,C).
As Id1 and Id3 upregulation in BM cells had been previously
implicated in tumour and metastatic progression27,28,33, we
sought to examine whether either of these transcriptional regulators were differentially expressed in DC and MDSC populations in tumour- versus non-tumour-bearing mice. Splenic DCs and MDSCs were isolated using
fluorescence-activated cell sorting (FACS), and Id1 and Id3 expression was
assessed by quantitative real-time PCR (qPCR) analysis. We found that DCs isolated from non-tumour mice expressed very
low to undetectable Id1, whereas Id1 expression was higher in
MDSCs from tumour-bearing mice compared with both control MDSCs (3.2-fold; Fig. 1e) and DCs from tumour-bearing mice
(11.2-fold; Fig. 1e). Similarly toId1,Id3expression was higher in
DCs from tumour-bearing mice compared to DCs from control
mice, however, Id3 expression levels in MDSCs from
tumour-bearing mice were significantly lower compared to MDSCs from non-tumour-bearing mice (Fig. 1e). We therefore focused our subsequent studies specifically on Id1.
We then assessed Id1 protein levels in lysates from CD11bþ
bead-sorted splenocytes isolated from naive or B16F10-bearing mice. The western blot and densitometric analyses revealed a 6.1-fold Id1 upregulation at the protein level in B16F10-bearing
CD11bþ splenocytes compared with controls (Fig. 1f and
Supplementary Fig. 1D). We also sought to examine whether Id1 expression is associated with a particular MDSC subtype— monocytic or granulocytic. Assessment of Id1 mRNA expression levels in FACS-sorted monocytic and granulocytic MDSC populations from spleens of naive and B16F10-bearing mice on days 7, 14 and 21 following implantation showed that increased Id1 expression is associated with both monocytic and granulo-cytic subsets, with increased levels in the monogranulo-cytic subset in the earlier phase of tumour growth and increased levels in the granulocytic subset in the advance metastatic stage (2.5-fold and 3.5-fold, respectively; Supplementary Fig. 1E).
Similar experiments were performed with DC and MDSC FACS-sorted splenic populations from the E0771 mammary
adenocarcinoma model, and the Id1 expression profile was
comparable to the one observed in the B16F10 model (Supplementary Fig. 1F).
As BM precursors give rise to all mature immune cells present
in secondary lymphoid organsin vivo, we developed anin vitro
model that mimics this differentiation process (BMDC assay). To determine whether differences in myeloid differentiation were due to circulating tumour-secreted factors, lineage negative
(Lin) haematopoietic progenitors were isolated from the BM
decrease in the absolute DC numbers that differentiated in the presence in TCM, compared with control media (2.2-fold; Fig. 1g). In contrast, an increase in absolute MDSC numbers was observed on day 6 of culture with TCM compared with control media (1.8-fold; Fig. 1g). Gene expression analysis after 6
days ofin vitrodifferentiation in B16F10 TCM revealed that Id1
mRNA expression levels were significantly higher in wild-type
(WT; Lin) cells differentiated in the presence of B16F10 TCM
compared with control media (4.9-fold; Fig. 1h). Experiments performed with E0771 TCM revealed a similar imbalance in DC versus MDSC frequencies concurrent with Id1 upregulation (Supplementary Fig. 1G).
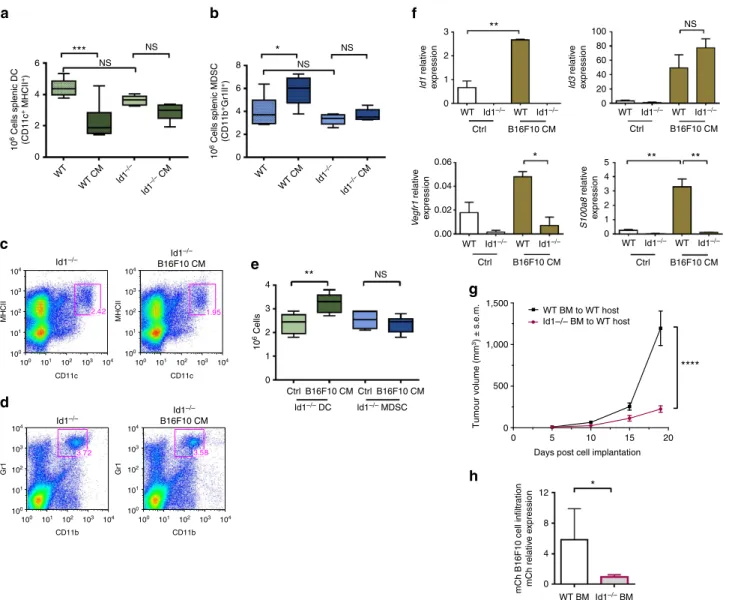
Id1 gene deletion restores myeloid differentiation defects. To assess whether Id1 is a direct regulator of MDSC and DC dif-ferentiation during tumour progression, we performed a series of
experiments using Id1/ mice. As Id1/ mice have
well-documented tumour angiogenic defects and abnormal tumour
growth27, we performed daily injections of B16F10 melanoma
TCM and control media over 21 days to systemically supply an
equal amount of tumour-derived factors in bothId1/and WT
control mice.
B16F10 TCM injections led to a significant reduction in splenic DCs in WT versus TCM-treated WT mice (1.9-fold; Fig. 2a) that was comparable to the DC population reduction observed in
CD11c 100
100
101
101
102
102
103
103 104
100 101 102 103 104 100 101 102 103 104
100 101 102 103 104
104
100
101
102
103
104
MHCII
100
101
102
103
104
100
101
102
103
104
MHCII
4.22
CD11c
0.865
CD11b
Gr1
5.79
CD11b
Gr1
3.07
Naive B16F10
Naive E0771 0
1 2 3
10
6 Cells splenic DC (CD11c + MHCII +)
**
Naive E0771 0
2 4 6 8
10
6 Cells splenic MDSC (CD11b + Gr1I +)
**
10
8
6
4
2
0
0 5 10 15
Naive
0 1 2 3 4
0 1 2 3 4 5
10
6 Cells splenic DC (CD11c + MHCII +)
10
6 Cells splenic MDSC (CD11c + Gr1l +)
ID1 protein le
vels
Id1 relativ
e e
xpression
Id3 relativ
e e
xpression
Id1
relativ
e e
xpression
10
6 Cells
B16F10
Naive B16F10
DC naive 0 100 200 300 400
0 50 100 150 200 250
8
6
4
2
0 DC
B16F10
MDSC B16F10 MDSC
naive
DC naive
DC B16F10
MDSC B16F10 MDSC
naive
Ctrl B16F10 CM
** **
* ***
*
Naive B16F10
**
*
***
CD11b+ splenocytes
DC MDSC Ctrl B16F10 CM Ctrl B16F10 CM
*** ***
Figure 1 | Tumour-secreted factors favour BMDC differentiation towards high Id1-expressing MDSCs but not DCs.Flow cytometry analysis of splenic
populations from B16F10 melanoma-implanted mice (day 21 post implantation). (a) Frequency and absolute numbers of DCs (unpairedt-test **Po0.01).
(b) Frequency and absolute numbers of MDSCs (unpairedt-test, ***Po0.001). Flow cytometry analysis of spleens from E0771 mammary
adenocarcinoma-implanted mice (day 21 post implantation) for (c) DC absolute numbers and (d) MDSC absolute numbers compared with control mice (unpairedt-test,
**Po0.01. (e) Id1 and Id3 mRNA levels in FACS-sorted splenic DC and MDSC populations, as determined by qPCR analysis, (n¼6, one-way analysis of
variance (ANOVA), *Po0.05, **Po0.01, ***Po0.001). (f) Id1 protein levels in lysates from naive and B16F10-bearing CD11bþbead-sorted splenocytes as
determined by western blot and densitometric analyses (unpairedt-test *Po0.01). (g)In vitrodifferentiation of Lin haematopoietic progenitors isolated
from C57BL/6 mice, cultured for 6 days in the presence of B16F10 melanoma TCM (25% v/v), and analysed for DC and MDSC content by flow cytometry
(n¼6, ANOVA, ***Po0.001). (h) Id1 mRNA relative expression levels of day 6 Lin cells differentiated in the presence B16F10-conditioned media
tumour-bearing hosts. A non-statistically significant reduction in
the DC population was detected in Id1/ mice injected with
TCM versus control media (1.16-fold; Fig. 2a,c). Likewise, similar to the splenic MDSC expansion observed in tumour-bearing hosts, WT mice injected with TCM exhibited an increase in MDSCs compared with naive mice (1.5-fold; Fig. 2b), with both monocytic and granulocytic populations equally affected across groups (Supplementary Fig. 2A,B), whereas no expansion in
MDSCs was seen with TCM injection inId1/mice (Fig. 2b,d).
In summary, genetic ablation ofId1largely restored terminal
myeloid differentiation, as daily injections of B16F10 TCM prevented the DC reduction and MDSC expansion that was observed in WT controls that also received daily injections
of B16F10 TCM. These data suggest that Id1 has a critical
role in mediating the myeloid differentiation defects caused by
tumour-derived factorsin vivoand support our previous findings
in steady-state Id1/ mice where we observed an increase in
terminal myeloid differentiation in the peripheral lymphoid organs and lower frequencies of common myeloid progenitors in
the BM of Id1/ mice23. To further assess any impact of Id1
genetic deletion on DC progenitors, we also measured the frequency of the earlier common DC progenitor and myeloid DC
progenitor populations in the BM ofId1/and WT littermates.
We found no difference in common DC progenitor frequencies between the two groups but a significant increase in the myeloid
DC progenitor frequency inId1/mice, indicating an increase
in dendritic myeloid differentiation with Id1 deletion
(Supplementary Fig. 2C).
To further validate the role of Id1 in impairing myeloid differentiation in response to tumour-derived factors, we used the
CD11c 104
104
103
103
102
102
101
101
100
104
103
102
101
100
104
103
102
101
100
100
104
103
102
101
100 100 101 102 103 104
104
103
102
101
100
MHCII
104
103
102
101
100
MHCII
2.42
CD11c
1.95
CD11b
Gr1
3.72
CD11b
Gr1
3.58
Id1–/–
Id1–/–
Id1–/–
B16F10 CM Id1–/–
B16F10 CM 6
6 8 ***
** *
**
* ** **
NS
NS
NS NS
NS NS
0
0.06 5
4 3 2 1 0 0.04
0.02
0.00 Ctrl
WT Id1–/– WT Id1–/–
B16F10 CM Ctrl
WT Id1–/– WT Id1–/–
B16F10 CM
Ctrl
WT Id1–/– WT Id1–/–
B16F10 CM Ctrl
WT Id1–/– WT Id1–/–
B16F10 CM 1
2
3 100
80 60 40 20 0 4
4 2
2
10
6 Cells splenic DC (CD11c + MHCII +)
10
6 Cells
10
6 Cells splenic MDSC (CD11b +Gr1lI +)
mCh B16F10 cell infiltr
ation
mCh relativ
e e
xpression
ld1
relativ
e
e
xpression
V
egfr1
relativ
e
e
xpression
S100a8
relativ
e
e
xpression
ld3
relativ
e
e
xpression
0 0
4
3
2
1
0
CtrlB16F10 CMCtrlB16F10 CM ld1–/– DC ld1–/– MDSC
12
8
4
0
WT BM Id1–/– BM
*
WT
WT CM Id1
–/–
Id1
–/– CM WT
WT CM Id1
–/–
Id1
–/– CM
0 5 10 15 20
0 500 1,000 1,500
WT BM to WT host Id1–/– BM to WT host
Days post cell implantation
Tumour volume (mm
3) ± s.e.m.
****
Figure 2 | Deletion of the Id1 gene restores myeloid differentiation defects.Flow cytometry analysis of spleens from WT andId1/mice that received
daily injections of B16F10 melanoma-derived conditioned media (B16F10 CM) or control media for (a) absolute numbers of DCs (one-way analysis of
variance (ANOVA), ***Po0.001) and (b) absolute numbers of MDSC levels (one-way ANOVA, *Po0.05). (c) Representative frequency plots of DCs and
(d) Splenic MDSCs isolated fromId1/ mice injected daily with B16F10 melanoma-derived TCM or control media. (e)In vitrodifferentiation of
Lin haematopoietic progenitors isolated fromId1/mice, cultured for 6 days in the presence of B16F10 melanoma TCM (25% v/v) and analysed for
DC and MDSC content by flow cytometry (n¼6, ANOVA,**Po0.01). (f) Gene expression analysis ofId1/ and WT cells after 6 days ofin vitro
differentiation in the presence of TCM, as determined by qPCR analysis (means±s.e.m.,n¼6, one-way ANOVA,**Po0.01, *Po0.05). (g) Analysis of
primary tumour volume fromId1/and control BM chimeric mice following implantation of B16F10 melanoma cells (two-way ANOVA, ****Po0.0001).
(h) Relative quantification of mCherry-labelled B16F10 melanoma cells in cryosections of lungs ofId1/ and control BM chimeric mice measured by
BMDC assay using Id1/ cells. In contrast to the results obtained with WT cells, we detected a significant increase in
Id1/ DC numbers when BM progenitors were cultured in the
presence of B16F10 melanoma TCM (1.4-fold; Fig. 2e) and no significant difference in MDSC numbers compared with
con-trolled media cultures ofId1/ cells, indicating that Id1 has a
causal role in the myeloid differentiation impairment observed in
the presence of tumour-derived factors bothin vitroandin vivo.
Gene expression analysis after 6 days ofin vitrodifferentiation
in B16F10 TCM revealed that the upregulation of S100a8 and
Vegfr1—two established markers of immature myeloid status— 16,33–35was abrogated inId1/ Lincells compared with WT
cells (Fig. 2f). This suggested that in the absence ofId1,myeloid
maturation is promoted.Id3 expression levels were not found to
be significantly different between WT andId1/ cells cultured
with TCM (Fig. 2f), excluding any potential compensatory mechanisms by Id3.
To further investigate the role of Id1 in primary tumour and
metastatic progression, we transplanted Lin BM cells from
Id1/ or WT BM into lethally irradiated WT recipients to
generate BM chimeric mice. Eight weeks following BM
transplantation, Id1/ and control BM chimeric mice were
inoculated with mCherry-labelled B16F10 melanoma cells. Tumours from WT control chimeric mice showed a significant
increase in volume compared withId1/ BM chimeric mice at
end point (day 19, 5.3-fold; Fig. 2g).
As B16F10 melanoma cells are known to metastasize to the
lungs33,35, lungs from Id1/ and control BM chimeric mice
were analysed for metastatic tumour burden by qPCR quantification of mCherry-labelled B16F10 melanoma cells. Lungs of WT control chimeric mice had a 6-fold increase in
metastatic tumour cells compared with the lungs ofId1/ BM
chimeric mice (Fig. 2h). These data further demonstrate a critical role for Id1-expressing BMDC in tumour and metastatic progression.
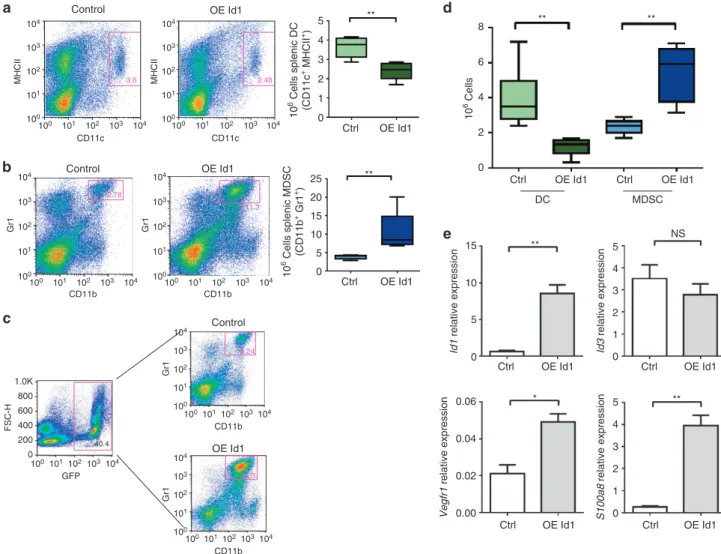
Id1overexpression induces MDSC accumulation. To determine whether Id1 is indeed responsible for the development and accumulation of MDSCs in response to tumour-secreted factors,
we transplanted lethally irradiated WT recipient mice with Lin
BM cells from WT donor mice transduced with lentiviral vectors
Control
CD11c 3.6
2.78
11.3
8.24
34.3 100
101 102 103 104
100 101 102 103 104
CD11b 100 101 102 103 104
GFP
FSC-H
100101102103104
CD11b 100101102103104
CD11b
Gr1
100 100
101 101
102 102
103 103
104 104
Gr1
100 101 102 103 104 0
200 400 600 800 1.0K
CD11b 100 101 102 103 104
CD11c 100 101 102 103 104 100
101 102 103 104
2.48
Control
OE Id1
OE Id1
Control
OE Id1 40.4
5
4
3
2
1
0 Ctrl
Ctrl
Ctrl
25 **
20
15
10
5
0
OE Id1
OE Id1
OE Id1
Ctrl OE Id1
Ctrl OE Id1
Ctrl OE Id1
10
6 Cells 8
6
4
2
0
Ctrl OE Id1 Ctrl OE Id1
MDSC
Id3
relative expression
Id1
relative expression
Vegfr1
relative expression
S100a8
relative expression
NS **
** *
5
4
3
2
1
0
5
4
3
2
1
0 5
15
10
0
0.00 0.02 0.04 0.06
DC **
10
6 Cells splenic DC (CD11c + MHCII +)
10
6 Cells splenic MDSC
(CD11b
+ Gr1 +)
** **
MHCII
100 101 102 103 104
Gr1
100 101 102 103 104
Gr1
MHCII
Figure 3 |Id1overexpression induces a DC/MDSC imbalance.Flow cytometry analysis of spleens from mice transplanted with Id1-overexpressing and
control vector-transduced LinBM cells for (a) frequency and absolute numbers of DCs and (b) MDSCs (unpairedt-test,**Po0.01). (c) Representative
percentages of MDSCs in GFP-positive splenocytes from mice transplanted with Id1-overexpressing Lincells and control vector splenocytes. (d)In vitro
differentiation of Lin haematopoietic progenitors from C57BL/6 mice transduced with lentiviral or control and Id1-overexpressing vectors overnight,
cultured for 6 days and analysed for DC and MDSC content by flow cytometry (n¼6, analysis of variance,**Po0.01). (e) Gene expression analysis of Lin
cells transduced with Id1-overexpressing and control vectors after 6 days ofin vitrodifferentiation by qPCR analysis (means±s.e.m.,n¼6, unpairedt-test,
overexpressingId1(OE Id1) or control vectors (ctrl). Both vectors also encoded for green fluorescent protein (GFP) to track trans-duced cells. Six to eight weeks after transplantation, the BM of recipient mice was reconstituted at a comparable reconstitution rate in both groups and over 90% of all cells in peripheral blood were positive for GFP.
Spleens from Id1-overexpressing and control vector mice were analysed 8 weeks post transplantation by flow cytometry for DC and MDSC levels. We found that, similar to defects seen in tumour-bearing mice, Id1-overexpressing mice exhibited a decrease in splenic DCs (1.5-fold; Fig. 3a) and an increase in MDSCs (2.7-fold; Fig. 3b) compared with control vector mice, with both granulocytic and monocytic populations being equally affected (Supplementary Fig. 3A,B). When assessing the percentage of MDSCs in GFP-positive splenocytes, we observed
that 37.3% (±8.43%) of GFP-positive Id1-overexpressing cells
were CD11bþGr1þ compared with 8.14% (±2.43%) in
GFP-positive control vector cells (Fig. 3c), confirming our hypothesis that Id1 expression favours BMDC differentiation towards MDSCs. These data also extend our previous observations in Id1-overexpressing mice, where we observed an increase in
common myeloid progenitor frequency in the BM23.
To investigate the mechanisms by which Id1 impairs terminal myeloid differentiation, we performed the BMDC assay with WT cells transduced with lentiviral vectors overexpressing Id1 or control GFP only. After 6 days in culture, we observed a DC-MDSC imbalance similar to the one observed in cultures with TCM, with a significant increase in MDSC numbers at the expense of DC numbers in Id1-overexpressing mice (4.0 and
2.1-fold, respectively; Fig. 3d). Gene expression analysis of Lin
cells transduced with Id1-overexpressing or control vectors
after 6 days ofin vitrodifferentiation showed a marked increase
inVegfr1andS100a8expression in Id1-overexpressing Lincells compared with control cells (Fig. 3e), suggesting that Id1-overexpressing cells had a more immature phenotype than vector control cells.
Id1-overexpressing MDSCs induce T-cell suppression. To determine the consequences of BMDC Id1 overexpression on other measures of systemic immune function, we examined levels of regulatory T cells (T-regs), a group of highly immuno-suppressive cells that have been previously described to expand
in response to MDSCs36,37. Using flow cytometry analysis,
we found that CD4þCD25þFoxp3þ T-reg absolute numbers
were significantly increased among splenocytes of
Id1-overexpressing compared with control vector mice (1.6-fold; Fig. 4a), supporting and extending our findings of an immunosuppressive role for Id1.
As MDSCs can exert their immunosuppressive effects via both antigen-specific and antigen-independent effects, we measured ROS production, thought to be one of the main
non-antigen-specific MDSC-mediated immunosuppressive mechanisms38, in
Id1-overexpressing splenocytes by flow cytometry. Measurements of fluorescence levels of dichlorofluorescein, a ROS-sensitive dye, indicated that splenocytes from Id1-overexpressing mice produce significantly higher levels of ROS than control vector splenocytes
(1.7-fold; Fig. 4b), suggesting that non-antigen-specific
mechanisms are also involved in the immunosuppressive phenotype that is generated by Id1 overexpression.
***
***
40
** * 8,000 *
6,000
4,000
2,000
0
2,000
1,500
1,000
0
Ctrl OE Id1 + OT-II T-cells
IL-10 (pg ml
–1
)
500 Ctrl
+ OT-II T-cells OE Id1
IFN
γ
(pg ml
–1
)
30
20
10
0
80
60
40
20
0
Ctrl OE Id1 MDSC:
OT-I peptide OT-I T-cells
– –
– + + +
+ + + Ctrl OE Id1
+ 6
4
2
0
80
60
40
20
0
Ctrl OE Id1
DCF
mean fluorescence intensity
10
6 Cells splenic T-regs (CD4 +CD25 + foxp3 +)
IFN
γ
+ CFSE
lo
w OT-I
T cells (%)
IFN
γ
+ CFSE
lo
w OT-I
T cell suppression (%)
Ctrl OE Id1
Figure 4 | Id1 overexpression leads to an immunosuppressive phenotype and T-cell suppression.Flow cytometry analysis of spleens from mice
transplanted with Id1-overexpressing and control vector-transduced Lin BM cells for (a) absolute numbers of regulatory T cells (T-regs;
CD4þCD25þFoxp3þ; unpairedt-test,***Po0.001), for (b) ROS production, as determined by mean fluorescence intensity levels of dichlorofluorescein
(DCF), a ROS-sensitive dye (unpairedt-test,***Po0.001). (c) CD8þantigen-specific T-cell proliferation functional assessment of GFPþ CD11bþGr1þ
splenocytes from Id1-overexpressing and control vector animals co-cultured with OT-I splenocytes in the presence of OVA257–264peptide. (analysis of
variance,**Po0.01, *Po0.05). (d) OT-I T-cell proliferation expressed as suppression induced by GFPþ CD11bþ Gr1þ splenocytes from
Id1-overexpressing and control vector animals, relative to the no MDSC control wells. Data expressed as percentage T-cell suppression compared with no
MDSC control (unpairedt-test, *Po0.05). (e) Analysis of splenocytes from Id1-overexpressing mice and OT-II CD4þT-cell co-cultures in the presence of
OVA323–329peptide for IFNglevels (unpairedt-test, *Po0.05) and (f) IL-10 levels compared with splenocytes from control vector-treated mice and OT-II
Next, we assessed antigen-specific immunosuppressive effects of Id1 overexpression on T-cell function using OVA
antigen-specific T-cell co-culture models. Equal numbers of GFPþ
CD11bþGr1þ cells isolated by FACS from Id1-overexpressing
and control vector splenocytes were co-cultured in the presence
of OVA257–264 peptide with Carboxyfluorescein succinimidyl
ester (CFSE) stained OT-I splenocytes for 4 days. Quantification
of proliferating (CFSElow) and activated (IFNgþ) CD8þ
antigen-specific OT-I T cells showed a significant increase in T-cell
proliferation in cultures with no CD11bþGr1þor control vector
CD11bþGr1þ, but not with Id1-overexpressing CD11bþGr1þ
cells compared with control T-cell wells (no peptide; Fig. 4c). We observed a significant increase in T-cell suppression by
Id1-overexpressing CD11bþGr1þ cells compared with control
vector (67.3 versus 5.3%; Fig. 4d). Furthermore, Th1/Th2 cytokine production analysis of conditioned media of splenocytes from Id1-overexpressing and control vector animals co-cultured
in the presence of OVA323–339 peptide, and CD4þ OT-II cells
showed a marked decrease in interferon-g(IFNg) levels (5.3-fold;
Fig. 4e) and a significant increase in IL-10 levels (1.9-fold; Fig. 4f). Both assays indicate that Id1-overexpressing splenocytes and
CD11bþGr1þ cells, in particular, were able to directly suppress
effector T-cell proliferation and activation, and promote a tolerogenic T-cell phenotype.
Id1-overexpressing BMDCs promote tumour growth. To determine whether the functional effects exerted by Id1 over-expression can alter tumour progression, 8 weeks following BM
transplantation, Id1-overexpressing and control mice were inoculated with mCherry-labelled and non-labelled B16F10 melanoma cells. Tumour volume was measured during the model progression until day 21. Tumours from Id1-overexpressing mice had a significant increase in volume compared with control vector mice on day 21 (2.2-fold; Fig. 5a). Quantification of vessels by
platelet/endothelial cell adhesion molecule-1 (PECAM-1þ)
staining and BMDC infiltration by GFPþ cell quantification on
B16F10 tumour sections showed no statistically significant dif-ference in vascularization or BMDC infiltration in the primary tumour of control mice compared with Id1-overexpressing mice implanted with B16F10 melanoma (Supplementary Fig. 4A,B).
Lungs from Id1-overexpressing and control vector-trans-planted mice were analysed for metastatic tumour burden by quantification of mCherry-labelled B16F10 melanoma cells. Lungs of Id1-overexpressing mice had a 13-fold increase in metastatic tumour cells compared with the lungs of control vector-transplanted mice (Fig. 5b). Id1-overexpressing mice harboured significantly higher numbers of both micro- and macrometastatic lesions compared with vector-transplanted mice (Fig. 5c,d).
When we assessed the immune function of Id1-overexpressing tumour-bearing mice, we found similar DC numbers but
significantly elevated MDSC (Po0.01), T-reg numbers
(Po0.001) and ROS production (Fig. 5e–h respectively) compared
with control vector tumour-bearing mice. These findings demonstrate that Id1 overexpression in haematopoietic cells is associated with an immunosuppressive phenotype and signifi-cantly increased primary tumour growth and metastatic burden.
1,500
Ctrl B16F10 OE Id1 B16F10
1,000
500
5,000 *
4,000
3,000 2,000
1,000
0 Ctrl B16F10
Ctrl B16F10
OE Id1 B16F10
OE Id1 B16F10
Ctrl B16F10 OE Id1 B16F10
NS 5
25 20 15 10 5 0
** **
90 10
8 6 4 2 0
10
6 Cells splenic T-regs (CD4 +CD25 + foxp3 +)
80
70
60
50
DCF mean
fluorescence intensity
*
10
6 Cells splenic MDSC (CD11b + Gr1 +)
10
6 Cells splenic DC
(CD11b
+ MHCII +)
mCh B16F10 cell infiltation
pixels per field (×200)
Tumour volume (mm
3)
±
s.e.m.
4 3 2 1 0
Ctrl B16F10
OE Id1 B16F10
Ctrl B16F10
OE Id1 B16F10
Ctrl B16F10
OE Id1 B16F10
Ctrl B16F10
OE Id1 B16F10 0
0 5 10 15 20 25
****
Days post cell implantation
Figure 5 | Id1-overexpressing BMDCs promote tumour growth and metastatic progression.(a) Analysis of primary tumour volume from
Id1-overexpressing mice and control vector mice following implantation of B16F10 melanoma cells (two-way analysis of variance,****Po0.0001). (b)
Quantification of mCherry-labelled B16F10 melanoma cells in cryosections of lungs of BM Id1-overexpressing mice and control vector mice measured as red
pixels per field (unpairedt-test, *Po0.05). (c) Macro- and (d) micrometastatic lesion formation in lungs from Id1-overexpressing mice and control vector
mice; scale bar (50mm) on top left panel applies to all panels. Flow cytometry analysis of splenocytes from BM Id1-overexpressing and control vector mice
implanted with B16F10 melanoma cells for absolute numbers of (e) DCs (f) MDSCs (g) regulatory T cell (T-regs) and (h) ROS production (unpairedt-tests;
Id1 is upregulated via TGFb and downregulates Irf8. To identify upstream regulators of Id1 and downstream pathways
affected by Id1 overexpression, we performed gene expression
profiling of Id1-overexpressing and control BMDCs using Affy-metrix GeneChip arrays. Microarray data are available in the
ArrayExpress database (www.ebi.ac.uk/arrayexpress) under
accession number E-MTAB-2280. Pathway analysis of the differ-entially expressed genes using Ingenuity Pathway Analysis
soft-ware identified TGFband IL-6 among the top predicted upstream
regulators of Id1 overexpression-induced gene expression changes
(Pvalue: 6.381029and 2.981021, respectively).
To confirm that TGFband IL-6 were able to upregulateId1in
a relevant cell system, we tested these molecules as well as a series of candidate tumour-secreted factors previously implicated in
MDSC expansion or Id1 upregulation1,39–42in the BMDC assay.
We observed that culture with TGFb, and to a lesser extent IL-6
and Bone morphogenetic protein-7 (BMP-7), led to Id1 upregulation in BMDCs (6.5-, 1.9- and 2.4-fold respectively; Fig. 6a), confirming the two upstream pathway predictions of the
microarray data analysis.Id1mRNA expression levels were found
to be significantly higher in Lin cells differentiated in the
presence of B16F10 TCM compared with control media (4.9-fold;
Fig. 6b), whereas neutralization of TGFbin B16F10 TCM largely
prevented the upregulation of Id1 by BMDCs (Fig. 6b). To
determine whether these factors induce Id1 expression in their
soluble form or packaged in exosomes43, we quantified Id1
expression in the presence of B16F10 soluble factors with and without exosomes, as well as B16F10 exosomes alone. We
observed that Id1 was upregulated by soluble factors but not
exosomes (Supplementary Fig. 5A). We therefore concluded that
soluble B16F10-derived factors induce Id1 upregulation in
MDSCs predominantly via a TGFb-dependent mechanism.
Pathway analysis of the differentially expressed genes using IPA software identified the DC maturation pathway as one of the canonical pathways most significantly affected by Id1
over-expression (Pvalue: 1.69103; Supplementary Fig. 5B). Several
key genes involved in DC maturation were found to be
downregulated following Id1 overexpression, including Cd83,
Cd86,MHCII (HLA-DQA1andHLA-DRB1),Fscn1,Stat4andIrf8 (Icsbp)(Supplementary Table 1).
Irf8 was of particular interest since it is a transcription factor
that has been recently shown to restrict the generation of Gr1þ
granulocytic populations such as neutrophils and MDSCs44, and
to be responsible for initiating DC lineage commitment45. To
further investigate the relationship between If8 and Id1 and determine whether Irf8 is a downstream mediator of Id1 function,
we used the BMDC assay to assess the expression ofIrf8in WT
and Id1/ BMDCs in response to TGFb and B16F10 TCM
compared with control media. We observed a significant
downregulation of Irf8 expression in WT BMDCs in response
to TGFb and B16F10 TCM (1.6- and 1.5-fold respectively;
Fig. 6c), an effect that was abrogated inId1/ BMDCs treated
with TGFb or B16F10 TCM (Fig. 6d). Furthermore,
neutralization of TGFb in B16F10 TCM significantly reversed
the downregulation of Irf8 by BMDCs (Fig. 6c). We therefore
concluded that B16F10 TCM induces Irf8 downregulation in
8
6
4
* **
****
*** **
Id1
relative expression 2
0
8
6
4
Id1
relative expression 2
0
NS 1.0
1.0
1.5 ****
**** ***
NS
0.5 0.5
0.0 0.0
Irf8
relative expression - Id1
–/–
BMDC
Irf8
relative expression - WT BMDC
NS
NS NS
Ctrl B16F10 CM
B16F10 CM isotype
B16F10 CM anti-TGFβ
Ctrl B16F10
CM isotype B16F10
CM anti-TGFβ B16F10
CM TGFβ
Ctrl B16F10
CM isotype B16F10
CM anti-TGFβ B16F10
CM TGFβ
Ctrl VEGF IL-6 BMP-7 BMP-9 BMP-10 TGFβ
Figure 6 | Id1 is upregulated via a TGFb-dependent mechanism and downregulates key genes involved in DC maturation.(a) Id1 mRNA relative
expression levels in day 6 Lin cells differentiated in the presence of 100 ngml1of murine recombinant proteins (VEGF, IL-6, BMP-7, -9 and -10, and
TGFbcompared with Lin cells differentiated in control media, as determined by qPCR analysis (means±s.e.m.,n¼6, analysis of variance (ANOVA),
****Po0.0001,**Po0.01, *Po0.05). (b) Id1 mRNA expression levels in day 6 Lin cells differentiated in the presence of B16F10 CM (abbreviation
introduced in Fig 2) alone, with anti-TGFband anti-IgG compared with control media, as determined by qPCR analysis (means±s.e.m.,n¼6, ANOVA,
***Po0.001,**Po0.01). (c) Irf8 mRNA relative expression levels of day 6 WT Lincells differentiated in the presence of 100 ngml1of TGFb, B16F10 CM
alone, with anti-TGFband anti-IgG compared with control media, as determined by qPCR analysis (means±s.e.m.,n¼6, ANOVA, ****Po0.0001,
***Po0.001). (d) Irf8 mRNA relative expression levels of day 6Id1/Lincells differentiated in the presence of 100 ngml1of TGFb, B16F10 CM alone,
with anti-TGFband anti-IgG compared with control media, as determined by qPCR analysis (means±s.e.m.,n¼6, ANOVA; NS, not significant). Four
BMDCs via a TGFb- and Id1-dependent mechanism. To identify the specific cell population that is primarily responsible
for the TGFb-mediated Id1 upregulation and Irf8 downregulation
we observed in the BMDC assay and confirm whether these changes are occurring per cell or reflect overall cell population changes, we isolated DCs and MDSCs using FACS and
assessed Id1 and Irf8 expression by qPCR analysis. We found
that Lin cells cultured in the presence of recombinant
TGFbgenerate MDSCs expressing higher Id1 mRNA levels per
cell (6.2-fold; Supplementary Fig. 5C) and DCs expressing lower Irf8 levels per cell compared with respective populations in control media cultures (5.9-fold; Supplementary Fig. 5D), confirming the inverse relationship of Id1 and Irf8 in specific isolated populations.
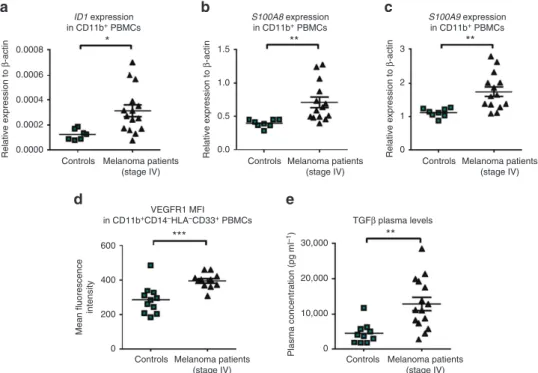
Elevated ID1 levels in cancer patient CD11Bþ PBMC. The frequency and numbers of MDSCs are increased in blood samples from most cancer patients including renal, breast and prostate
cancer, as well as melanoma patients46–49. To establish the
translational significance of ourin vivoandin vitrofindings, we
measured the mRNA expression ofID1in CD11Bþcells isolated
using magnetic beads from PBMC of patients with advanced
melanoma (stage IV) and healthy age-matched controls. ID1
expression was found to be on average 2.5-fold higher (and up to
5.4-fold higher) in CD11Bþ PBMCs from patients with
metastatic melanoma (n¼15) compared with healthy,
age-matched controls (n¼7, unpaired t-test, Po0.05; Fig. 7a).
Furthermore,ID1, but notID3expression, was also found to be
on average threefold higher (and up to ninefold higher) in
PBMCs from patients with metastatic breast cancer (n¼7) and
colorectal cancer (n¼6) compared with healthy, age-matched
controls (n¼10, Mann–Whitney test; Po0.01; Supplementary
Fig. 6A,B).
Increased expression of the two downstream regulators of ID1, S100A8 and S100A9 levels was also observed (1.8- and 1.7-fold
higher and up to 3.1- and 2.7-fold, respectively) in CD11Bþ
PBMCs from patients with metastatic melanoma compared with
healthy, age-matched controls (unpaired t-test, Po0.01;
Fig. 7b,c). Flow cytometric analysis of VEGFR1 in the MDSC
fraction of CD11Bþ cells (defined as CD11Bþ CD14 HLA
CD33þ) also revealed elevated protein levels in stage IV
melanoma patients compared with controls (unpaired t-test,
Po0.001; Fig. 7d). Finally, we measured TGFblevels in plasma
samples from the same stage IV melanoma patients and observed a significant increase compared with controls (2.8-fold, unpaired
t-test,Po0.01; Fig. 7e). Collectively, these data validate our
pre-clinical observations in pre-clinical samples of individuals with advanced malignancies.
Discussion
Our study demonstrates a novel central role for Id1 in diverting normal myeloid cell differentiation from its intrinsic pathway of terminal differentiation to mature cells such as DCs towards a pathway that generates pathologically activated immature cells
known as MDSCs1,9,57–59 during tumour progression. We
demonstrate that Id1 upregulation is responsible for generating an immunosuppressive macroenvironment and driving tumour progression. We also demonstrate that Id1 overexpression specifically by MDSCs can directly suppress T-cell function. We
identify TGFband IL-6 among the main tumour-derived factors
responsible for Id1 upregulation in BMDCs, and demonstrate
that Id1 and its upstream (TGFb), as well as downstream
mediators (S100A8/9 and VEGFR1) are significantly upregulated in advanced metastatic melanoma patients, confirming the translational value of our pre-clinical findings. In light of our results, we propose the use of Id1 and its mediators as biomarkers
0.0008 * 1.5 3 **
2
1
0 1.0
0.5
0.0
**
ID1 expression in CD11b+ PBMCs
S100A8 expression
in CD11b+ PBMCs
S100A9 expression
in CD11b+ PBMCs
0.0006
Relative expression to
β
-actin
Relative expression to
β
-actin
Relative expression to
β
-actin
0.0004
0.0002
0.0000
600
Mean fluorescence
intensity
400
***
30,000
TGFβ plasma levels
**
20,000
10,000
0
Plasma concentration (pg ml
–1)
200
0
Controls Melanoma patients (stage IV)
VEGFR1 MFI in CD11b+CD14–HLA–CD33+ PBMCs
Controls Melanoma patients (stage IV)
Controls Melanoma patients (stage IV) Controls Melanoma patients
(stage IV)
Controls Melanoma patients (stage IV)
Figure 7 | Advanced stage melanoma patients express higher levels of Id1 in the CD11Bþ PBMC fraction and have elevated plasma TGFblevels.
(a) qPCR analysis of ID1 (unpairedt-test, *Po0.05), (b)S100A8(unpairedt-test, **Po0.01) and (c)S100A9(unpairedt-test, **Po0.01) mRNA
expression levels following isolation of CD11Bþ PBMCs from metastatic melanoma patient blood samples (n¼15) compared with healthy matched
controls (n¼7). (d) VEGFR1 mean fluorescence intensity levels in CD11BþCD14HLACD33þ cells PBMCs from metastatic melanoma patient blood
samples compared with healthy matched controls, determined by flow cytometry (unpairedt-test, ***Po0.001). (e) TGFbplasma levels from metastatic
of systemic immune dysfunction during tumour progression as well as candidates for targeted anti-tumour therapeutic strategies.
Cancer is often considered to be a reflection of ‘embryonic
memory’.Idgenes are important in both embryonic neurogenesis
and myocardial development50, and also regulate the self-renewal
capacity of cancer-initiating cells51.Id1expression, in particular,
correlates with both cancer progression and poor prognosis24,25.
Prior studies have demonstrated a role for Id1 in endothelial cell
differentiation and tumour vasculogenesis26,27, and progression
from micro- to macrometastatic disease28 via endothelial
progenitor cell mobilization. This is the first study to implicate Id1 in the crosstalk between tumours and the host immune system via regulation of myeloid cell differentiation.
Tumours release multiple factors that perturb the myeloid
compartment1,2,43. These include VEGF, IL-4, IL-6, IL-10, IL-13,
Macrophage colony-stimulating factor (M-CSF) and TGFb,
which regulate likely redundant pathways mediating the maturation and expansion of MDSCs at the expense of DC
differentiation1,4,13,52 via transcription factors such as the signal
transducer and activator of transcription 3 (STAT3) and CCAAT/
enhancer-binding protein-a13,53. Hence, here we examined
several tumour-derived factors that have been
impli-cated either in MDSC expansion or Id1 upregulation1,39,40,42
in addition to factors that we identified as predicted upstream
regulators of Id1-induced gene changes, and we identified TGFb
as one of the main tumour-derived factors responsible for Id1
upregulation in MDSCs. The link between TGFband Id1 appears
to be context dependent41,42,54–56. Here, we show that in the
case of BMDCs, TGFb is the primary tumour-derived factor
responsible for Id1 upregulation, as its neutralization largely
abrogates Id1 expression in vitro. More importantly, we
demonstrate that in melanoma patients, plasma levels of
TGFb and myeloid PBMC Id1 levels are both significantly
upregulated.
Id1 has been shown to induceS100a8/9andVegfr1expression,
which have been previously associated with an immature myeloid phenotype. Specifically, the calcium-binding pro-inflammatory proteins S100A8 and S100A9 are thought to have key roles in
myeloid differentiation and MDSC57 expansion, whereas
VEGFR1 is a marker of immature myeloid cells33. These
findings are also consistent with reports that VEGFR1þ cells
may have impaired function in Id-mutant mice27 and that
Id1/DCs are not responsive to VEGF treatment via VEGFR1
(ref. 58). These findings support our previous observation that increases in VEGFR1 and Id expression occur in BMDCs and are
largely responsible for driving the metastatic process33.
The transcriptional program driving MDSC development and expansion is poorly understood, partly due to the
hetero-geneity of MDSC subsets18,59. This study identifies Id1 as a new
master transcriptional regulator of myeloid differentiation. Transcriptome analysis of Id1-overexpressing BMDCs revealed the downregulation of several genes thought to play a key role in DC maturation, such as those encoding the co-stimulatory
molecules Cd83 and Cd86,and Irf8, a transcription factor that
controls DC lineage commitment45. Importantly, we demonstrate
an inverse relationship and co-regulation between Id1 and Irf8. Humans with IRF8 mutations have a severe DC
immuno-deficiency syndrome60, whereas in murine studies Irf8 has been
shown to impair the generation of Gr1þ granulocytic
populations such as neutrophils and MDSCs, and to promote
DC expansion and commitment44,61. Moreover,Irf8expression is
decreased in MDSCs from tumour-bearing hosts and its
overexpression leads to decreased MDSC levels62, suggesting
that Irf8 is an important regulator of MDSC expansion during tumour progression. Our study provides novel insights into the
molecular pathways that link the inhibition of DC maturation and MDSC expansion, identifying a previously unknown inverse relationship between Id1 and Irf8.
When examining the functional outcomes of systemic Id1-induced tumour immunosuppression, we identified both antigen non-specific and specific mechanisms by which Id1-expressing MDSCs exert their immunosuppressive effects. First, the increase in total ROS levels following Id1 overexpression comes in agreement with studies, demonstrating that ROS are major factors in the inhibition of DC differentiation and MDSC
expansion in tumour-bearing mice38,63. As VEGFR1 expression
is also thought to be regulated by oxidative stress16, these findings
provide a mechanistic link between increased ROS and induced upregulation of VEGFR1, and identify Id1 as the molecular link between the two phenomena. Second, another key mechanism of MDSC-induced immunosuppression is the activation and
expansion of T-regs37,64. Although these mechanisms are not
completely understood, they are thought to involve cell-to-cell
contact65and the production of cytokines, such as IFNg, IL-10
and TGFb64. The significant decrease in IFNgand increase in
IL-10 detected in co-cultures of Id1-overexpressing splenocytes with naive OT-II CD4 T cells confirm the activation of antigen-specific immunosuppressive mechanisms. Finally, we demonstrate that
Id1 overexpression in the CD11bþGr1þ subset specifically
induces antigen-specific T-cell suppression, providing direct evidence of the functional consequences of Id1 overexpression in downstream effector immune responses.
Despite well-documented evidence suggesting that malignant
melanoma is an immunogenic tumour66, a property that has
made this disease a preferred target for investigating different
immunotherapeutic strategies67,68, clinical outcomes have not
been as promising as anticipated. These seemingly paradoxical results are now thought to be due to an immunosuppressive
environment generated by cells such as MDSCs69. Given
the rise in incidence and death rates of metastatic melanoma70,
there is increased urgency for a deeper understanding of the regulation of these pro-metastatic, immunosuppressive mechanisms.
Our study reveals for the first time a novel pivotal role for Id1 in tumour and metastatic progression and in control-ling systemic tumour-induced immunosuppression, providing further insight into the therapeutic promise of Id1 targeting. Pharmacological inhibition of Id1 using blocking peptides or small interfering RNA would offer the advantage of selective targeting, therefore largely minimizing side effects. This new approach would offer the opportunity to re-examine immu-notherapies in a new improved setting. Targeting of Id1 or downstream pathways would provide a three-pronged therapeutic approach by reducing metastatic potential of the tumour itself, reducing tumour angiogenesis and finally restoring systemic immune function.
Methods
Human studies.Human peripheral blood samples were obtained under informed consent and handled in accordance with approved Institutional Review Board protocols (IRB 0604008488 and IRB 12-137(A)). Human peripheral blood samples from stage IV melanoma patients at the Memorial Sloan Kettering Cancer Center had histologically confirmed melanoma. Plasma and PBMC were isolated as pre-viously described43. CD11Bþcells were isolated by positive selection using CD11B-coated magnetic beads (Miltenyi Biotec).
Isolation andin vitrodifferentiation of Lincells.BM cells were harvested from the femurs and tibias of 8–12-week-old mice and enriched for haematopoietic progenitor cells by depletion of lineage-specific cells using the EasySep Hemato-poietic Progenitor Enrichment Kit (StemCell Technologies) as per manufacturer’s recommendations. One million enriched haematopoietic progenitor cells were placed into each well of six-well plates in 2 ml of RPMI supplemented with 10% fetal bovine serum and 20 ng ml1Granulocyte-macrophage colony-stimulating factor (GM-CSF), Complete medium was replaced every 3 days and cells were collected for further analysis at indicated time points. To assess the effects of tumour-derived factors on DC differentiation, Lincells were treated with com-plete medium supplemented with 25% v/v serum-free medium conditioned over-night by subconfluent cultures of the B16F10 melanoma or control media.
Plasmids.PGEW-empty and PGEW-Id1 vectors were built from plasmid pCCL.sin.cPPT.PGK.GFP.WPRE as previously described23.
Virus production and titration.Lentiviral vector stocks, pseudotyped with the vesicular stomatitis G-protein were produced by transient co-transfection of 293 T cells and titred on HeLa cells. Viral supernatants were concentrated to titresZ108
transduction units per ml by ultracentrifugation.
Transduction of tumour and BM Lincells.Lincells plated at a density of 1106cells per ml in StemSpan Serum Free Expansion Medium (StemCell Technologies) were transduced with concentrated virus for 12 h (multiplicities of infection¼50–60), washed and resuspended in phosphate-buffered saline (PBS) for transplantation in irradiated mice or subsequentin vitrostudies.
Immunofluorescence staining.B16F10 tumours and lung tissues were fixed frozen with Optimal Cutting Temperature compound. Sections (cryostat, Leica) were mounted with Vectashield containing DAPI (4,6-diamidino-2-phenylindole) and were visualized with an ultraviolet fluorescent microscope (Nikon Eclipse E800) with a Retiga camera (QImaging) through IP Lab version 3.65a imaging software (Scanalytics). For GFP and mCherry quantification, only DAPI staining was performed. Using Adobe Photoshop 7.0,100 objective fields were analysed by selecting a standardized colour range. After boundary delineation, the area under the pixilation histogram was calculated, comparing total staining area to total tissue area or counting the number of vessels and GFPþcells per field.
Primers for qPCR.Mouse Id1-forward primer 50-TTGTTCTCTTCCCACACTCTGTTC-30 Mouse Id1-reverse primer
50-CTGGCGACCTTCATGATCCT-30 Mouse Id1-probe
50FAM-CAGCCTCCTCCGCTCCCCTCC-30TAMRA
All other sets were commercial proprietary Taqman assays purchased form Applied Biosystems.
OT-I T-cell assays.Equal number of GFPþCD11bþGr1þcells isolated by FACS from Id1-overexpressing and control vector splenocytes were co-cultured in the presence of OVA257–264peptide with splenocytes isolated from OT-I transgenic
mice (C57BL/6-Tg(TcraTcrb)1100Mjb/J, JAX) and stained using CellTrace CFSE Cell Proliferation Kit (Invitrogen). T-cell proliferation was measured by CFSE dilution following a 4-day incubation in 96-well tissue culture-treated plates (Corning).
OT-II T-cell assays.Single-cell suspensions of splenocytes from Id1-over-expressing and control vector animals (105cells) were co-cultured in the presence of OVA323–339peptide with 105CD4þT cells isolated from OT-II transgenic mice
(C57BL/6-Tg(TcraTcrb)425Cbn/J, JAX) using the CD4þ-negative selection kit (Miltenyi Biotec) and stained using CellTrace CFSE Cell Proliferation Kit (Invitrogen). T-cell proliferation was measured by CFSE dye dilution and cytokine production by enzyme-linked immunosorbent assay (ELISA; R&D Systems) following a 72-h incubation in 96-well tissue culture-treated plates (Corning).
BM transplantation.Recipient mice were lethally irradiated with a single dose of 9.5 Gy of whole-body irradiation. Twenty-four hours after irradiation, 2106 donor lineage-depleted cells isolated from BM cells were injected via tail vein.
Tumour implantation.C57BL/6 mice were injected in the mammary fat pad with 2105E0771 cells or intradermally in the flank with 1106B16F10 cells. Both cell lines were obtained from the American Type Culture Collection. Tumour dimensions were calculated by caliper measurements and volume was calculated according to the equation:
Tumourvolume¼ ðlengthwidthdepthÞ=2:
Cell preparation and flow cytometry.Single-cell suspensions of splenocytes were stained at 4°C in PBS with 3% (vol/vol) fetal bovine serum, following red blood cell lysis (Gibco, Invitrogen) and incubation with purified Fc-block (CD16/CD32, BD). The following antibodies were used for staining: anti-mouse: anti-CD11c Phy-coerythrin (PE) (HL3) (1:100), anti-Gr1 PE (RB6-8C5) (1:50), anti-CD11b Fluorescein isothiocyanate (FITC) (M1/70) (1:100), anti-MHC class II FITC (I-A/I-E; M5/114.15.2) (1:200), anti-major histocompatibility complex (MHC) class II FITC (I-Ek; 14-4-4S) (1:200), anti-CD34 PE (RAM34) (1:100) and anti-IFNg (XMG1.2) (1:100), all obtained from BD Pharmingen; anti-Ly6G PE (1A8) (1:50) and anti-Ly6C Allophycocyanin (APC) (HK1.4) (1:100), both obtained from Biolegend; anti-CD115 APC (AFS98) (1:100), anti-CD49b PE-Cy7 (DX5) (1:200), CD3 PE-Cy7 (145-2C11) (1:50), CD19 PE-Cy7 (1D3) (1:300), Ter119 PE-Cy7 (TER119) (1:200), Gr1 PE-Cy7 (RB6-8C5) (1:300), anti-CD117 (c-kit) APC-eFluor780 (2B8) (1:200), anti-CD16/CD32 Alexa700 (93) (1:50), anti-Sca-1 PE-Cy5 (D7) (1:200), anti-CD135 biotin (A2F10) (1:200), Streptavidin PerCP-Cy5.5 (1:300), anti-CD4 FITC (RM4-5) (1:200), anti-CD4 Pacific Blue (RM4-5) (1:100), anti-CD25 APC (PC61) (1:100), anti-CD25 Alexa700 (PC61.5) (1:150), anti-Foxp3 PE (FJK-16s) (1:50), anti-CD11b PE-Cy5 (M1/70) (1:200), anti-CD8a APC-eFluor780 (53-6.7) (1:100), anti-V alpha 2 TCR PE (B20.1) (1:200), anti-Gr1 APC (RB6-8C5) (1:200), anti-CD11b APC (M1/70) (1:200) and Gr1 APC-eFluor780 (RB6-8C5) (1:300), and human anti-CD33 PE (WM53) (1:100), CD11B PerCp-Cy5.5 (M1/70) (1:100), anti-CD14 Alexa 700 or FITC (M5E2) (1:100) and anti-HLA PE-Cy7 (L243) (1:200), obtained from BD or eBioscience, and anti-VEGFR1 APC (49560) (1:100) obtained from R&D Systems. Data were acquired on a FACSCalibur, a FACSCanto or an LSR II (BD Biosciences) and analysed with FlowJo software (Treestar). FACS was performed on a Vantage cell sorter (BD Biosciences).
Measurement of ROS.ROS was measured by labelling cells with the oxidation-sensitive dye dichlorodihydrofluorescein diacetate; (Abcam) according to the manufacturer’s instructions, and analysis was carried out by flow cytometry on a FACSCalibur (BD Biosciences).
qPCR analysis.Total RNA was extracted from cells with RNeasy Mini Kit (Qiagen). Genomic DNA was removed by treatment with DNase I (Qiagen). Complementary DNA (cDNA) was synthesized using the Superscript III reverse transcription kit (Invitrogen). qPCR was performed on a 7,500 Fast Real Time PCR System (Applied Biosystems) using TaqMan Universal PCR Master Mix (Applied Biosystems). Primer assays were purchased from Applied Biosystems or sequences are available in Supplementary Methods. Relative expression was normalized to b-actin levels.
Microarray preparation and analysis.Total RNA was isolated from LinBM cells transduced with Id1-overexpressing or control lentivirus and cultured for 6 days as described above, using the RNeasy Mini Kit (Qiagen). The Affymetrix One-RoundIn VitroTranscription RNA Amplification Kit was used to amplify 1.5mg of total RNA. The cDNA was synthesized with a primer containing oligo(dT) and T7 RNA polymerase promoter sequences. Double-stranded cDNA was then purified and used as a template to generate biotinylated complementary RNA (cRNA). The quantity and quality of the amplified cRNA was assessed using a NanoDrop ND-1000 Spectrophotometer (Thermo Scientific) and an Agilent Bioanalyzer. The biotinylated cRNA was fragmented and hybridized to Affymetrix Mouse Genome 430A 2.0 arrays representingB14,000 well-characterized mouse genes. After hybridization, the GeneChip arrays were washed, stained and scanned using a GeneChip Scanner 3,000 7G. Affymetrix GeneChip Operating Software was used for image acquisition. Analysis was performed using GeneSpring GX 15.11 soft-ware (Agilent Technologies Inc., USA). Robust Multichip Average with Quantile normalization was used for background correction and normalization of CEL files. Genes differentially expressed were identified by using a fold change cutoff of 1.4. Pathway analysis of differentially expressed genes was carried out using IPA to determine significant gene networks and canonical pathways in IPA version 8.6 (Ingenuity Systems, www.ingenuity.com).
ELISA.Plasma levels of IFNg, IL-10 and TGFbwere determined using the Mouse IFNgand IL-10 Quantikine ELISA Kits and Human TGFb1 Quantikine Elisa (R&D Systems,) according to manufacturer’s instructions.
B16F10 exosome purification.To isolate exosomes, serum-free B16F10-condi-tioned media was centrifuged at 500gfor 10 min. The supernatant was then removed and re-centrifuged at 12,000gfor 20 min. Exosomes were then harvested by centrifugation at 100,000gfor 70 min. The exosome pellet was resuspended and washed in 20 ml of 1PBS and collected by centrifugation at 100,000gfor 70 min (Beckman Optima XE ultracentrifuge equipped with TY-70Ti rotor). Freshly isolated B16F10 exosomes were added to Lincell cultures at 10mg ml1.
lysed in 100ml RIPA cell lysis buffer (Thermo Scientific) containing a cocktail of protease inhibitors (Roche). The supernatant of cell lysis was subjected to western blotting analysis with anti-mouse ID1 (Biocheck, 1:200) and anti-b-actin anti-bodies (Santa Cruz, 1:100). The western blot was carried out in three independent replicate experiments.
Immunofluorescence staining.B16F10 tumour tissues and lung tissues were fixed in 4% paraformaldehyde before being embedded in Optimal Cutting Temperature compound. Immunofluorescence staining was performed using rat anti-mouse CD31 antibody (BD Biosciences), biotinylated anti-rat IgG as a secondary antibody and Texas Red Avidin DCS (Vector Laboratories, Inc.). Cryosections (Leica cryostat) were mounted with Vectashield containing DAPI and were visualized with an ultraviolet fluorescent microscope (Nikon Eclipse E800) with a Retiga camera (QImaging) through IPLab version 3.65a imaging software (Scanalytics).
Statistical analysis.Statistical and graphical analyses were performed using GraphPad Prism software (version 3.0). Data were analysed using Student’s unpairedt-test, one-way analysis of variance and Mann–Whitney test. Results were considered statistically significant atPvalueso0.05. Error bars depict s.e.m.
References
1. Gabrilovich, D. I., Ostrand-Rosenberg, S. & Bronte, V. Coordinated regulation of myeloid cells by tumours.Nat. Rev. Immunol.12,253–268 (2012). 2. Peinado, H., Lavotshkin, S. & Lyden, D. The secreted factors responsible for
pre-metastatic niche formation: old sayings and new thoughts.Semin. Cancer Biol.21,139–146 (2011).
3. Serafini, P., Borrello, I. & Bronte, V. Myeloid suppressor cells in cancer: recruitment, phenotype, properties, and mechanisms of immune suppression. Semin. Cancer Biol.16,53–65 (2006).
4. Fricke, I.et al.Vascular endothelial growth factor-trap overcomes defects in dendritic cell differentiation but does not improve antigen-specific immune responses.Clin. Cancer Res.13,4840–4848 (2007).
5. Shojaei, F.et al.Tumor refractoriness to anti-VEGF treatment is mediated by CD11bþGr1þmyeloid cells.Nat. Biotechnol.25,911–920 (2007). 6. Della Bella, S.et al.Altered maturation of peripheral blood dendritic cells in
patients with breast cancer.Br. J. Cancer89,1463–1472 (2003).
7. Almand, B.et al.Clinical significance of defective dendritic cell differentiation in cancer.Clin. Cancer Res.6,1755–1766 (2000).
8. Bronte, V., Serafini, P., Apolloni, E. & Zanovello, P. Tumor-induced immune dysfunctions caused by myeloid suppressor cells.J. Immunother.24,431–446 (2001).
9. Talmadge, J. E. & Gabrilovich, D. I. History of myeloid-derived suppressor cells.Nat. Rev.13,739–752 (2013).
10. Steinman, R. M. & Banchereau, J. Taking dendritic cells into medicine.Nature
449,419–426 (2007).
11. Gabrilovich, D. Mechanisms and functional significance of tumour-induced dendritic-cell defects.Nat. Rev. Immunol.4,941–952 (2004).
12. Pages, F.et al.Immune infiltration in human tumors: a prognostic factor that should not be ignored.Oncogene29,1093–1102 (2010).
13. Gabrilovich, D. I. & Nagaraj, S. Myeloid-derived suppressor cells as regulators of the immune system.Nat. Rev. Immunol.9,162–174 (2009).
14. Rodriguez, P. C. & Ochoa, A. C. Arginine regulation by myeloid derived suppressor cells and tolerance in cancer: mechanisms and therapeutic perspectives.Immunol. Rev.222,180–191 (2008).
15. Sica, A. & Bronte, V. Altered macrophage differentiation and immune dysfunction in tumor development.J. Clin. Invest.117,1155–1166 (2007). 16. Kusmartsev, S.et al.Oxidative stress regulates expression of VEGFR1 in
myeloid cells: link to tumor-induced immune suppression in renal cell carcinoma.J. Immunol.181,346–353 (2008).
17. Kusmartsev, S., Nefedova, Y., Yoder, D. & Gabrilovich, D. I. Antigen-specific inhibition of CD8þ T cell response by immature myeloid cells in cancer is mediated by reactive oxygen species.J. Immunol.172,989–999 (2004). 18. Youn, J. I., Nagaraj, S., Collazo, M. & Gabrilovich, D. I. Subsets of
myeloid-derived suppressor cells in tumor-bearing mice.J. Immunol.181,5791–5802 (2008).
19. Almand, B.et al.Increased production of immature myeloid cells in cancer patients: a mechanism of immunosuppression in cancer.J. Immunol.166,678– 689 (2001).
20. Zea, A. H.et al.Arginase-producing myeloid suppressor cells in renal cell carcinoma patients: a mechanism of tumor evasion.Cancer Res.65,3044–3048 (2005).
21. Mandruzzato, S.et al.IL4Ralphaþmyeloid-derived suppressor cell expansion in cancer patients.J. Immunol.182,6562–6568 (2009).
22. Benezra, R., Davis, R. L., Lockshon, D., Turner, D. L. & Weintraub, H. The protein Id: a negative regulator of helix-loop-helix DNA binding proteins.Cell
61,49–59 (1990).
23. Chan, A. S.et al.Id1 represses osteoclast-dependent transcription and affects bone formation and hematopoiesis.PLoS ONE4,e7955 (2009).
24. Fong, S., Debs, R. J. & Desprez, P. Y. Id genes and proteins as promising targets in cancer therapy.Trends Mol. Med.10,387–392 (2004).
25. Perk, J., Iavarone, A. & Benezra, R. Id family of helix-loop-helix proteins in cancer.Nat. Rev.5,603–614 (2005).
26. Lyden, D.et al.Id1 and Id3 are required for neurogenesis, angiogenesis and vascularization of tumour xenografts.Nature401,670–677 (1999).
27. Lyden, D.et al.Impaired recruitment of bone-marrow-derived endothelial and hematopoietic precursor cells blocks tumor angiogenesis and growth.Nat. Med.
7,1194–1201 (2001).
28. Gao, D.et al.Endothelial progenitor cells control the angiogenic switch in mouse lung metastasis.Science319,195–198 (2008).
29. Buitenhuis, M.et al.Differential regulation of granulopoiesis by the basic helix-loop-helix transcriptional inhibitors Id1 and Id2.Blood105,4272–4281 (2005).
30. Geest, C. R., Buitenhuis, M., Vellenga, E. & Coffer, P. J. Ectopic expression of C/EBPalpha and ID1 is sufficient to restore defective neutrophil development in low-risk myelodysplasia.Haematologica94,1075–1084 (2009).
31. Jankovic, V.et al.Id1 restrains myeloid commitment, maintaining the self-renewal capacity of hematopoietic stem cells.Proc. Natl Acad. Sci. USA104, 1260–1265 (2007).
32. Suh, H. C.et al.Id1 immortalizes hematopoietic progenitors in vitro and promotes a myeloproliferative disease in vivo.Oncogene27,5612–5623 (2008). 33. Kaplan, R. N.et al.VEGFR1-positive haematopoietic bone marrow progenitors
initiate the pre-metastatic niche.Nature438,820–827 (2005).
34. Sinha, P.et al.Proinflammatory S100 proteins regulate the accumulation of myeloid-derived suppressor cells.J. Immunol.181,4666–4675 (2008). 35. Hiratsuka, S.et al.The S100A8-serum amyloid A3-TLR4 paracrine cascade
establishes a pre-metastatic phase.Nat. Cell Biol.10,1349–1355 (2008). 36. Serafini, P., Mgebroff, S., Noonan, K. & Borrello, I. Myeloid-derived suppressor
cells promote cross-tolerance in B-cell lymphoma by expanding regulatory T cells.Cancer Res.68,5439–5449 (2008).
37. MacDonald, K. P.et al.Cytokine expanded myeloid precursors function as regulatory antigen-presenting cells and promote tolerance through IL-10-producing regulatory T cells.J. Immunol.174,1841–1850 (2005).
38. Lu, T. & Gabrilovich, D. I. Molecular pathways: tumor-infiltrating myeloid cells and reactive oxygen species in regulation of tumor microenvironment.Clin. Cancer Res.18,4877–4882 (2012).
39. Chambers, R. C., Leoni, P., Kaminski, N., Laurent, G. J. & Heller, R. A. Global expression profiling of fibroblast responses to transforming growth factor-beta1 reveals the induction of inhibitor of differentiation-1 and provides evidence of smooth muscle cell phenotypic switching.Am. J. Pathol.162,533–546 (2003). 40. David, L., Mallet, C., Mazerbourg, S., Feige, J. J. & Bailly, S. Identification of
BMP9 and BMP10 as functional activators of the orphan activin receptor-like kinase 1 (ALK1) in endothelial cells.Blood109,1953–1961 (2007). 41. Liang, Y. Y., Brunicardi, F. C. & Lin, X. Smad3 mediates immediate early
induction of Id1 by TGF-beta.Cell Res.19,140–148 (2009).
42. Strong, N., Millena, A. C., Walker, L., Chaudhary, J. & Khan, S. A. Inhibitor of differentiation 1 (Id1) and Id3 proteins play different roles in TGFbeta effects on cell proliferation and migration in prostate cancer cells.Prostate73, 624–633 (2012).
43. Peinado, H.et al.Melanoma exosomes educate bone marrow progenitor cells toward a pro-metastatic phenotype through MET.Nat. Med.18,883–891 (2012).
44. Waight, J. D.et al.Myeloid-derived suppressor cell development is regulated by a STAT/IRF-8 axis.J. Clin. Invest.123,4464–4478 (2013).
45. Schonheit, J.et al.PU.1 level-directed chromatin structure remodeling at the Irf8 gene drives dendritic cell commitment.Cell Rep.3,1617–1628 (2013). 46. Kusmartsev, S.et al.Reversal of myeloid cell-mediated immunosuppression in
patients with metastatic renal cell carcinoma.Clin. Cancer Res.14,8270–8278 (2008).
47. Diaz-Montero, C. M.et al.Increased circulating myeloid-derived suppressor cells correlate with clinical cancer stage, metastatic tumor burden, and doxorubicin-cyclophosphamide chemotherapy.Cancer Immunol. Immunother.
58,49–59 (2009).
48. Vuk-Pavlovic, S.et al.Immunosuppressive CD14þHLA-DRlow/- monocytes in prostate cancer.Prostate70,443–455 (2010).
49. Filipazzi, P.et al.Identification of a new subset of myeloid suppressor cells in peripheral blood of melanoma patients with modulation by a granulocyte-macrophage colony-stimulation factor-based antitumor vaccine.J. Clin. Oncol.
25,2546–2553 (2007).
50. Ruzinova, M. B. & Benezra, R. Id proteins in development, cell cycle and cancer.Trends Cell. Biol.13,410–418 (2003).
51. O’Brien, C. A.et al.ID1 and ID3 regulate the self-renewal capacity of human colon cancer-initiating cells through p21.Cancer Cell21,777–792 (2012). 52. Arteaga, C. L. Inhibition of TGFbeta signaling in cancer therapy.Curr. Opin.