SOCIAL CLASS AND ARTERIOSCLEROTIC
HEART DISEASE’
Drs. Dario CurieP and Ruth R. Puffer3
Epidemiology is no longer concerned with only the medical factors involved in the interaction of host and environment. As now conceived, it deals with a more complex network of interrelationships, formed by the host, his natural environ- ment, and-as an added factor-his way of life. This modern approach requires the development of a special methodology applicable to the greatest possible number of areas and circumstances.
Introduction
Considerable interest has been shown in recent decades in the study of diseases in relation to social conditions. Among the factors which have aroused this interest are the rela- tively new concept of “stress,” the well-known problem arising directly from the interrelation- ships between man and society, and the substantial increase in coronary thrombosis, particularly in males and from middle-age on. Although both of these factors have been explored from many standpoints, the possi- bility that the former may play a significant role in the etiology of the latter has stimulated a considerable amount of research.
There appear to be no generally accepted definitions-as far as their application to epidemiological studies is concerned-of the parameters involving social factors as such. The very complexity of these factors, which often
lExamination of a methodology applicable to Latin America, developed as a by-product of the Inter-American Investigation of Mortality.
The Investigation was made possible by Grant GM-08682 of the National Institute of General Medical Sciences of the United States Public Health Service and by the cooperation and support of the ministries of health, local authorities, and schools of medicine and public health of the 12 cities studied.
Published in Spanish in Boletin de la Oficina Sanitaria Panamericana, Vol. LXVI, No. 4 (April 1969), pp. 281-295.
ZProfessor of Hygiene and Social Medicine, Depart- ment of Preventive and Social Medicine, Razetti School of the School of Medicine, Central University of Venezuela.
%hief, Department of Health Statistics, Pan American Health Organization, Washington, DC.
include a considerable number of inter- dependent subfactors, makes it difficult to apply the conventional procedures of epidemi- ology to them, and this becomes a serious obstacle to any attempt to draw valid con- clusions.
Epidemiology has inevitably gone beyond the restricted field of medical ecology in the strictly biological sense-that is, the study of the interaction between a host and his natural environment-and entered the field of medical ecology in the wider sense, which considers the relations between the host, his natural environ- ment, and his way of life, which is to say, with the social environment as a necessary addition. To meet the challenge posed by this wider field to the development of knowledge and research, it is necessary to take into consideration, in addition to the traditional factors of sex, age, marital status, geographic distribution, seasonal changes, etc., the parameters defined by social conditions or groups or those related to them. This makes it immediately evident that there is a need to develop a special methodology applicable to the greatest possible number of areas and circumstances.
Stevenson-successor to William Farr as chief medical statistician of the Office of the Registrar General of England and Wales-had the idea4 of delineating the social groups on the basis of occupations. He divided the population into five social classes based on: (1) the level of
Curie1 and Puffer - SOCIAL CLASS AND ARTERIOSCLEROTIC HEART DISEASE 53
training required by the occupation or the role it plays in’ production, and (2) the social prestige enjoyed by each profession. Within this context, the five original classes, which have been widely used in the national statistics of England and Wales, are:
Social
ChSS Occupation I Leading professions
and business Physician Stock broker II Lesser professions
and business III Skilled
workers
Schoolteacher Shop owner Office worker Construction foreman IV Semiskilled
workers Machine operator Farmer or fisherman
V Unskilled Messenger
workers Construction worker Examples
Classes I and II. together with the non- manual workers included in Class III, can be said to constitute what are generally called the middle classes, while the skilled manual workers in Class III and the workers in Classes IV and V are the working classes.
In considering this new and somewhat generalized parameter of employment used in today’s epidemiological studies, a number of precautions should be taken into account:
1) The social classes, to the same extent as, and in certain respects even more than, the other parameters of employment currently used in epidemiology (sex, age, place of residence, seasonal factors, etc.) constitute categories each of which includes a large number of comulex factors (the so-called “umbrella” catego$es) which are often limited to describing in broad outline the distribution of epide’miological phenomena to provide a basis for useful hypo- theses and new directions for research.
2) It is generally true that social classes constitute more firmly defined categories to the extent that the term is applied to more strati- fied social structures which are generally endowed with less occupational mobility and in which, as a consequence, a person’s occupation is linked more closely and persistently to his social status. When these conditions are com- bined, especially in developed countries where there are numerous and well-defined occupa- tional categories, it is possible to form social classes which are homogeneous and also allow a
certain number of subdivisions. Conversely, in less stratified societies (for example, certain postwar societies)., _ in which there is more occupational mobtity and inconsistencies of status or prestige between or within groups, the differences among classes are less pronounced and there is a consequent reduction of their usefulness as parameters in relation to certain phenomena.
3) In comparing the developing countries- including the Latin American countries-with more developed nations, it would seem that they are characterized, on the one hand, by greater stratification of their social classes and, on the other, by a smaller number of occupa- tional categories, less sharply defined cate- gories, and probably a lesser degree of mobility among them. The three latter factors appear, however, to pose a serious obstacle to the construction of groups representing social classes as clearly defir;ed or as numerous as those existing in other countries. Nevertheless. the possibility of identifying a number of social classes limited to three major groups and based on either of the two components cited above, namely, level of training and prestige, offers a possible means of classification. which would be roughly as follows:
a) Using the first criterion-level of train- ing-occupations requiring primarily mental activity would be considered the first class; occupations in which manual labor predomi- nates would be the third class; and a second or intermediate class would include groups of occupations not clearly identifiable as belong- ing to either of the first two. There are various precedents for this type of attempted classifica- tion, such as, for example, the studies by McDonough and others in 1963 (3) on the prevalence of coronary heart disease and levels of blood cholesterol found in men in the 40-74 years age group of the white population of a county in Georgia (United States). There are also ihe studies of- Stanowski &d others in 1954 (4) on patients with confirmed mvo- cardial - &farct<on or coronary insufficiency without infarction.
54 BOLETIN DE LA OFICINA SANITARIA PANAMERICANA
Objectives and Background
The principal aim of this paper is to study the relationship of a certain number of diseases or groups of diseases with social factors. An attempt will be made, by this means, to throw light on the dynamics of disease-and, in- directly, on that of health-on the basis of an aspect which up to now has been generally less used in this Hemisphere, by adding it to those factors considered classical in epidemiology, such as sex, age, place of residence, and seasonal conditions.
Using semi-processed material from the Inter-American Investigation of Mortality, an analysis was made, for 12 cities, of certain causes of mortality in adult males on the basis of social classes defined according to occupa- tion. Although the nature and methodology of this investigation have already been described (I), it is considered advisable to present them here in summary form.
Studies made in the 1950’s (5) had made it quite evident that there were wide geographic variations in mortality caused by various diseases, particularly the chronic and degenera- tive ones such as cardiovascular diseases. Although these differences were quite apparent and significant, it was impossible to draw conclusions from the national data serving as source material, since the methods of registra- tion and certification of causes of death varied significantly from country to country, as did the terminology and nosological concepts of the diseases involved. Stated another way, it was not possible to determine, when faced with a particular difference, if it was real or simply an apparent difference resulting from the use of one or more of the factors mentioned above.
The basic objective of the Inter-American Investigation of Mortality was to eliminate these factors of error or reduce them to a minimum, and to construct a reliable and comparable picture of mortality in different areas. With this in view, the Pan American Health Organization, aided by institutions and individuals in various countries, undertook to carry out the study described herein, the
immediate goal of which was to investigate a total of more than 40,000 deaths which had occurred over a period of two years in 12 cities (10 in Latin America, one in the United States, and one in England and Wales). For the purposes of the study some 4,000 deaths in a two-year period (1962-1964) were selected- generally through sampling methods-in each of the cities. Each death was investigated within a few days of its occurrence. The investigation was divided into two parts: a first stage (conducted by nurses, social workers, etc.) in which, in addition to confirming the personal data, an inquiry was made into the medical care received during the course of the disease leading to death, as well as the data concerning the place of residence and occupation of the deceased; and a second phase, carried out by a physician, which took account of all the infor- mation from the clinical, anatomo-pathological, or other sources regarding the disease or diseases the deceased had suffered, with a view to achieving a reliable determination of the underlying cause or causes of death. Following a review at the central level and a direct classification of the cause of death if there was a single cause of death the information on the remaining deaths (approximately half) was sent to two medical referees who, after studying all the anatomo-clinical information derived from questionnaires, made an independent deter- mination of the underlying cause or causes of death. In doing this, the referees adhered as closely as possible to the rules established by the International Classification of Diseases and, through a weighting system, broke down the unit represented by a single death-when more than one cause was involved-and assigned the causes in fractions indicating the extent to which, in their opinion, each cause was respon- sible for the death.
Material
Curiel and Puffer . SOCIAL CLASS AND ARTERIOSCLEROTIC HEART DISEASE 55
of the deaths distributed by causes and occupa- tions, as well as by sex and IO-year age groups, ranging from 15-24 to 65-74 years. Moreover, since the study referred essentially to occupa- tion groups and to social classes, the analysis was restricted to male residents of each of the cities and the parameters used were causes of death, occupation, and age.
Causes of Death
The causes of death were selected primarily in accordance with the concept of the under- lying cause established by the World Health Organization and, consequently, the determina- tion was made by applying, insofar as possible, to the data contained in the investigation of each death, the rules of classification recom- mended by the International Classification of Diseases.
However, owing to the weighting system that was used-according to which it was possible to attribute as many as four different causes to a single death-the causes are not distributed on a unit system (one cause for each death) but rather on a fractional basis, the size of the fraction depending on the numerical weight attributed to a given cause in a par- ticular death. The most important element in computing the causes of death on which this study is based is, therefore, that of the weight given to each cause, which can range from 1 (in the case of a single cause) to one-sixth (for a cause which, according to the methodology used, was considered least likely). The total for a given cause does not, therefore, represent the number of persons whose death resulted from it (actually, many of the figures contain decimals) but rather the numerical weight attributed to the cause within the general pattern of mortality.
Understood in this way, the computations which served as a basis for this analysis consist of tabulations which provide, for each city, the numbers of deaths weighted according to causes and subdivided according to occupation, sex, and age. Furthermore, in order to increase the size of the figures, the number of causes was
reduced to 74; in doing so, however, every possible precaution was taken to preserve the nosological identity or epidemiological affinity of causes placed in a single group.
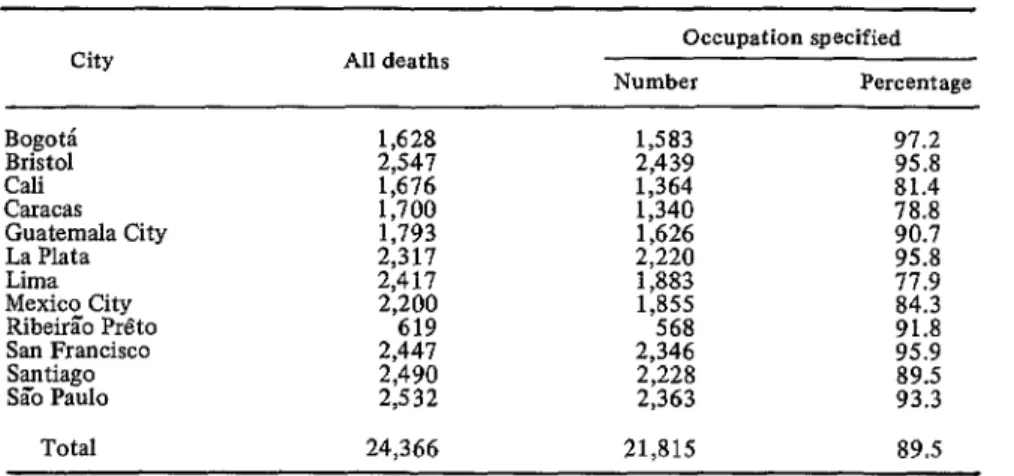
It was possible to specify the occupation of the deceased in 90 per cent of the deaths occurring in adult males (15-74 years of age) and, as will be noted in Table 1, while there are some variations in the percentages for different cities, it was possible, in general, to obtain satisfactory information regarding the occupation of the men who were at the time of death or had been engaged in a given occupation.
Occupations
The second parameter, which is actually the basic point of this study, refers to the social class of the deceased, defined here in terms of occupation. In the introduction to this paper a brief description is given of the number and nature of social classes used in the official statistics of England and Wales, as well as the method employed to determine the occupa- tional composition of each class. A similar method was applied in the present analysis. However, since most of the cities included in this study are in developing countries, it was deemed advisable to consider certain social factors which distinguish these from cities in a developed country such as Great Britain.
As previously pointed out, in making social- class distinctions based on occupation and applying them to less-developed countries, the three following premises should be taken into account:
1) A relatively stratified social structure and one in which an occupation can be readily identified in terms of the prestige or status which a nerson eniovs in the community.
2) A‘ smaller -number of occupations and less clearlv defined limits between one and the other,. together with greater inter-occupational mobrhty and, consequently, less association between the occupational status and the social status of an individual.
56 BOLETIN DE LA OFICINA SANITARIA PANAMERICANA
TABLE l-Number of deaths in males, 1.5-74 years of age, and number and percentages of deaths with occupational status specified, in each city, 1962-1964.
City All deaths Occupation specified
Number Percentage
“,sz
Cali Caracas E;;tcyaala City Lima
Mexico City RibeGo Preto San Francisco Santiago Sa’o Paul0
Total
2,547
1,628 1,583 2,439 97.2 95.8
:% 1,364 81.4
2,317 11793 1,340 1,626 2,220 E 95:8
2,417 1,883
‘8x
2,200 1,855
619 568 91:8
2,441 2,346 95.9
89.5
I$$! 2,228 2,363 93.3
24,366 21,815 89.5
The latter procedure was employed in the present analysis and resulted in the establish- ment of three classes (A, B, and C) based on the International Standard Classification of Occupations (Appendix 1) which was, in effect, the one used to classify the occupations included in the study. In the procedure used to determine the classes, three persons (an epidemiologist, a general physician, and a librarian) well acquainted with the structure of Latin American societies decided unanimously into which of the three following social classes a person primarily engaged in a given occupa- tion should be placed:
Class Occupation Examples
A Leading professionals Engineers or executives Executives of large companies B Lesser professionals
and businessmen Nurses and skilled workers
with predominantly Traveling salesmen “mental’ duties Typists
C Skilled manual work- Carpenters ers and semiskilled Bricklayers or unskilled workers Messengers For the 12 cities as a whole, 13 per cent of the deceased males had been engaged in occupa- tions classified in Class A, 20 per cent in Class B, and 67 per cent in Class C.
Age
As already mentioned, the sample of popula- tion studied-expressed in terms of the distribu- tion of the deaths in the different cities- consists of resident adult males in each city, “Adult males” refers to males of 15-74 years of age, and “resident” means that the deceased had been living in the corresponding city for a certain time before his death.
Results and Comments
The classical study by Whitney (6) of the National Tuberculosis Association of the United States-a study based on death certifi- cates of 10 states-clearly showed the high degree of variation of death rates according to occupation. The frequently cited rates for respiratory tuberculosis in males 15-64 years of age who had engaged in gainful employment are reproduced in Table 2.
Curiel and Puffer . SOCIAL CLASS AND ARTERIOSCLEROTIC HEART DISEASE 57
TABLE I-Standardized death rates from ali causes and from tuberculosis of the respiratory system for gainfully occupied males in selected occupations, 15-64 years of age, in 10 states (U.S.A.), according to socioeconomic cIass,a 1930.
Tuberculosis of All causes the respiratory Socioeconomic class (rate per system (rate
1,000 per 100,000 population) population
Professional men 6.7 26.2
Proprietors, managers,
and officials 1.9 43.2
Clerks and kindred workers
Agricultural workers Skilled workers and
foremen Semiskilled workers Unskilled workers All in selected
occupations
;I:; 65.8 46.5 1t: 102.1 72.1
14:s 184.9
9.1 87.5
aWhitney, J. S.: Death Rates by Occupations. Selected data from Table 8, page 32.
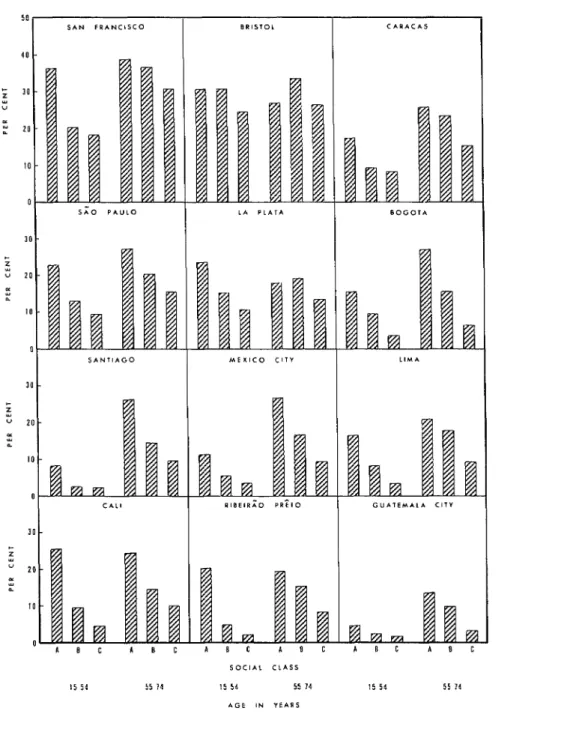
rate for laborers was three times higher than that for the professional group. These earlier experiences served for testing the adequacy of the grouping of social classes (A, B, and C) developed on the basis of the material collected in the Inter-American Investigation of Morta- lity. Unfortunately no figures were available on the size of the population exposed to each risk (the distributions by occupation); this made it necessary to resort to another method of analysis. In a preliminary examination of the material, it had been found that the propor- tions of the deaths due to tuberculosis were correlated with the death rates for the same disease. Consequently, in this analysis by social classes (A, B, and C) the percentages of deaths caused by tuberculosis (Table 3 and Figure 1) were calculated in relation to the total number of deaths for each class.
Of the 12 cities included in the study, Lima had the highest death rate from tuberculosis, 67.0 per 100,000 population; in males the same rate adjusted for age was 87.1 per 100,000 and the proportion of deaths due to this disease was 15 per cent. The proportion of deaths from
tuberculosis was 10 per cent for Class A, in contrast to 17 per cent for Class C. In Santiago, which had the second highest death rate from tuberculosis, the comparable values of the percentages of deaths from this disease were 3 for Class A and 11 for Class C. The tendency of the percentages of deaths from tuberculosis to be higher in Class B than in A and still higher in C is repeated in all the other cities except the four where the death rates for tuberculosis per 100,000 population, adjusted for age, were the lowest. These cities were Caracas (11.4), La Plata (X.8), San Francisco (7.0), and Bristol (3.7). The percentages were based, therefore, on very small numbers of deaths from tubercu- losis (Table 3), and though a tendency to increase is evident from Class A to Class C, the numbers of deaths from tuberculosis in these four cities are too small to afford a useful basis for discussion. The results noted above indicate a higher proportion of deaths from tuberculosis in Class C, which includes laborers and un- skilled workers, than in Class A, composed of professionals and managers of large companies. Thus, the results obtained in this analysis agree with those made earlier with tuberculosis death rates and tend to confirm the generally-held concept of the epidemiology of the disease.
Since tuberculosis mortality showed a differ- ential selection among the social classes adopted for this study (A, B, and C) which was expected, this being consistent for most of the cities studied, and since the characteristics of this selection strongly suggest that these classes, as constructed, are useful parameters for similar studies on any other disease, an analysis was made of mortality from arteriosclerotic heart disease (category 420 of the 1955 Revision of the International Classification of Diseases). However, because of the marked differences in the death rates by age groups and the large number of deaths caused by this disease, the death rates are presented separately for the
15-54 and 55-74 age groups.
58 BOLETfN DE LA OFICINA SANITARIA PANAMERICANA
Table 3-Number of deaths from all causes and number and percentage of deaths from tuberculosis in males, 15-74 years of age, in the three social classes in each city,a 1962-1964.
1
City
Class A Class B Class C
Deaths from Deaths from Deaths from
d%hs tuberculosis deaths All tuberculosis deaths All tuberculosis *
No.~ % No.~ $6 No.~ %
4
285 167 2.0 0.7 502 15.7 3.1 796
2.0 - 417 1,795 :E 8.;
Cdi 112 236 2; ::: 1,016 97:l 9:6
Caracas 187
A.!
359 194 16.3
eat+t;ala City 201 274 :s 0:6 E Z ::i
Lima 269 2z
711
1~~ 474 305 711 1,120 1,472 !%
2:1
440 50.2 li.2 1,174 199:1 1;::
Mexico City 367 431 14.3 3:3 1,051 55.0
RibeirSio P&o
4.0 - 2.0
San Francisco 25940 3:: 4:: 2z ::; 1,643 439 20.1 29.8 i.? 1:s
Santiago 250
SZo Paul0 348 1% . 283 324 11:3 2; 1,654 1,132 1;;.; . ‘:.; . aThe 12 cities included in the Inter-American Investigation of Mortality.
bowing to the weighting system used in the mortality study, the weighted numbers of deaths from tuberculosis are not necessarily integers.
FIGURE l-Percentages of deaths due to tuberculosis (all forms) in males, 15-74 years of age, in 12 cities,a by social classes. 1962-1964.
LIMA SANTI*GO
A B C A B C A 6 C taam
A B C
SOCIAL CLASSES
BOGOTA
im
A B C A
Bpa
B C.
aThe 12 cities included in the Inter-American Investigation of Mortality.
‘.
Curiel and FWfer - SOCIAL CLASS AND ARTERIOSCLEROTIC HEART DISEASE 59
death rates from arteriosclerotic heart disease; actually in San Francisco 30 per cent and in Bristol 28 per cent of deaths from all causes of males 15-74 years of age were due to this cause. As will be observed in Table 4 and Figure 2, the percentages of total deaths attributable to arteriosclerotic heart disease were very high for both age groups in the two cities. In Bristol the percentages varied from 25 to 34 and (as the sole exception in 12 cities) displayed no con- sistent selectivity in terms of social class. In San Francisco the percentages of the deaths due to this cause revealed sharper class differences in the younger age group (36 per cent in Class A, as compared to 20 per cent in B and 18 per cent in C) than in the older group, where the trend was similar but less pronounced (39 per cent in Class A compared to 30 per cent in C). This would indicate that in San Francisco, Class A, which includes professional workers, is subject to a higher proportion of deaths from arteriosclerotic heart disease.
Conversely, in the Latin American cities- where the rates and the proportions of deaths are lower-the percentages of deaths due to arteriosclerotic heart disease were, with a single exception, higher for Class A than Class B and in every instance higher for Class B than for C. These findings are opposite to those found for tuberculosis. There appears to be consistent evidence, therefore, that the three social classes
(A, B, and C), as constituted by occupation for the purposes of this study, offer a suitable methodological tool for a useful study in Latin America of mortality by causes in relation to social classes. This finding, if confirmed for other causes and especially on the basis of rates as well as proportions of deaths, could have far-reaching implications in the field of epidemiology as well as in administration.
In some Latin American cities the workers in Class C had a relatively small number of deaths from arteriosclerotic heart disease. Also, in seven of those cities the proportions were lower in the age group 15-54 years than in that of 55-74 years. While this difference may be mainly due to higher mortality from other causes in the younger group, it is also possible that the conditions favoring the development of coronary disease in the Latin American cities are different from those prevailing in Bristol or San Francisco. In fact Epstein (8) has pointed out that “it is likely that the major geographic differences in coronary heart disease frequency are mostly due to differences in the consump- tion of saturated fats but that a high intake of sucrose, coupled with a high saturated fat intake, excess of calories and lack of exercise, have an added detrimental effect.” Therefore, each of these contributing factors requires investigation. It may well be that in the Latin American cities there is a larger intake of
TABLE 4-Percentages of the total number of deaths due to arteriosclerotic heart disease in males of three social classes in the age groups 15-54 and 55-74 years in each city,a 1962-1964.
City Class A
15-54 years
Class B Class c Class A
55-74 years
Class B Class C
;;g$p
30.4 15.6 3;:: 2% 41227.1
27.0 33.5 15.8 26.6 6.3
Cdi 25.5 24.3 14.5 10.0
Caracas 17.6 E
2:3
8.4 26.0 23.6 15.3
Guatemala City 2z 1:::: 13.7 9.9
La Plata
16:7 15.4 18.0 19.4 1:::
Liia 20.1 18.0
Mexico City 11.3 58:: ::“7 26.7 16.8 ;:"3
Ribeirb P&o San Francisco 20.6 36.4 2::; 1;:: 19.5 38.9 15.3 36.5 3:::
Santiago
SC0 Paul0 2;:; 1% 9"% 26.1 27.3 14.4 20.2 15':;
60 BOLETfN DE LA OFICINA SANITARIA PANAMERICANA
FIGURE 2-Percentages of deaths from all causes due to arteriosclerotic heart disease, among males in the age groups 15-54 and 55-74 years in 12 cities,a by social classes, 1962-1964.
+
A 0 c A n c A 0 c A 0 C
Curie1 and Puffer - SOCIAL CLASS AND ARTERIOSCLEROTIC HEART DISEASE 61
sucrose and of highly saturated fats in Class A than in Class C. With the improvement of social and economic conditions, the nutritional patterns in all social classes may be more alike in some countries than in others where the supply of certain foods is less abundant and the less-skilled workers cannot afford to buy as large an amount of the foods that are most likely to cause arterial damage. Here too, the results of studies on the variations in different cities will probably be enlightening. Perhaps the data for groups of cities in different stages of development and with different nutritional conditions will provide new lines of investiga- tion for enlarging the scope of research into the causes of arteriosclerotic heart disease.
Summary
Epidemiology has changed from a strictly biological concept of medical ecology to a broader one which considers the wav of life of the host in addition to the interact& between the host and his natural environment. Thus, consideration must be given to other para- meters besides the traditional ones of sex, age, etc., and an nd hoc methodology must be developed which will be applicable to the largest possible number of areas and circum- stances.
To that end, a study was made to relate mortality due to tuberculosis and arterio- sclerotic heart disease to social factors. Material prepared by the Inter-American Investigation of Mortality was used for the purpose. (It is based on the absolute numbers of weighted deaths distributed by cause, occupation, sex, and 1 O-year age groups, from 15 to 74 years.)
Ten of the 12 cities in this investigation were located in Latin America: the other two were San Francisco in the United States, and Bristol in the United Kingdom. The followine social classes were established: A. leading professions and business; B. lesser professions and business. as well as skilled non-manual workers; and’ C. skilled manual workers, and semiskilled and unskilled workers. In all 12 cities, of the deaths of males. 13 uer cent were from- occupations in Class A, 20‘ per cent in Class B, and 67 per cent in Class C.
The study further disclosed:
1) The proportion of deaths from tubercu- losis was larger in Class C than in Class A.
2) As to arteriosclerotic heart disease, 28 ner cent of all deaths in Bristol were from this cause, but there was no consistent relation with social class in this study, although in each class the prouortionate mortality from this cause was high (from 25 to 34 per cent in males in the 15-74 Years age grouo). On the other hand. in all Lath Ameiicai c&s studied, the mortality due to this disease was lower, and the percent- age which resulted from this disease in Class A was invariably higher than in Class B (with one exception), just as the percentage in Class B was higher than in Class C (with no exception).
REFERENCES
American Iniestigaion of Mortality). (I) Puffer, R. R. and G. W. Griffith. Patterns of
Scientific Publication PAHO 151.1967. (2) Morris, J. N. Uses of Epidemiolo&. Edinburgh
and London: E. and S. Livingstone Ltd., Urban Mortality (Report of the Inter-
1964.
Countries with Special Reference to Arterio- sclerotic Heart Disease.” Bull Wld Hlth Orp (5) Puffer, R. R. and L. J. Verhoestraete. “Mortality
19:315-324, 1958.
from Cardiovascular Diseases in Various
(6) Whitney, J. S.: Death Rates by Occupations. New York: National Tuberculosis Association, 1934.
(7) Puffer, R. R. “Industrial and Occupational Environment and Health.” Milbank Mem Fund Quart 26(l): 22-40,1948.
(8) Epstein, F. H. “Hyperglycemia-A Risk Factor in Coronary Heart Disease.” (Paper presented in part to the Sixth National Symposium sponsored by the Cardiology Association of Southern Pennsylvania, 23-24 February 1967).
(3) McDonough, John R., Curtis G. Hames, S. C. StaIb, and G. Garrison. “Coronary Heat Disease among Negroes and Whites in Evans Countv. Georgia.” Chronic Dis 18: 443468. 1965.-’ -
62 BOLETIN DE LA OFICINA SANITARIA PANAMERICANA
A O-O A O-l A O-2 A O-3 B O-4 B O-5 B O-6 B O-7 A O-8 B O-9 B O-X B O-Y
Major Group 0. Professional, technical, and related workers: Architects, engineers, and surveyors
Chemists, physicists, geologists, and other physical scientists Biologists, veterinarians, agronomists, and related scientists Physicians, surgeons, and dentists
Nurses and midwives
Professional medical workers not elsewhere classified and medical technicians Teachers
Clergy and related members of religious orders Jurists
Artists, writers, and related workers
Draftsmen and science and engineering technicians not elsewhere classified Other professional, technical, and related workers
A 1-O A l-l
Major Group i. Administrative, executive, and managerial workers: Administrators and executive officials, government
Directors, managers, and working proprietors Major Group 2. Clerical workers:
B 2-O Bookkeepers and cashiers B 2-1 Stenographers and typists B 2-9 Other clerical workers
Major Group 3. Sales workers: A 3-O
B 3-1 B 3-2 c 3-3
Working proprietors, wholesale and retail trade
Insurance and real-estate salesmen, salesmen of securities and services, and auctioneers Commercial travelers and manufacturers’ agents
Salesmen, shop assistants, and related workers
Major Group 4. Farmers, fishermen, hunters, loggers, and related workers: B 4-O
c 4-l C 4-2 c 4-3 c 4-4
Farmers and farm managers
Farm workers not elsewhere classified Hunters and related workers
Fishermen and related workers Loggers and other forestry workers
Major Group 5. Miners, quarrymen, and related workers: c 5-o
c 5-1 C 5-2 c 5-9
Miners and quarrymen
Well drillers and related workers Mineral treaters
Miners, quarrymen, and related workers not elsewhere classified
B 6-O C 6-1 B 6-2 C 6-3
Major Group 6. Workers in transport and communication occupations: Deck officers, engineer officers, and pilots, ship
Deck and engine-room ratings (ship), barge crews and boatmen Aircraft pilots, navigators, and flight engineers
Drivers and firemen, railway engine
Appendix 1
International Standard Classification of Occupations
(Approved by the Ninth International Conference of Labour Statisticians, Geneva, 1957)
:
,
c
4
c
Y
v
Curie1 and Puffer - SOCIAL CLASS AND ARTERIOSCLEROTIC HEART DISEASE 63
C 64 B 6-5
! C 6-6
B 6-7 c 6-8 C 6-9
Drivers, road transport
Conductors and brakemen, railway
Inspectors, supervisors, traffic controllers, and dispatchers, transport Telephone, telegraph, and related telecommunication operators Postmen and messengers
Workers in transport and communication occupations not elsewhere classified
c
, 7-o
c 7-1 C 7-2 c 7-3
+ B 7-4
c 7-5 C 7-6 c 7-7
, c 7-8
c 7-9 B 8-O
Major Group 7/8. Craftsmen, production-process workers, and laborers not elsewhere classified: Spinners, weavers, knitters, dyers, and related workers
Tailors, cutters, furriers, and related workers
Leather cutters, lasters, and sewers (except gloves and garments) and related workers Furnacemen, drawers, rollers, moulders, and related metal-making and treating workers Precision-instrument makers, watchmakers, jewelers, and related workers
Toolmakers, machinists, plumbers, welders, platers, and related workers Electricians and related electrical and electronics workers
Carpenters, joiners, cabinet makers, coopers, and related workers Painters and paperhangers
C 8-l C 8-2 C 8-3 C 84 C 8-5 c 8-6 C 8-7 c 8-8 C 8-9
Bricklayers, plasterers, and construction workers not elsewhere classified Compositors, pressmen, engravers, bookbinders, and related workers Potters, kilnmen, glass and clay farmers, and related workers Millers, bakers, brewmasters, and related food and beverage workers Chemical and related process workers
Tobacco preparers and tobacco-product makers
Craftsmen and production-process workers not elsewhere classified Packers, labelers, and related workers
Stationary-engine and excavating and lifting equipment operators and related workers Longshoremen and related freight handlers
Laborers not elsewhere classified
Major Group 9. Service, sport, and recreation workers: c 9-o
c 9-1 c 9-2 c 9-3 c 94 c 9-5 B 9-6 B 9-7 B 9-8 c 9-9 Added:
Fiie fighters, policemen, guards, and related workers Housekeepers, cooks, maids, and related workers Waiters, bartenders, and related workers Building caretakers, cleaners, and related workers Barbers, hairdressers, beauticians, and related workers Launderers, dry cleaners, and pressers
Athletes, sportsmen, and related workers Photographers and related camera operators Embalmers and undertakers
Service, sport, and recreation workers not elsewhere classified
-? c x-o Defense services B x-l Students Excluded:
x-3 Retired
x-8 No definite occupation x-9 No information