HESSD
11, 9961–10000, 2014Hydrological drought forecasting and skill
assessment for the Limpopo river basin,
Southern Africa
P. Trambauer et al.
Title Page
Abstract Introduction
Conclusions References
Tables Figures
◭ ◮
◭ ◮
Back Close
Full Screen / Esc
Printer-friendly Version
Interactive Discussion
Discussion
P
a
per
|
Discus
sion
P
a
per
|
Discussion
P
a
per
|
Discussion
P
a
per
|
Hydrol. Earth Syst. Sci. Discuss., 11, 9961–10000, 2014 www.hydrol-earth-syst-sci-discuss.net/11/9961/2014/ doi:10.5194/hessd-11-9961-2014
© Author(s) 2014. CC Attribution 3.0 License.
This discussion paper is/has been under review for the journal Hydrology and Earth System Sciences (HESS). Please refer to the corresponding final paper in HESS if available.
Hydrological drought forecasting and skill
assessment for the Limpopo river basin,
Southern Africa
P. Trambauer1, M. Werner1,2, H. C. Winsemius2, S. Maskey1, E. Dutra3, and
S. Uhlenbrook1,4
1
UNESCO-IHE, Department of Water Science and Engineering, P.O. Box 3015, 2601 DA Delft, the Netherlands
2
Deltares, P.O. Box 177, 2600 MH Delft, the Netherlands
3
ECMWF, Shinfield Park, RG2 9AX, Reading, UK
4
Delft University of Technology, Water Resources Section, P.O. Box 5048, 2600 GA Delft, the Netherlands
Received: 4 August 2014 – Accepted: 14 August 2014 – Published: 28 August 2014
Correspondence to: P. Trambauer ([email protected])
HESSD
11, 9961–10000, 2014Hydrological drought forecasting and skill
assessment for the Limpopo river basin,
Southern Africa
P. Trambauer et al.
Title Page
Abstract Introduction
Conclusions References
Tables Figures
◭ ◮
◭ ◮
Back Close
Full Screen / Esc
Printer-friendly Version
Interactive Discussion
Discussion
P
a
per
|
Discus
sion
P
a
per
|
Discussion
P
a
per
|
Discussion
P
a
per
|
Abstract
Ensemble hydrological predictions are normally obtained by forcing hydrological mod-els with ensembles of atmospheric forecasts produced by Numerical weather predic-tion models. To be of practical value to water users, such forecasts should not only be sufficiently skilful, they should also provide information that is relevant to the decisions
5
end users make. The semi-arid Limpopo basin in Southern Africa has experienced severe droughts in the past, resulting in crop failures, high economic losses and the need for humanitarian aid. In this paper we address the seasonal prediction of hy-drological drought for the Limpopo river basin by testing three proposed forecasting systems (FS) that can provide operational guidance to dam operators and water
man-10
agers within the basin at the seasonal time scale. All three FS include a distributed hydrological model of the basin, and are forced with either (i) a global atmospheric model forecast (ECMWF seasonal forecast system – S4), (ii) the commonly applied Ensemble Streamflow Prediction approach (ESP) using resampled historical data, or (iii) a conditional ESP approach (ESPcond), which is conditional on the ENSO signal.
15
We determine the skill of the three systems in predicting drought indices and stream-flow. We also assess the skill of the model in predicting indicators that are meaningful to the local end users in the basin. FS_S4 shows moderate skill for all lead times (3, 4, and 5 months) and aggregation periods. FS_ESP also performs better than climatology for the shorter lead times, but with a lower skill than FS_S4. FS_ESPcond shows skill
20
in between the other two FS, though its skill is shown to be more robust. The skills of FS_ESP and FS_ESPcond reduce rapidly with increasing lead time. Both FS_S4 and FS_ESPcond show good potential for seasonal hydrological drought forecasting in the Limpopo river basin, which is encouraging in the context of providing better operational guidance to water users.
HESSD
11, 9961–10000, 2014Hydrological drought forecasting and skill
assessment for the Limpopo river basin,
Southern Africa
P. Trambauer et al.
Title Page
Abstract Introduction
Conclusions References
Tables Figures
◭ ◮
◭ ◮
Back Close
Full Screen / Esc
Printer-friendly Version
Interactive Discussion
Discussion
P
a
per
|
Discus
sion
P
a
per
|
Discussion
P
a
per
|
Discussion
P
a
per
|
1 Introduction
Climate change studies show evidence of an intensification of the global water cy-cle (Huntington, 2006), where extreme events including floods and droughts are ex-pected to become more frequent. The UNISDR Hyogo Framework of Action 2005– 2015 (UNISDR, 2005) describes early warning systems and action plans triggered on
5
the issuing of a warning, as one of the most effective strategies to mitigate the impacts of natural hazards. Operational forecasting of streamflow is already commonplace in several parts of the world, but the main focus is often on flood predictions. Although this approach has to date not been applied widely on drought predictions, the relevance and importance of drought forecasting is gaining attention of the research community.
Re-10
cently, Yuan et al. (2013) used the NCEP’s Climate Forecast System version 2 (CFSv2) combined with the Variable Infiltration Capacity (VIC) land surface model for seasonal drought prediction over Africa. They used both the Standardized Precipitation Index (SPI) and soil moisture as indices and the Brier Skill Score (BSS) to assess the prob-abilistic drought hindcast for 1982–2002. Their results show relatively good skill in the
15
dry season but limited skill in the rainy season. They indicate that CFSv2 precipitation is correlated with the observed precipitation over Southern Africa, but only accounts for 44–45 % of the variance of observations. They point out that for two extreme droughts CFSv2 predicted neutral condition or only a weak anomaly. Our study focuses on the Limpopo river basin and therefore the same type of analysis can be done at a higher
20
resolution and in a more detailed manner, by presenting different skill scores for diff er-ent hydrological drought indicators during the rainy season, and by comparing different forecasting systems in the basin. We focus on assessing the skill of the forecast in predicting indicators that are meaningful to the local end users in the basin.
The semi-arid Limpopo river basin, located in Southern-Africa, has experienced
se-25
HESSD
11, 9961–10000, 2014Hydrological drought forecasting and skill
assessment for the Limpopo river basin,
Southern Africa
P. Trambauer et al.
Title Page
Abstract Introduction
Conclusions References
Tables Figures
◭ ◮
◭ ◮
Back Close
Full Screen / Esc
Printer-friendly Version
Interactive Discussion
Discussion
P
a
per
|
Discus
sion
P
a
per
|
Discussion
P
a
per
|
Discussion
P
a
per
|
involve three forms of seasonal climate forecasts ranging from regional to local scale: Southern Africa Regional Climate Outlook Forum (SARCOF) climate outlooks, sea-sonal climate outlooks prepared by meteorological departments, and forecasts based on local knowledge applied in rural communities. Despite the seasonal forecasts being available in the basin, farmers seem to prefer to rely on the local indigenous and
tra-5
ditional knowledge drought forecasting systems. Forecasts include signs in (i) the sun, moon and wind; (ii) trees and plants; (iii) and insects, birds and animals (DEWFORA, 2013). For seasonal forecasts to be accepted by the local community there are sev-eral challenges that need to be addressed. End users should receive the information in a suitably understandable format at the time they need it for the forecast to be useful.
10
The highly technical information that is typically contained in the forecasts should then be translated to a comprehensible form before being disseminated and delivered to decision makers and farmers. Moreover, end users should be involved in the product verification by providing feedback to the forecasters (DEWFORA, 2012).
Hydrological drought forecasts aim for high hydrological predictability at a seasonal
15
time scale. Shukla et al. (2013) quantified the contribution of a good representation of initial hydrologic conditions (IHCs) and seasonal meteorological forecast (MF) to seasonal hydrological predictability at different forecast dates and lead times (1, 3, and 6 months) globally. They quantified the contributions of two components of the IHCs (soil moisture and snow water content) by conducting two experiments: ensemble
20
Streamflow Prediction (ESP) and Reverse-ESP. Their results show that for the Limpopo river basin the MF dominates the hydrological predictability during the wet season (fore-casts starting in October and January) for almost every lead time considered. Only for 1 month lead time for the forecast issued in October there seems to be a higher influ-ence of the IHCs to some extent. For the dry season, IHCs dominate the hydrological
25
HESSD
11, 9961–10000, 2014Hydrological drought forecasting and skill
assessment for the Limpopo river basin,
Southern Africa
P. Trambauer et al.
Title Page
Abstract Introduction
Conclusions References
Tables Figures
◭ ◮
◭ ◮
Back Close
Full Screen / Esc
Printer-friendly Version
Interactive Discussion
Discussion
P
a
per
|
Discus
sion
P
a
per
|
Discussion
P
a
per
|
Discussion
P
a
per
|
Yossef et al. (2013) also investigated the relative contribution of initial conditions and meteorological forcing to the skill of the global seasonal streamflow forecasting sys-tem FEWS-World, using the global hydrological model PCR-GLOBWB. They use ESP and Reverse-ESP to determine, for each location, the critical lead time after which the importance of the initial conditions is surpassed by that of the meteorological forcing.
5
They indicate that for semi-arid regions such as the Limpopo basin the initial conditions do not contribute much to the skill given the high sensitivity of the runoffcoefficient to rainfall variability. This would suggest that the predictability in semi-arid basis such as the Limpopo using ESP is limited with seasonal meteorological forecasts offering better skill.
10
In this study we introduce three dynamic forecasting systems based on a distributed hydrological model for the seasonal prediction of hydrological droughts for the semi-arid Limpopo basin in Southern Africa. All three forecasting systems include a distributed hydrological model of the basin, and are forced by either (i) a global atmospheric model (ECMWF seasonal forecast system S4), (ii) the Ensemble Streamflow Prediction
ap-15
proach (ESP) using resampled historical data, or (iii) a conditional ESP approach (ES-Pcond), which is conditional to the ENSO signal. The aim of this study is to assess the skill of the three systems in predicting meaningful drought indices for the Limpopo basin.
2 Methods and data
20
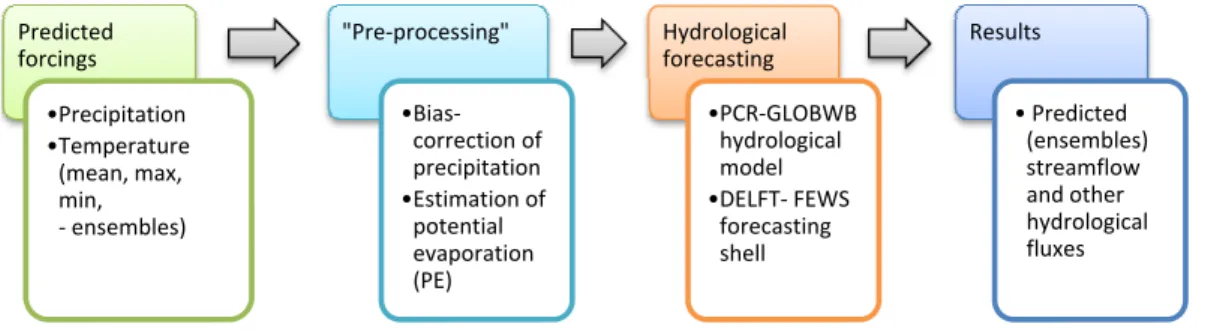
The approach followed in this study is summarized in Fig. 1. It starts with obtaining the meteorological seasonal forecast and pre-processing the data. The hydrological model (embedded in the Delft-FEWS forecasting shell, Werner et al., 2013) then simulates the forecasted seasonal hydrology obtaining predicted streamflows and other hydrological variables.
HESSD
11, 9961–10000, 2014Hydrological drought forecasting and skill
assessment for the Limpopo river basin,
Southern Africa
P. Trambauer et al.
Title Page
Abstract Introduction
Conclusions References
Tables Figures
◭ ◮
◭ ◮
Back Close
Full Screen / Esc
Printer-friendly Version
Interactive Discussion
Discussion
P
a
per
|
Discus
sion
P
a
per
|
Discussion
P
a
per
|
Discussion
P
a
per
|
2.1 Ensemble hydrological forecasting in the Limpopo river basin
2.1.1 Study area – Limpopo river basin
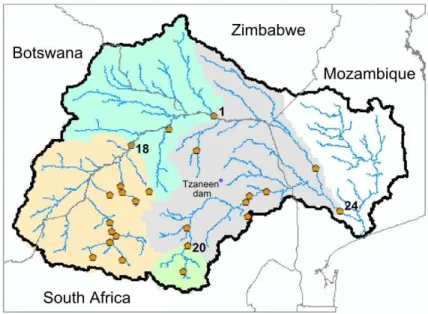
The Limpopo river basin is one of the larger basins in Southern Africa, with a drainage area of approximately 415 000 km2. It is shared by four riparian countries: South Africa (45 %), Botswana (20 %), Mozambique (20 %) and Zimbabwe (15 %) (Fig. 2). The
cli-5
mate in the basin is quite diverse. The upper part of the basin lies in the Kalahari Desert and is particularly arid. Towards the Indian Ocean the climate then changes to a hot dry steppe and finally to a tropical dry savannah. In the mountainous regions the climate is markedly cooler. Rainfall in the basin is seasonal, influenced by the movement of the intertropical convergence zone. It is, however, unreliable, causing frequent droughts
10
and floods also commonly occur in the rainy season. In the period 1980–2000, the Southern African region was hit by four major droughts in the seasons 1982/1983, 1986/1987, 1991/1992 and 1994/1995. This corresponds to an average frequency of a drought every four or five years, although the periodicity of droughts is not necessar-ily so predictable. It is estimated that during the 1991/1992 drought in Southern Africa
15
86 million people were affected, 20 million of whom were considered to be at serious risk of starvation (DEWFORA, 2011).
The annual rainfall in the basin averages some 530 mm yr−1, though the spatial vari-ation is significant, ranging from 200 to 1200 mm yr−1. Rainfall occurs mainly in the austral summer months (October to April) (LBPTC, 2010). As is common with
semi-20
arid and arid basins, runoffcoefficients in the Limpopo are very low, being only 4.3 % for the naturalised discharge and a mere 1.7 % for the observed discharge at Chokwe station in Mozambique, which is the most downstream station considered in this study. If abstractions are included then only 23 mm yr−1of the 539 mm yr−1precipitation aver-age for the basin upstream of Chokwe runs off. Consequently, hydrological modelling in
25
HESSD
11, 9961–10000, 2014Hydrological drought forecasting and skill
assessment for the Limpopo river basin,
Southern Africa
P. Trambauer et al.
Title Page
Abstract Introduction
Conclusions References
Tables Figures
◭ ◮
◭ ◮
Back Close
Full Screen / Esc
Printer-friendly Version
Interactive Discussion
Discussion
P
a
per
|
Discus
sion
P
a
per
|
Discussion
P
a
per
|
Discussion
P
a
per
|
uncertainty in the rainfall input could easily be larger than the runoffcoefficient (4.3 %) of the basin.
2.1.2 The forecasting system
Regional hydrological model
A finer resolution version (0.05◦×0.05◦) of the global PCR-GLOBWB hydrological
5
model is used. This is a continuous-time simulation, process based distributed model applied on a raster basis. PCR-GLOBWB is in many ways similar to other global hy-drological models, but it has several improved features, such as improved schemes for sub-grid parameterization of surface runoff, interflow and baseflow, a kinematic wave based routing for the surface water flow, dynamic inundation of floodplains and a
reser-10
voir scheme (van Beek and Bierkens, 2009; van Beek, 2008). The model was set up for the Limpopo basin with a spatial resolution of 0.05◦×0.05◦and the simulation is carried out on a daily time step. As the scope of this study is on the skill of the hydrological forecast, reservoirs are considered in a simple way. Cells with reservoirs in the model are considered as having a maximum storage volume. Releases to irrigation are taken
15
into consideration as a fixed monthly value and subject to availability, and the reservoir will spill whenever full. The reservoirs in the basin are mainly used for irrigation. For a more detailed description of the model set up for the Limpopo river basin the reader is referred to Trambauer et al. (2014b).
Delft-FEWS shell
20
The hydrological model was embedded in the Delft-FEWS (Flood Early Warning Sys-tem) open shell for forecasting purposes. The system is a sophisticated collection of modules designed for building a hydrological forecasting system customised to the specific requirements of an individual organisation. The philosophy of the system is to provide an open shell for managing the data handling and forecasting process. This
HESSD
11, 9961–10000, 2014Hydrological drought forecasting and skill
assessment for the Limpopo river basin,
Southern Africa
P. Trambauer et al.
Title Page
Abstract Introduction
Conclusions References
Tables Figures
◭ ◮
◭ ◮
Back Close
Full Screen / Esc
Printer-friendly Version
Interactive Discussion
Discussion
P
a
per
|
Discus
sion
P
a
per
|
Discussion
P
a
per
|
Discussion
P
a
per
|
shell incorporates a comprehensive library of general data handling utilities, allowing a wide range of external models to be integrated in the system through a published open interface. This allows existing simulation models and data streams to be turned into a comprehensive and reliable forecasting system (Werner et al., 2013).
Reference run for the period 1979–2010
5
The hydrological model was run in simulation mode for a 32 year period (1979–2010) with the ERA-Interim forcing meteorological data. ERA-Interim (ERAI) is the latest global atmospheric reanalysis produced by the European Centre for Medium-Range Weather Forecasts (ECMWF) and covers the period from January 1979 to the present date with a horizontal resolution of approximately 0.7◦ and 62 vertical levels. A
com-10
plete description of the ERAI product is available in Dee et al. (2011). The ERA-Interim precipitation data used in this study was corrected using the GPCP v2.1 (product of the Global Precipitation Climatology Project) to reduce the bias when compared to measured products (Balsamo et al., 2010). The GPCP v2.1 data is a monthly climatol-ogy provided globally at 2.5◦×2.5◦ resolution, covering the period from 1979 through
15
to September 2009. It combines the precipitation information available from several sources (satellite data, rain gauge data, etc.) into a merged product (Huffman et al., 2009; Szczypta et al., 2011). From September 2009 to December 2010, the mean monthly ERAI precipitation was corrected using a mean bias coefficient based on the climatology of the bias correction coefficients used for the period 1979–2009. While this
20
only corrects for systematic biases, this was the only option available at the time, as a new version of GPCP (version 2.2) was not available. This corrected version of pre-cipitation was also used in the production of the ERA-Interim/Land data set (Balsamo et al., 2013).
Additional to the precipitation, other meteorological parameters from the ERA-Interim
25
HESSD
11, 9961–10000, 2014Hydrological drought forecasting and skill
assessment for the Limpopo river basin,
Southern Africa
P. Trambauer et al.
Title Page
Abstract Introduction
Conclusions References
Tables Figures
◭ ◮
◭ ◮
Back Close
Full Screen / Esc
Printer-friendly Version
Interactive Discussion
Discussion
P
a
per
|
Discus
sion
P
a
per
|
Discussion
P
a
per
|
Discussion
P
a
per
|
this study the Hargreaves formula was used. This method requires less parameteri-zation than the Penman–Monteith formula, though it has the disadvantage that it is less sensitive to (uncertain) climatic input data, with a possibly reduction of dynam-ics and accuracy. However, it leads to a notably smaller sensitivity to errors in climatic inputs (Hargreaves and Allen, 2003) that are inherent to any meteorological forecast.
5
Moreover, the choice of the method used for the computation of the reference potential evaporation was shown to have minor effects on the results of the actual evaporation for Southern Africa, where actual evaporation is dominated by soil moisture availability (Trambauer et al., 2014a).
Initial conditions
10
The reference run provided the initial conditions for all forecasts. Initial conditions at the beginning of each month were saved in the Delft-FEWS data base, and subsequently used as “warm states” to start the forecasts when doing the retroactive forecast or hindcasts.
Time period of the simulations
15
An ensemble of meteorological hindcasts was first tested for the summer rainfall sea-son over Southern Africa for the period 1981 to 2010. Seasea-sonal forecasts in this study are issued seven months of the year (meaning the there are five months where we do not issue a forecast) so as to capture the rainy season. The predictive skill for drought is expected to be higher during the dry season and lower during the wet season given
20
that the hydro-climate has longer persistence during dry seasons (Yuan et al., 2013). Yuan et al. (2013) show the high skill contrast between dry and wet seasons in South-ern Africa.
In the hindcast, the first forecast of each season is issued in August and includes the seasonal (6 months) forecast from August to January. Similarly, seasonal forecasts are
25
HESSD
11, 9961–10000, 2014Hydrological drought forecasting and skill
assessment for the Limpopo river basin,
Southern Africa
P. Trambauer et al.
Title Page
Abstract Introduction
Conclusions References
Tables Figures
◭ ◮
◭ ◮
Back Close
Full Screen / Esc
Printer-friendly Version
Interactive Discussion
Discussion
P
a
per
|
Discus
sion
P
a
per
|
Discussion
P
a
per
|
Discussion
P
a
per
|
February, covering the period from February to July. All simulations are done at a daily time step.
2.2 Seasonal forecasting systems
All three forecasting systems use the same hydrological model of the basin, but forced with different meteorological forecasts. In the first system (FS_S4) the PCR-GLOBWB
5
hydrological model was forced with the output of a global atmospheric model, the ECMWF seasonal forecast system S4 (atmosphere–ocean coupled). The second fore-casting system (FS_ESP) is based on the Ensemble Streamflow Prediction (ESP, Day, 1985) procedure. In the ESP procedure the ensemble meteorological forecast is gen-erated with re-sampled historical meteorological data. The hydrological model is then
10
forced with this re-sampled data. A third system (FS_ESPcond) is proposed given that the El Niño–Southern Oscillation (ENSO) has a clear influence on the inter-annual cli-mate variability over the Limpopo river basin (Landman and Mason, 1999). This system is equivalent to the second system but the ESP is “conditional on the ENSO signal”: the ensemble meteorological forecast is generated with re-sampled historical
meteo-15
rological data but conditioned on the ENSO signal (Oceanic Niño Index, ONI). This is explained in full in Sect. 2.2.3.
2.2.1 ECMWF S4 meteorological forecasts (FS_S4)
Meteorological ensemble forecasts
Seasonal meteorological forecasts from the most recent seasonal forecasting system
20
at ECMWF (S4) are used to force the hydrological model. S4 is in operational use since November 2011, issuing 51 ensemble members with six months lead time. The atmospheric resolution is about 79 km with 91 vertical levels, and is fully coupled with an ocean model with a horizontal resolution of 1◦. The hindcast set is provided for cali-bration and verification purposes, covering a period of 30 years (1981 to 2010) with the
HESSD
11, 9961–10000, 2014Hydrological drought forecasting and skill
assessment for the Limpopo river basin,
Southern Africa
P. Trambauer et al.
Title Page
Abstract Introduction
Conclusions References
Tables Figures
◭ ◮
◭ ◮
Back Close
Full Screen / Esc
Printer-friendly Version
Interactive Discussion
Discussion
P
a
per
|
Discus
sion
P
a
per
|
Discussion
P
a
per
|
Discussion
P
a
per
|
same configuration as the operational forecasts but with only 15 ensemble members. Molteni et al. (2011) presents an overview of S4 model biases and forecasts perfor-mance, and Dutra et al. (2013, 2014) present an evaluation of S4 in seasonal forecasts of meteorological droughts. They found that S4 derived meteorological drought forecast over South Africa were skilful up to four months lead time for SPI-6 in April.
5
Climatological bias correction of seasonal forecasts of precipitation
Mean biases and drifts in the seasonal forecasts of precipitation can have a detrimental influence on the hydrological forecasts. Therefore, a simple climatological bias correc-tion, based on monthly means, was applied to the seasonal forecasts in the form:
P′
m,l =αm,lPm,l (1)
10
whereP and P′ are the original and corrected seasonal forecasts of precipitation, re-spectively, α is a multiplicative correction factor and the subscripts m and l are the calendar month (1 to 12, of the initial forecast date) and lead time (0 to 5 months), respectively. The correction factor is given by the ratio:
15
αm,l =Pbasem∗ /Pm,l (2)
wherePbasem∗ is the multi-annual mean of precipitation of the base dataset for a particular calendar monthm∗
(m∗
=m+l), andPm,l is the multi-annual and ensemble mean of the forecasts for a particular monthm and lead time l. The base data set used was
20
ERA-Interim corrected with GPCP to be consistent with the baseline simulation period. The correction factorα is limited to a reasonable range (0.1 and 10), and is linearly interpolated from monthly values to daily assuming it corresponds to day 15 of the particular month, and Eq. (1) is applied to daily values of precipitation. This is a simple bias correction that only guarantees that the mean forecast climate is similar to the
25
HESSD
11, 9961–10000, 2014Hydrological drought forecasting and skill
assessment for the Limpopo river basin,
Southern Africa
P. Trambauer et al.
Title Page
Abstract Introduction
Conclusions References
Tables Figures
◭ ◮
◭ ◮
Back Close
Full Screen / Esc
Printer-friendly Version
Interactive Discussion
Discussion
P
a
per
|
Discus
sion
P
a
per
|
Discussion
P
a
per
|
Discussion
P
a
per
|
2.2.2 ESP meteorological forecasts (FS_ESP)
A common approach to seasonal forecast is to use the Ensemble Streamflow Predic-tion (ESP) procedure. ESP predicts future streamflow from the current initial condiPredic-tions (warm state) in the hydrological model with re-sampled historical meteorological data (ERA-Interim corrected with GPCP observed meteorology from the last 31 years in this
5
study). The procedure assumes that meteorological events that occurred in the past are representative of events that may occur in the future (Day, 1985). Although ESP is normally used in the absence of a seasonal forecast, in this study we use it to compare the skill of the FS_ESP with that of the FS_S4. Moreover, a comparison of these two forecasts may give an indication of what influences the predictability. ESP represents
10
forecast uncertainty due to boundary forcing uncertainties only (Wood and Lettenmaier, 2008) and thus allows measuring the skill that can be expected only from initial states. In the FS_ESP hindcast, the weather of the year in which the forecast starts is excluded from the ensemble to allow for a fair estimate of the forecast uncertainty. The FS_ESP therefore includes 30 (31 minus 1) years in the ensemble.
15
2.2.3 Conditional ESP meteorological forecasts (FS_ESPcond)
The El Niño–Southern Oscillation (ENSO) is clearly related to inter-annual climate vari-ability over the Limpopo river basin. In Southern Africa meteorological droughts tend to happen in the December to March rainy season after onset of an El Niño event (Thomson et al., 2003). However, it is not always the case that this happens. Thomson
20
et al. (2003) recorded a 120 % increase in probability of drought disaster in the year after an El Niño onset. Therefore, this system is similar to FS_ESP but the ESP is “conditional to ENSO signal”. This ESP procedure accounts for further information of the climate system: the ENSO state.
For this forecasting system we used the post-ESP weighting technique described in
25
HESSD
11, 9961–10000, 2014Hydrological drought forecasting and skill
assessment for the Limpopo river basin,
Southern Africa
P. Trambauer et al.
Title Page
Abstract Introduction
Conclusions References
Tables Figures
◭ ◮
◭ ◮
Back Close
Full Screen / Esc
Printer-friendly Version
Interactive Discussion
Discussion
P
a
per
|
Discus
sion
P
a
per
|
Discussion
P
a
per
|
Discussion
P
a
per
|
members from ESP. The technique is summarized here for the forecast of the six month Standardised RunoffIndex (SRI-6):
1. Compute a vector of absolute differences between the value of the SON Niño – 3.4 index (Oceanic Niño Index, ONI) in the forecast year and those of all the other years and sort it from lowest to highest.
5
2. Compute a vector of weights for each member of the ESP ensemble by defining two parameters: a distance-sensitive weighting parameter (λ) and a parameter (α) that defines the k nearest neighbours used. Higher λ give more weight to ensemble members with values of SON ONI closer to that of the forecast year. Higher α restricts attention to the k=n/α elements in the sorted vector. The
10
forecast year’s member has a weight of zero.
3. Calculate the probability assigned to each ensemble member.
The parameters λand α can be optimized for each case study or sub-basin. A case withλ=α=1 is the traditional equal weighting scheme applied to ESP forecasts, with all ensemble members considered with equal weight. Ifα=1 andλvaries, all ensemble
15
members are considered, but these have non-zero weights that depend on the absolute distance between the ONI of the forecast year and the ONI of the year of the ensemble member. If λ=1 and α varies only the nearest k ensemble members to the forecast year are considered in the ensemble, but they are all weighted equally. This case is similar to the approach applied by Hamlet and Lettenmaier (1999) for the Columbia
20
river, where they restricted the ensemble members to those years that were similar in terms of the ENSO phase and the Pacific decadal oscillation phase. However, this restriction may result in ensembles with only few members, resulting in forecasts that are very sensitive to sampling errors (Brown et al., 2010). In the last case, where both
α and λ vary, weights are assigned only to the k nearest ensemble members based
25
HESSD
11, 9961–10000, 2014Hydrological drought forecasting and skill
assessment for the Limpopo river basin,
Southern Africa
P. Trambauer et al.
Title Page
Abstract Introduction
Conclusions References
Tables Figures
◭ ◮
◭ ◮
Back Close
Full Screen / Esc
Printer-friendly Version
Interactive Discussion
Discussion
P
a
per
|
Discus
sion
P
a
per
|
Discussion
P
a
per
|
Discussion
P
a
per
|
For the FS_ESPcond we chose to keep the parameters constant (λ=2 andα=1) given that the optimal selection of parameters would vary for each sub-basin. Perform-ing an in-depth selection of parameters for each sub basin is out of the scope of this study. Here we usedλ=2 andα=1, meaning that all ensemble members have a non-zero probability of being included in the ensemble, with that probability based on the
5
distance between the ENSO indexes and the distance sensitive weighting parameter (linear forλ=2). For each year, we construct an ensemble meteorological forecast of 30 members to be consistent with FS_ESP. The selection of the members is based on a resampling with replacement procedure given the probability assigned to each mem-ber. The ONI indexes for the period 1979–2010 were retrieved from NOAA (2014).
10
We also used this procedure for forecast of SRI-4 (JFMA SRI). FS_ESPcond always uses the latest ONI index available before the issue of the forecast, so for the forecast issued in January, which corresponds to a three months lead time, FS_ESPcond uses the OND ONI. Similarly, for the forecast issued in December, which corresponds to a four months lead time, FS_ESPcond uses the SON ONI, and the forecast issued in
15
November (five months lead time) makes use of the ASO ONI.
2.3 Assessing skill of the forecasts
2.3.1 Skill scores
Standard verification skill scores are selected to measure the skill of the forecast ensembles in predicting drought indicators. In this study we use the Standardized
20
Runoff Index (SRI) for the characterization of hydrological droughts. This indicator is explained in the following section. Forecasts are verified against the reference run and the resulting skills are established relative to sample climatology. Cloke and Pappenberger (2008) recommend the use of several verification measures in the same analysis so that the quality of the forecast can be assessed rigorously. We selected
25
HESSD
11, 9961–10000, 2014Hydrological drought forecasting and skill
assessment for the Limpopo river basin,
Southern Africa
P. Trambauer et al.
Title Page
Abstract Introduction
Conclusions References
Tables Figures
◭ ◮
◭ ◮
Back Close
Full Screen / Esc
Printer-friendly Version
Interactive Discussion
Discussion
P
a
per
|
Discus
sion
P
a
per
|
Discussion
P
a
per
|
Discussion
P
a
per
|
reliability or bias, and the brier score (BS) accounts both for reliability and sharpness (Renner et al., 2009).
TheROC (relative operating characteristic, or receiver operating characteristic) dia-gram measures the ability of the forecast to discriminate between two alternative out-comes. It plots the hit rate or probability of detection (POD) vs. the false alarm rate
5
or probability of false detection (POFD). It is not sensitive to bias in the forecast, so says nothing about the reliability. It is conditioned to the observations. In summary, it indicates the ability of the forecast to discriminate between events and non-events given a certain event threshold (WWRP/WGNE, 2013). The area under a ROC curve (ROCS) is used as a score. ROCS can take values from 0 to 1, with a value of 0.5
10
indicating no skill and a value of 1 representing a perfect score. Values lower than 0.5 indicate negative skill. ROC curves measure how good forecasts are in the context of a very simple decision-making model, and are thus better suited to measure how good forecasts are from the perspective of the user than many other commonly used measures (Tveito et al., 2008).
15
The Brier Score (BS [0–1]) measures the mean squared probability error and
rep-resents the magnitude of the probability forecast errors, with a perfect score of zero.
TheBrier Skill Score (BSS [−∞to 1]) measures the improvement of the probabilistic
forecast relative to sample climatology and indicates what the relative skill of the prob-abilistic forecast is over that of the climatology, in terms of predicting whether or not an
20
event occurred (WWRP/WGNE, 2013).
Therank histogram is used to evaluate whether the forecast ensembles apparently
include the observations being predicted as equiprobable members. This histogram reveals deficiencies in ensemble calibration, or reliability (Wilks, 2011).
2.3.2 Standardized RunoffIndex (SRI)
25
HESSD
11, 9961–10000, 2014Hydrological drought forecasting and skill
assessment for the Limpopo river basin,
Southern Africa
P. Trambauer et al.
Title Page
Abstract Introduction
Conclusions References
Tables Figures
◭ ◮
◭ ◮
Back Close
Full Screen / Esc
Printer-friendly Version
Interactive Discussion
Discussion
P
a
per
|
Discus
sion
P
a
per
|
Discussion
P
a
per
|
Discussion
P
a
per
|
and Wood, 2008). To compute SRI the runofftime series is fitted to a probability den-sity function (a gamma distribution) and the function is used to estimate the cumulative probability of the runoffof interest for a specific month and temporal scale. The cumu-lative probability is then transformed to the standardised normal distribution with mean zero and variance one (Shukla and Wood, 2008).
5
2.3.3 Estimating uncertainty in the skill scores
Given the small sample sizes resulting from the verification of seasonal means, a boot-strap approach is used to estimate the confidence intervals around the ROCS. The idea behind the bootstrap is to treat a finite sample at hand as similarly as possible to the unknown distribution from which it was drawn, which in practice leads to resampling
10
with replacement (Wilks, 2011).
For the FS_S4 and FS_ESP the bootstrap is performed by resampling the original ensemble with replacement 1000 times and computing the skill score for each of the resampled ensembles. For the FS_ESPcond the bootrstrap follows the same theory but is computed slightly differently. In this case the bootstrap is achieved by creating
15
the ensemble 1000 times based on the computed probability vector and computing the skill score from each created ensemble. The 90 % confidence interval is estimated from the 5 and 95 percentiles of the 1000 ROCS values.
2.4 Assessing spatial hydrological indicators
ROCS and BSS are computed for the spatially distributed indicator Root Stress (RS)
20
to assess the skill of the forecast in predicting agricultural drought indicators. For each grid cell, a drought is defined to occur when the Root stress is higher than the 70 percentile of the observed values for that month. An advantage of defining the threshold as a percentile of the observed sample as proposed by Roulin (2007) is that it assures a sufficiently large enough number of events to verify and also allows for comparison
25
HESSD
11, 9961–10000, 2014Hydrological drought forecasting and skill
assessment for the Limpopo river basin,
Southern Africa
P. Trambauer et al.
Title Page
Abstract Introduction
Conclusions References
Tables Figures
◭ ◮
◭ ◮
Back Close
Full Screen / Esc
Printer-friendly Version
Interactive Discussion
Discussion
P
a
per
|
Discus
sion
P
a
per
|
Discussion
P
a
per
|
Discussion
P
a
per
|
Moreover, it is interesting to evaluate the skill of the model in predicting indicators that are meaningful to the local end users in the basin. Irrigation is the major water use in the Limpopo basin. The Tzaneen Dam, on the Groot Letaba River (see location in Fig. 3), currently allocates a total of 128 million m3of water per year from which 105 million m3 are designated to irrigation. However, the actual amount of water made available for
5
the irrigation sector may be restricted depending on the water level in the dam as a percentage of the full capacity (DWA, 2013). Therefore, the forecasted anomaly of the water level in the reservoir is a decision variable that can give an indication to the water managers of the percentage of irrigation demand that can be covered during the season.
10
An analysis of the historical time series of the Tzaneen dam levels together with the curtailment rules of the dam indicated that a 20 % curtailment in the irrigation sector is applied when water levels in the dam go below the 50 percentile in the water levels (in % of the capacity of the dam). Similarly, a 65 % curtailment in the irrigation sector is applied when water levels in the dam go below the 37.5 percentile and a 90 %
cur-15
tailment in the irrigation sector along with a 30 % curtailment in the urban sector when the water levels are below the 12 percentile. ROCS and BSS are then computed to assess the skill of the forecast in predicting the water levels in the dams to be lower than a certain percentage of its full capacity. Although the actual operation of the dam is quite a bit more complex, this can be interpreted as an assessment of the skill of the
20
forecast in predicting curtailments to the irrigation sector.
3 Results
The following section outlines the results when applying the different types of forcing into the hydrological model over the 30 year retroactive period from 1981 to 2010. The analysis is carried out for different verification periods and lead times as the forecast
25
HESSD
11, 9961–10000, 2014Hydrological drought forecasting and skill
assessment for the Limpopo river basin,
Southern Africa
P. Trambauer et al.
Title Page
Abstract Introduction
Conclusions References
Tables Figures
◭ ◮
◭ ◮
Back Close
Full Screen / Esc
Printer-friendly Version
Interactive Discussion
Discussion
P
a
per
|
Discus
sion
P
a
per
|
Discussion
P
a
per
|
Discussion
P
a
per
|
take place from November to February. The mean runoffseason and high runoff sea-son, however, lag behind the rainy season by one or two months, occurring in general from December to May and from January to April, respectively.
3.1 Skill of seasonal streamflow prediction
This section presents the skill expressed in the selected skill scores of the seasonal
5
streamflow prediction for the three forecast systems described (FS_S4, FS_ESP, and FS_ESPcond) for Station 24 (Chókwe), Station 1, Station 18 and Station 20 in the Limpopo river basin (see Fig. 3 for the station locations). Station 24 is the one with the largest drainage area in the basin with available discharge data. Four stations (high-lighted in Fig. 3) with diverse drainage areas were selected to assess the influence of
10
the spatial scale and forecast location on the quality of the forecasts. In these stations the performance of the hydrological model is found to be satisfactory based on the evaluation measures and ranges proposed by Moriasi et al. (2007). These results are presented by Trambauer et al. (2014b).
The ROC diagram is used here as a tool for drought detection and determination
15
of the skill of categorical forecasts. Forecasted streamflows are transformed to the hy-drological drought indicator SRI and forecasts of drought are analysed by considering drought conditions to occur for SRI≤ −0.5 (mild to moderate drought). The value of −0.5 was chosen as it corresponds to the 30 percentile in runoff and it is therefore a good compromise between not capturing all negative anomalies and having a
suf-20
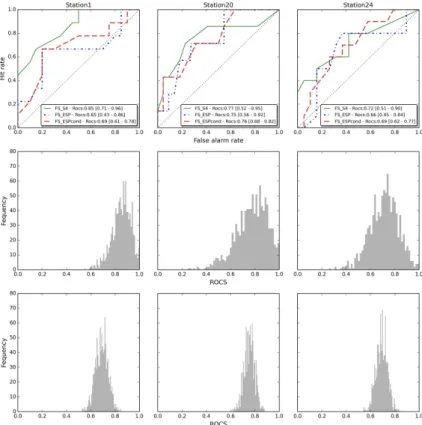
ficient amount of samples for the analysis. Figure 4 (upper plots) presents the ROC diagram for the 6 months SRI≤ −0.5 (verification period from December to May,
SRI-6 corresponding to May) in three of the four stations considered, for a lead time of five months (the forecast is issued in December). December is the only start time of the forecast that captures the whole 6 months main runoffseason (from December to
25
HESSD
11, 9961–10000, 2014Hydrological drought forecasting and skill
assessment for the Limpopo river basin,
Southern Africa
P. Trambauer et al.
Title Page
Abstract Introduction
Conclusions References
Tables Figures
◭ ◮
◭ ◮
Back Close
Full Screen / Esc
Printer-friendly Version
Interactive Discussion
Discussion
P
a
per
|
Discus
sion
P
a
per
|
Discussion
P
a
per
|
Discussion
P
a
per
|
results in the median ROCS. Results from the FS_ESPcond show for all stations a nar-rower 90 % confidence interval when compared with the other two forecasting systems considered (see middle and lower plots in Fig. 4), thus suggesting that FS_ESPcond is more robust. Histograms of ROCS for FS_ESP are not shown as these are similar to those of FS_S4.
5
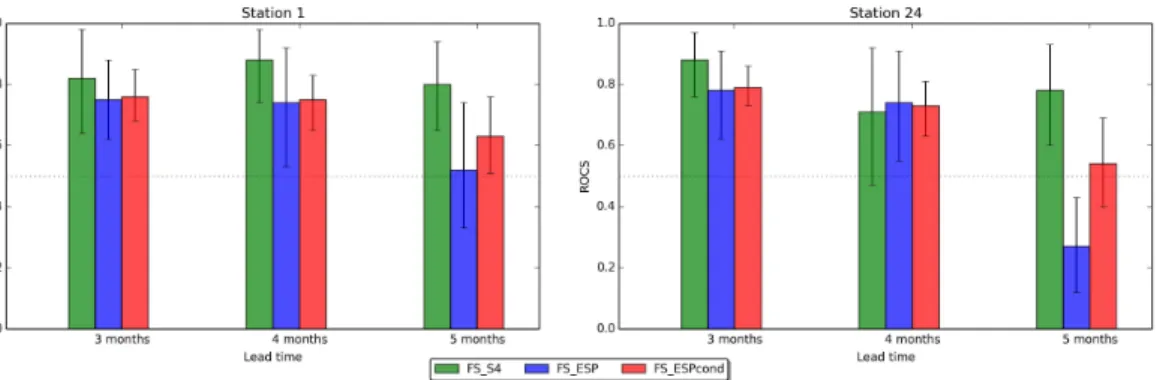
The ROCS of the FS_S4 in predicting SRI-6≤ −0.5 are generally quite high (around 0.8), but some lower values such as 0.72 (this for the station with largest contributing area) were observed (Fig. 4). FS_ESP generally shows the lowest skills, with the skills of FS_ESPcond in between FS_ESP and FS_S4. The verification was also done for forecasts issued for the 4 months period JFMA (high-runoff season) with forecasts
10
issued from November to January, respectively. Figure 5 present the ROCS for the 4 monthly SRI (SRI-4 in April)≤ −0.5 for three different lead times (three to five months) and two stations.
For the high runoffseason SRI-4, similar results to those of SRI-6 are observed. In almost every case FS_S4 shows higher skill than that of FS_ESP and FS_ESPcond.
15
The skill of the forecasts tend to decrease with lead time, especially for FS_ESP and FS_ESPcond, which do not show any skill at the 5 months lead time. However, the skill of FS_S4 for the 5 months lead time is still good. The skill score verification for SRI-1 for the same 4 months period January–April (not shown) shows once more that the FS_S4 is more skilful than the other two forecasting systems. The smaller sub-basins
20
(18 and 20) present lower skill for SRI-4 for the three forecasting systems, and while sub-basin 18 still presents some skill for all the three FS, sub-basin 20 only presents some skill for the FS_S4 for every lead time. In general for all locations, the skill of the FS_S4 reduces slightly with lead time, while the skill of both FS_ESP and FS_ESPcond reduce more rapidly with lead time. A curious fact is that for a few stations (1, 18) both
25
HESSD
11, 9961–10000, 2014Hydrological drought forecasting and skill
assessment for the Limpopo river basin,
Southern Africa
P. Trambauer et al.
Title Page
Abstract Introduction
Conclusions References
Tables Figures
◭ ◮
◭ ◮
Back Close
Full Screen / Esc
Printer-friendly Version
Interactive Discussion
Discussion
P
a
per
|
Discus
sion
P
a
per
|
Discussion
P
a
per
|
Discussion
P
a
per
|
However, the differences are not statistically significant and this can be due to sampling errors.
Rank histograms for every station and lead time together with the results of the Kolmogorov–Smirnov test showed that for the three forecasting systems, uniformity of the distribution cannot be rejected, indicating the forecasts are reliable. Figure 6
5
presents the rank histograms of SRI-6 for Station 1 for the three forecasting systems as an example.
3.2 Skill of spatial hydrological indicators
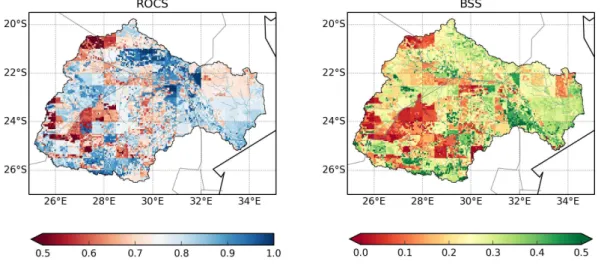
Figure 7 presents the ROCS and the BSS of the FS_S4 in predicting agricultural drought conditions, i.e. in predicting aggregated Root Stress (RS) during the 6 monthly
10
period DJFMAM to be higher than the 70 percentile. Yuan et al. (2013) show that the annual cycle of soil moisture in Southern Africa (simulated by the VIC model) lags be-hind the precipitation. Figure 7 shows that the skill of the FS_S4 forecast in predicting agricultural droughts is higher than climatology (ROCS>0.5, BSS>0) throughout the entire basin.
15
To assess the skill of the seasonal forecast in predicting a specific decision variable in the Limpopo river basin, we calculated the skill of the forecast in predicting water levels conditions in the reservoir that would result in curtailment to the irrigation sec-tor. The availability of water is represented in each cell by the water level. In the cells corresponding to dams, the water level is a surrogate for the storage and is described
20
as a percentage of the full storage capacity of the dam. Figure 8 presents the ROCS and the BSS of the FS_S4 in predicting water levels during the 6 monthly period DJF-MAM to be lower than the 50 and 37.5 percentiles, based on the analysis described in Sect. 2.4. The figure shows that the skill of the FS_S4 forecast in predicting low water levels is higher than climatology (ROCS>0.5, BSS>0) throughout the basin. The skill
25
HESSD
11, 9961–10000, 2014Hydrological drought forecasting and skill
assessment for the Limpopo river basin,
Southern Africa
P. Trambauer et al.
Title Page
Abstract Introduction
Conclusions References
Tables Figures
◭ ◮
◭ ◮
Back Close
Full Screen / Esc
Printer-friendly Version
Interactive Discussion
Discussion
P
a
per
|
Discus
sion
P
a
per
|
Discussion
P
a
per
|
Discussion
P
a
per
|
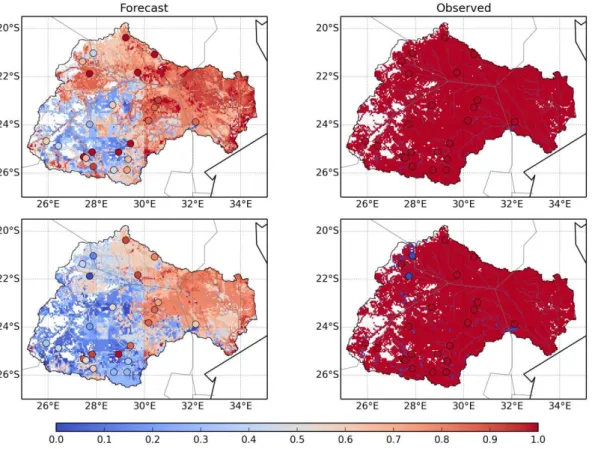
to the higher memory introduced by the reservoir’s storage capacity with respect to the streams. Figure 9 presents the forecast probability of water levels to be lower than the 50 and 37.5 percentiles during the season December 1991–May 1992, the driest season in the last 30 years, as an example. The forecast is issued in December 1991.
The forecast probability of water levels in the reservoirs being lower than the 50 and
5
37.5 percentiles can be interpreted as the forecast probability of a curtailment of 20 % and 65 % respectively in the irrigation sector during the season. For several reservoirs in the basin the FS_S4 forecast issued in December 1991 predicted a high probability of curtailment to the irrigation sector during the season December 1991–May 1992. This can be observed in Fig. 9. Records of the Tzaneen dam (DWA, 2013) show that
10
from the beginning of 1992 the irrigation quota allocation started to drop significantly and the water levels of the dam at the end of 1992 reached levels of only 10 % of the FSC. The levels continued to drop resulting in irrigation allocations of less that 5 % of the quota by the end of 1995.
3.3 Analysis of a specific event
15
Yuan et al. (2013) note that “The major source of seasonal forecast predictability comes from the ocean, and the strongest signal is the El Niño Southern Oscillation (ENSO)”. Given that the ECMWF S4 is influenced by the ENSO signal, it is interesting to anal-yse how the FS_S4 predicts streamflow in the onset of two clear El Niño years. The 1997/1998 El Niño year is described in Thomson et al. (2003) as the largest this
cen-20
tury, predicted with a high degree of certainty. Although many of the climate anomalies typical of an El Niño event took place around the globe, the devastating drought that was feared for in Southern Africa did not happen (Thomson et al., 2003). For this anal-ysis another year was selected that had a less strong ONI but that did result in a severe drought (1982/1983). Figure 10 presents the ensemble seasonal streamflow prediction
25
HESSD
11, 9961–10000, 2014Hydrological drought forecasting and skill
assessment for the Limpopo river basin,
Southern Africa
P. Trambauer et al.
Title Page
Abstract Introduction
Conclusions References
Tables Figures
◭ ◮
◭ ◮
Back Close
Full Screen / Esc
Printer-friendly Version
Interactive Discussion
Discussion
P
a
per
|
Discus
sion
P
a
per
|
Discussion
P
a
per
|
Discussion
P
a
per
|
the value below which 30 % of the observations are found. The observed streamflow for that season and the forecast ensemble mean are also shown.
Figure 10 shows that in October the predictions from the forecasting system FS_S4 for El Niño seasons of 1982/1983 and 1997/1998 were relatively similar (see Fig. 10, upper panels) even though the 1997 JAS ONI was notably higher than the 1982 JAS
5
ONI. The updated forecast in December, however, shows a different situation: while the forecast for the 1982/1983 season point towards very dry conditions, the forecast of the 1997/1998 season indicate near-normal conditions. Yet, the 1997 SON ONI is markedly higher than the 1982 SON ONI. This indicates that even though the S4 forecasting system is influenced by the Sea Surface Temperatures over the Niño-3.4 region, the
10
precipitation and temperature forecasts over the Limpopo region is not only constrained by the SST evolution, but results from the atmospheric circulation response to different climate forcings.
4 Discussion
The performance of the three hydrological forecasting systems constructed with the
15
same hydrological model and different meteorological ensemble forecasts were evalu-ated by means of widely used probabilistic verification skill scores such as the ROC dia-gram and the rank histodia-gram. Among the forecasting systems considered in this study, FS_ESP can be said to be the most traditional. Such traditional approaches for hydro-logical forecasts have relied on historical observations of the meteorohydro-logical conditions,
20
without considering meteorological forecasts. In ensemble probabilistic forecasting, the ESP approach, implicitly accounting for hydrologic persistence and historical variability of climate is normally used (Brown et al., 2010). FS_S4 is a more complex forecast-ing system as it requires as forcforecast-ing the outputs of a seasonal meteorological forecast system, which are complex numerical models and resource intensive. FS_ESPcond,
25
HESSD
11, 9961–10000, 2014Hydrological drought forecasting and skill
assessment for the Limpopo river basin,
Southern Africa
P. Trambauer et al.
Title Page
Abstract Introduction
Conclusions References
Tables Figures
◭ ◮
◭ ◮
Back Close
Full Screen / Esc
Printer-friendly Version
Interactive Discussion
Discussion
P
a
per
|
Discus
sion
P
a
per
|
Discussion
P
a
per
|
Discussion
P
a
per
|
Given that the Limpopo region is known to be affected by ENSO and droughts tend to occur during El Niño years, the forecast ensemble was constructed by assigning weights to the different ensemble traces based on the El Niño index.
The skill evaluation of the seasonal forecasts is limited by the use of model data as verification, i.e. we verify our forecasts against the baseline simulation, which was
5
also used to provide the initial conditions to the forecasts. This approach allows for the detailed spatial evaluation of the skill of the forecasts, but can potentially hide lim-itations of the modeling system. This is the same approach as taken in Yossef et al. (2013), Winsemius et al. (2014), Shukla et al. (2013), and Renner et al. (2009). There-fore, these skill results should be interpreted as the upper limit of real predictability of
10
the current system. Results of the seasonal streamflow prediction show that for every lead time FS_S4 is skilful in predicting SRI-6, SRI-4, and SRI-1 during the summer rainy season, while for both other FS, the skill is lower and reduces more rapidly with lead time. This means that the complex S4 seasonal forecasting system adds value to the hydrological predictions compared to the climatology-based forecasting systems,
15
as well as the ENSO mode conditioned climatology forecast systems. This was also observed during a specific event where expected anomalies due to El Nino did not ma-terialize, but FS_S4 detected this. The skill reduces when going from SRI-6 to SRI-4 and SRI-1. These could be expected given that the higher variability for shorter aggre-gation periods is expected to result in lower skill. The skill from FS_ESP is lower than
20
that of FS_S4 in almost every case and the skill of FS_ESPcond is in general between the other two. For SRI-4, FS_ESP and to a lesser extent FS_ESPcond do not show any skill for 5 months lead time at none of the stations considered.
As expected, skill of all the forecasts tend to decrease with lead time. This is, how-ever, especially the case for FS_ESP and FS_ESPcond where the decrease in skill
25
HESSD
11, 9961–10000, 2014Hydrological drought forecasting and skill
assessment for the Limpopo river basin,
Southern Africa
P. Trambauer et al.
Title Page
Abstract Introduction
Conclusions References
Tables Figures
◭ ◮
◭ ◮
Back Close
Full Screen / Esc
Printer-friendly Version
Interactive Discussion
Discussion
P
a
per
|
Discus
sion
P
a
per
|
Discussion
P
a
per
|
Discussion
P
a
per
|
place over larger basins, smoothing out uncertainties in space. This indicates that the memory in the hydrology (storage in groundwater, reservoirs, channels and wetlands) contributes to the predictability up to a lead time of 2 to 4 months. For longer lead times, the meteorological forcing dominates the predictability of the system. The crit-ical lead time after which the importance of the meteorologcrit-ical forecast exceeds that
5
of the initial conditions depends on the location and size of the basin and should be analysed for each sub-basin of interest. Rank histograms for every station and lead time indicate that the three forecast systems are reliable given that uniformity of the distribution cannot be rejected.
What does the analysis mean to end users?
10
The high predictability of FS_S4 for all lead times and aggregation periods of SRI is encouraging given that such a system, if made operational, may provide end users with sufficient time to decide upon measures to take in anticipation. For example they might decide to change the cropping date or the cropping area if they expect not to have enough water to fulfil the crop requirements. Therefore, there is added value in
15
using a seasonal meteorological forecast (ECMWF S4) to force the hydrological fore-casting system when compared to the conventional ESP. The higher skill of the FS_S4 and FS_ESPcond compared to that of the FS_ESP for every lead time is in line with the study of Shukla et al. (2013), who show that for the for the Limpopo river basin the meteorological forecast dominates the hydrological predictability for the wet
sea-20
son for almost every lead time considered. Only for 1 month lead time for the forecast issued in October they found a higher influence of the hydrological initial conditions to some extent. Moreover, Yossef et al. (2013) indicate that for semi-arid regions the ini-tial conditions do not contribute much to the skill given the high sensitivity of the runoff
coefficient to rainfall variability.
25
HESSD
11, 9961–10000, 2014Hydrological drought forecasting and skill
assessment for the Limpopo river basin,
Southern Africa
P. Trambauer et al.
Title Page
Abstract Introduction
Conclusions References
Tables Figures
◭ ◮
◭ ◮
Back Close
Full Screen / Esc
Printer-friendly Version
Interactive Discussion
Discussion
P
a
per
|
Discus
sion
P
a
per
|
Discussion
P
a
per
|
Discussion
P
a
per
|
Indicating the probability of curtailment to the irrigation sector during the following sea-son is an example of providing a forecast in an understandable format that is useful to the end users. If they are told that there is a high probability of having a high curtail-ment to the water for irrigating their crops during the following season, users would have a clear idea of what is the best practice for that situation. Improvements in forecasting
5
skill could be achieved through better meteorological predictions or better estimation of initial conditions (Yossef et al., 2013). Whether the forecasts indeed have value will depend on the costs of decisions made in response to the forecast, losses in case of a wrong decision and the gain in case of a good decision. This should be further analysed in a continuation of this study.
10
It is recommended that as a next step the forecast skill of the FS_S4 and FS_ESPcond is assessed in an actual forecasting mode for the following summer sea-son. The seasonal meteorological forecast from S4 can be obtained in real-time, and initial conditions for the forecasts could be better estimated through data assimilation. Despite the limitations of FS_S4 (access to real time atmospheric-ocean seasonal
fore-15
casts, and their quality) and FS_ESPcond (depending on the calibration and reduced skill in long lead times) both systems show potential for seasonal hydrological drought forecasting in the Limpopo river basin to provide operational guidance to users.
5 Conclusions
We evaluated the performance of three forecasting systems (FS_S4, FS_ESP, and
20
FS_ESPcond) in the Limpopo river basin. These systems make use of the same hy-drological model and are forced with three different meteorological ensemble fore-casts (two of which are based on resampled climatological records, FS_ESP and FS_ESPcond; and one based on seasonal meteorological forecasts, FS_S4). Results of the seasonal streamflow prediction show that the three forecasting systems show
25
moderate skill in predicting SRI-6 (DJFMAM)≤ −0.5. Moreover, the three forecasting
HESSD
11, 9961–10000, 2014Hydrological drought forecasting and skill
assessment for the Limpopo river basin,
Southern Africa
P. Trambauer et al.
Title Page
Abstract Introduction
Conclusions References
Tables Figures
◭ ◮
◭ ◮
Back Close
Full Screen / Esc
Printer-friendly Version
Interactive Discussion
Discussion
P
a
per
|
Discus
sion
P
a
per
|
Discussion
P
a
per
|
Discussion
P
a
per
|
For every lead time and aggregation period considered, FS_S4 is found to be skil-ful in predicting hydrological droughts represented by SRI≤ −0.5 during the summer
rainy season. The skill reduces when going from SRI-6 to SRI-4 and SRI-1, as well as with increasing lead time. The skill of FS_ESP is in almost every case lower than that of FS_S4 and deteriorates rapidly with lead time, showing no skill for a lead time
5
of 4–5 months for SRI-4 and SRI-1. This indicates that the memory in the hydrol-ogy contributes to the predictability up to 2 to 4 months but for longer lead times the predictability of the system is dominated by the meteorological forcing. FS_ESPcond shows in general lower skills than FS_S4 but it becomes comparable and can even outperform the latter for smaller lead times if the parameters for selection and
weight-10
ing of ensemble members are carefully calibrated for each basin. Moreover, the skill of FS_ESPcond is more robust than that of the other forecasting systems as suggested by the narrower confidence intervals of ROCS. As with FS_ESP, the skill of FS_ESPcond also decreases faster than that of FS_S4 with lead time.
The high drought predictability of FS_S4 for all lead times and aggregation periods
15
of SRI and for the spatial drought indicators is encouraging given that such a system, if made operational, may provide end users with sufficient time to decide upon mea-sures to take in anticipation. Moreover, FS_ESPcond shows promising results. This forecasting system only requires the ONI index previous to the forecast to weight the ensembles traces to include in the forecast. The system is quite simple and presents
20
the advantage that can be coupled with the forecast of the ONI index that is available with a long lead time. Naturally, in this situation the uncertainties of both forecasts need to be considered.
Acknowledgements. This study was carried out in the scope of the DEWFORA (Improved
Drought Early Warning and Forecasting to strengthen preparedness and adaptation to droughts
25
HESSD
11, 9961–10000, 2014Hydrological drought forecasting and skill
assessment for the Limpopo river basin,
Southern Africa
P. Trambauer et al.
Title Page
Abstract Introduction
Conclusions References
Tables Figures
◭ ◮
◭ ◮
Back Close
Full Screen / Esc
Printer-friendly Version
Interactive Discussion
Discussion
P
a
per
|
Discus
sion
P
a
per
|
Discussion
P
a
per
|
Discussion
P
a
per
|
References
Balsamo, G., Boussetta, S., Lopez, P., and Ferranti, L.: Evaluation of Interim and ERA-Interim-GPCP-rescaled precipitation over the USA, ECMWF ERA Report Series 5, 1– 25, available at: http://old.ecmwf.int/publications/library/ecpublications/_pdf/era/era_report_ series/RS_5.pdf (last access: 26 August 2014), 2010.
5
Balsamo, G., Albergel, C., Beljaars, A., Boussetta, S., Cloke, H., Dee, D., Dutra, E., Muñoz-Sabater, J., Pappenberger, F., de Rosnay, P., Stockdale, T., and Vitart, F.: ERA-Interim/Land: a global land water resources dataset, Hydrol. Earth Syst. Sci. Discuss., 10, 14705–14745, doi:10.5194/hessd-10-14705-2013, 2013.
Brown, C., Baroang, K. M., Conrad, E., Lyon, B., Watkins, D., Fiondella, F., Kaheil, Y.,
Robert-10
son, A., Rodriguez, J., Sheremata, M., and Ward, M. N.: Managing climate risk in water sup-ply systems, IRI technical report 10-15, International Research Institute for Climate and So-ciety, Palisades, NY, available at: http://iri.columbia.edu/resources/publications/pub_id/1048/ (last access: 7 February 2014), 2010.
Cloke, H. L. and Pappenberger, F.: Evaluating forecasts of extreme events for hydrological
15
applications: an approach for screening unfamiliar performance measures, Meteorol. Appl., 15, 181–197, doi:10.1002/met.58, 2008.
Day, G.: Extended streamflow forecasting using NWSRFS, J. Water Res. Pl.-ASCE, 111, 157– 170, 1985.
Dee, D. P., Uppala, S. M., Simmons, A. J., Berrisford, P., Poli, P., Kobayashi, S., Andrae, U.,
20
Balmaseda, M. A., Balsamo, G., Bauer, P., Bechtold, P., Beljaars, A. C. M., van de Berg, L., Bidlot, J., Bormann, N., Delsol, C., Dragani, R., Fuentes, M., Geer, A. J., Haimberger, L., Healy, S. B., Hersbach, H., Hólm, E. V., Isaksen, L., Kållberg, P., Köhler, M., Matricardi, M., McNally, A. P., Monge-Sanz, B. M., Morcrette, J. J., Park, B. K., Peubey, C., de Rosnay, P., Tavolato, C., Thépaut, J. N., and Vitart, F.: The ERA-Interim reanalysis: configuration and
25
performance of the data assimilation system, Q. J. Roy. Meteorol. Soc., 137, 553–597, doi:10.1002/qj.828, 2011.
DEWFORA: WP2-D2.2 – Inventory of institutial frameworks and drought mitigation and adap-tation practices in Africa, DEWFORA project – EU FP7, available at: www.dewfora.net (last access: 26 August 2014), 2011.