Phytomedicine 12 (2005) 424–432
Validation of a colorimetric assay for the
in vitro
screening of inhibitors
of angiotensin-converting enzyme (ACE) from plant extracts
C.P. Serra
a,b, S.F. Coˆrtes
c, J.A. Lombardi
d, A. Braga de Oliveira
a, F.C. Braga
a,aFaculdade de Farma´cia, Universidade Federal de Minas Gerais, Belo Horizonte, Brazil b
Escola de Farma´cia, Universidade Federal de Ouro Preto, Ouro Preto, Brazil c
Departamento de Farmacologia, ICB, Universidade Federal de Minas Gerais, Belo Horizonte, Brazil d
Departamento de Botaˆnica, ICB, Universidade Federal de Minas Gerais, Belo Horizonte, Brazil
Received 16 June 2004; accepted 21 July 2004
Abstract
Anew method for the in vitro screening of plant extracts with potential angiotensin-converting enzyme (ACE)
inhibitory activity is proposed. The method is based on the cleavage of the substrate hippuryl-glycyl-glycine by ACE and subsequent reaction with trinitrobenzenesulfonic acid to form 2,4,6-trinitrophenyl-glycyl-glycine, whose absorbance is determined at 415 nm in a microtitre plate reader. Rabbit lung dehydrated by acetone was employed
as an enzyme source. Validation of the method showed satisfactory intra-day (CV¼7.63%) and inter-day precision
(CV¼13.61%), recovery (97–102.1%), sensitivity (IC50¼14.1 nmol/l) and linearity in the range 7.5–120 mmol/l of
glycyl-glycine (r2¼0
:9921). Besides, the method showed good correlation with a HPLC assay already established for
the screening of ACE inhibitors (r¼0:9935 and 0:9034;respectively, for captopril solutions and for plant extracts).
The method involves only inexpensive reagents and apparatus.
r2005 Elsevier GmbH. All rights reserved.
Keywords:Angiotensin-converting enzyme inhibitors;In vitrocolorimetric assay; Screening; Plant extracts
Introduction
The angiotensin-converting enzyme (ACE), a compo-nent of the renin-angiotensin system, plays a key role in the homeostatic mechanism of mammals, contributing to the maintenance of the normal blood pressure and for the electrolyte balance, being involved in the regulation and control of the arterial pressure. The use of ACE inhibitors is well established as one of the therapeutic principles in the treatment of hypertension. Besides,
ACE inhibitors are also employed for the prophylactic control of diabetic nephropathy and for the treatment of
heart failure (Coates, 2003; Unger, 2002). The clinical
use of ACE inhibitors is strongly recommended due to their ability in preventing and reversing functional and structural alterations commonly associated with
hyper-tension (Coates, 2003;Varagic and Frohlich, 2002).
Natural products are recognized as important sources of ACE inhibitors; it is worth mentioning that the
peptides from the venom of the Brazilian viperBothrops
jararaca were the template for the development of captopril and other synthetic antihypertensive drugs. Nevertheless, the potential of plant secondary metabo-lites as a source of new ACE inhibitors remains www.elsevier.de/phymed
0944-7113/$ - see front matterr2005 Elsevier GmbH. All rights reserved. doi:10.1016/j.phymed.2004.07.002
Corresponding author. Tel.: +55 31 3499 6951; fax: +55 31 3499 6935.
underexploited and only a limited number of plant
species has been screened for this target (Braga et al.,
2000;Hansen et al., 1995; Duncan et al., 1999).
There are a few methods described for the in vitro
screening of inhibitors of ACE and the one proposed by Elbl and Wagner (1991)and further improved byBraga et al. (2000) and Hansen et al. (1995) is the most frequently employed assay. Despite showing satisfactory analytical parameters for the evaluation of complex matrices, such as plant extracts, this method presents some hindrances for the high throughput screening of samples, namely, the long time required for analysis and the high cost of the purified ACE employed in the assay. Based on this background, the main goal of the present work was to develop and validate a fast, sensitive,
precise, accurate and inexpensive assay for thein vitro
screening of plant species for ACE inhibiting activity.
Materials and methods
Chemicals
Glycyl-glycine (Gly Gly), hippuryl-glycyl-glycine
(Hip-Gly-Gly), 2,4,6-trinitrobenzene sulfonic acid
(TNBS), HEPES and sodium tungstate were purchased from Sigma (USA). Rabbit lung dehydrated by acetone was obtained from Continental Produtos Biolo´gicos (Brazil) and captopril from Calbiochem (USA).
Buffers
Assay buffer: 297.5 mg of HEPES (50 mmol/l),
438.75 mg of NaCl (300 mmol/l) and 1420 mg of Na2SO4
(400 mmol/l) were added into a 25 ml volumetric flask (final concentration in parenthesis). They were dissolved
in 20 ml of distilled water containing 50ml of saturated
NaOH solution; after adjusting the pH to 8.15 with 10% NaOH solution, the volume was completed with
distilled water. Phosphate buffer (100 mmol/l):
340.2 mg of anhydrous potassium phosphate was dissolved in 20 ml of distilled water, adjusted to pH 8.5 with 10% NaOH solution and diluted to 25 ml.
Stock and working solution of rabbit lung
dehydrated by acetone
The stock solution was prepared as previously
described (Vermeirssen et al., 2002), by dissolving 2 g
of the powder in 10 ml of phosphate buffer (50 mmol/l, pH 8.3). The stock solution was highly active and stable
for at least 3 months, kept under refrigerator (2–61C).
The working solution (1 g/10 ml) was prepared freshly before the assays, by diluting the stock solution in the phosphate buffer.
Substrate solution
Two hundred milligram of Hip-Gly-Gly was dissolved in 4 ml of 1 mol/l ammonium hydroxide solution. After complete dissolution, the volume was increased to 6.8 ml
with distilled water (final concentration¼100 mmol/l).
TNBS solution
Two thousand and thirty microliter of TNBS was added to a 5 ml volumetric flask and the volume was
completed with distilled water (final
concentra-tion¼60 mmol/l). The solution was stored at 201C,
being used within 3 months.
Plant material and extract preparation
The plant material was collected in the state of Minas Gerais, Brazil, and the species were identified by Dr. J.A. Lombardi, Departamento de Botaˆnica, ICB, UFMG, Belo Horizonte, Brazil. Voucher specimens of the collected species (number in parenthesis) are deposited at the BHCB Herbarium, ICB, UFMG, Belo
Horizonte, Brazil: Argemone mexicana L.
(Papavera-ceae), leaves (BHCB 4752);Buddleja stachyoidesCham.
& Schltdl. (Loganiaceae), leaves (BHCB 2291);Cecropia
glaziovii Sneth. (Cecropiaceae), leaves (BHCB 4063);
Combretum fruticosum Stuntz (Combretaceae), leaves
and stems (BHCB 2292); Croton antisyphiliticus Mart.
(Euphorbiaceae), leaves (BHCB 2293); Hancornia
spe-ciosaGomes (Apocynaceae), leaves (BHCB 3565);Leea rubra Bl. Ex Spreng. (Leeaceae), aerial parts (BHCB
4416); Mangifera indica L. (Anacardiaceae), leaves
(BHCB 4413); Persea americana Miller (Lauraceae),
leaves and stems (BHCB 4412); Phoenix roebelinii
O’Brien (Arecaceae), leaves (BHCB 3133); Pyrostegia
venusta(Ker.) Miers (Bignoniaceae), stem (BHCB 4457)
Tabebuia serratifolia (Vahl) Nicholson (Bignoniaceae),
stem bark (BHCB 1357) and Tulbaghia violacea Harv.
(Liliaceae), aerial parts (BHCB 4420).
After separately drying the distinct parts of the plants
at 401C, for 72 h, the materials were powdered and
portions (10 g) were extracted with ethanol (330 ml)
under sonication (315 min). The solvent was vacuum
removed in a rotavapor evaporator, at 501C, and the
residues were kept at201C. For screening, the extracts
were dissolved with 20% MeOH and 80% HEPES to a
concentration of 100mg/ml.
Optimization of the assay conditions
The parameters listed in Table 1 were evaluated
Statistical analysis
The parameters evaluated during method develop-ment were analyzed by Tukey’s test (Prism Graph Pad 3.0—Graph Pad Software, Inc., USA).
Colorimetric method for ACE inhibition assay
Ten microliter of the rabbit lung solution (1 g/10 ml)
was added to an eppendorf flask containing 10ml of the
extract solution (100mg/ml) to be tested, or 10ml of
50 mmol/l phosphate buffer, pH 8.3 (negative control)
or 10ml of captopril solution (64 nmol/l) (positive
control). The mixture was homogenized and
pre-incubated for 5 min at 371C. The enzymatic reaction
was started by adding 60ml of the assay buffer and 30ml
of the substrate solution. After homogenization, the
mixture was incubated for 35 min, at 371C. The reaction
was stopped by the addition of 100ml of sodium
tungstate solution (100 g/l) and 100ml of sulfuric acid
(0.33 mmol/l); the eppendorf flask was mixed for 10 s,
following addition of 1000ml of distilled water. In the
sequence, the mixture was centrifuged at 2000 rpm, for
10 min. An aliquot of the supernatant (75ml) was placed
on a microtitre plate and mixed with 100ml of phosphate
buffer (100 mmol/l, pH 8.5) and 5ml of TNBS solution.
The plate was kept in the dark, at room temperature, for 20 min. Later, its absorbance was read in a microtitre plate reader (BioRad, Model 550) at 415 nm against a blank solution prepared in a similar way, except for adding the sodium tungstate and the sulfuric acid solutions before the rabbit lung solution. Assays were performed in triplicates. Calculation of ACE inhibition, on percentile basis, was accomplished by the following equation:
Inhibitionð%Þ ¼100 ½AI100
AC
,
whereAI is the measured absorbance at 415 nm in the
presence of an inhibitor andACis the absorbance of the
blank solution.
HPLC method for ACE inhibition assay
The assays were carried out with some modifications (Braga et al., 2000;Hansen et al., 1995) of the original
method (Elbl and Wagner, 1991). Assays were
per-formed in triplicates.
Captopril concentration–response curve
The sensitivity of the method was assayed by a captopril concentration–response curve, prepared with solutions of 2.0, 4.0, 8.0, 16.0, 32.0 and 64.0 nmol/l.
Each point is the mean7SD of 10 replicates.
Method validation
The validation of the colorimetric ACE inhibition assay was performed according to the INMETRO
guidelines (Inmetro, 2003) and included the evaluation
of linearity, intra-day and inter-day precision, precision between methods, accuracy and correlation between methods. The linearity was assessed by plotting a calibration curve between Gly-Gly solutions of different concentrations (7.5–120.0 mmol/l) and their respective absorbances. Intra-day precision was estimated by the coefficient of variation (CV) obtained from the measure-ment of 10 replicates of the incubation solution containing 1 g/10 ml of rabbit lung solution and 30 mmol/l of the substrate solution. The inter-day precision was evaluated by the CV of 10 replicates, in 6 consecutive days, employing the same concentrations used in the intra-day study. The precision between the
colorimetric and HPLC assay (Elbl and Wagner, 1991)
was evaluated by statistical analysis (Fisher’s test) of the ratio between the variances of the two methods,
estimated from the IC50 concentration–response curves
of captopril. The accuracy of the method was assessed by the recovery of Gly-Gly solutions (15, 30 and 45 nmol/l) spiked into the assay solution, containing
10ml of the plant extract (100mg/ml). Correlation
between the colorimetric and HPLC methods was estimated by the Pearson coefficient, employing two sets of data: the percentage of inhibition obtained with Table 1. Parameters evaluated during method development
Parameters Assayed values
Concentration of the rabbit lung solution (g/10 ml) 0.2 0.6 1.0 1.4 2.0
0.4 0.8 1.2
pH of the phosphate buffer (100 mmol/l) 7.5 8.0 8.5 9.3 9.6
pH of the assay buffer 7.0 7.5 8.15 8.5 9.0
Concentration of the substrate solution (mmol/l) 7.5 15.0 30.0 60.0
Temperature for enzyme incubation (1C) 25 30 37 40 45
captopril solutions and with 13 plant extracts. The plant species were selected based on their traditional use as antihypertensive or diuretics and on a chemosystematic consideration.
Results and discussion
The substrate used in the present assay was Hip-Gly-Gly, previously employed for the colorimetric
determi-nation of ACE in serum (Neels et al., 1983). Its cleavage
by the ACE produces Gly-Gly, which subsequently reacts with TNBS, forming TNP-Gly-Gly, detected at
415 nm (Fig. 1). The colorimetric assay proposed here
for ACE inhibitors screening is based on the partial or total inhibition of the color product formation.
Evaluation of the rabbit lung solution as source of
ACE
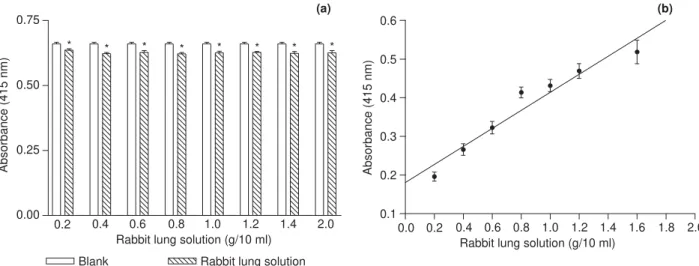
The absorbance of rabbit lung solutions of different concentrations was determined at 415 nm, wave length
employed for detection in the colorimetric assay. The absorbances of the rabbit lung solutions and those of the
blanks were significantly different (po0
:05) for all the
assayed concentrations, as stated inFig. 2a. In order to
eliminate this interference on the assays, rabbit lung solution previously inactivated by sodium tungstate and sulfuric acid was added to the blanks. The concentration of 1 g/10 ml was chosen for the rabbit lung solution in
the assays, once it gives an absorbance of 0.43 (Fig. 2b),
which is recommended for colorimetric assays (Fell,
1986). The ACE activity of this solution was 33 U/l, determined by a calibration line obtained as a regression between ACE activity and the absorbance of TNP-Gly
Gly (r2¼0
:9724;y¼0:08032þ0:01055x) (Fig. 3).
Optimal conditions for the enzyme reaction
The use of TNBS in coupling reactions with amines, amino acids and peptides has been previously reported (Satake et al., 1960; Snyder and Sobocinski, 1975; Okuyama and Satake, 1960). The reaction rate is dependent on the pH of the medium and the reaction
N N N OH
O
H O
H O
H O
N O
H O
OH H2N
N OH
O
H O
+ ACE
NO2
NO2
O2N S OH
O
O
H2N
N OH
O
H O
+ N OH
O
H O
NO2
NO2
O2N S N
O
O H
Hip-Gly-Gly Gly-Gly
TNBS Gly-Gly TNP-Gly-Gly
Fig. 1. Cleavage of the substrate Hip-Gly-Gly by ACE and reaction of Gly Gly with TNBS, forming the color derivative 2,4,6-trinitrophenyl-glycyl-glycine (TNP-Gly-Gly), which is determined at 415 nm.
0.00 0.25 0.50 0.75
* * * * * * * *
0.2 0.4 0.6 0.8 1.0 1.2 1.4 2.0
Blank Rabbit lung solution
Rabbit lung solution (g/10 ml) 0.0 0.2 0.4Rabbit lung solution (g/10 ml)0.6 0.8 1.0 1.2 1.4 1.6 1.8 2.0
Absorbance (415 nm)
0.1 0.2 0.3 0.4 0.5 0.6
Absorbance (415 nm)
(b) (a)
is usually completed within 15–30 min (Satake et al., 1960; Snyder and Sobocinski, 1975; Okuyama and Satake, 1960). The influence of the pH value of the
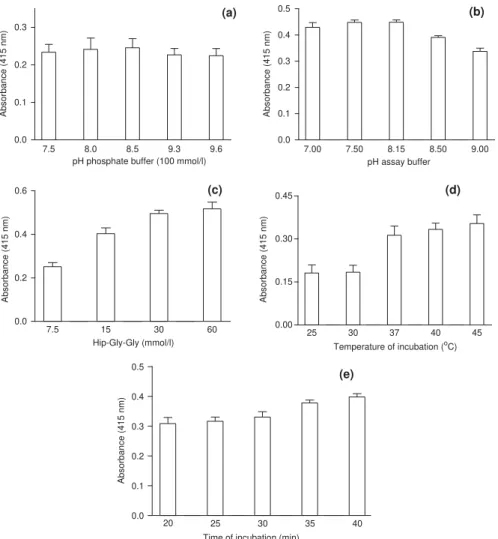
phosphate buffer on the reaction course is depicted in Fig. 4a, for the period of time employed in the assay (20 min). The absorbances did not vary significantly
(p40:05) in the range of pH values evaluated. Despite
this, pH 8.5 was adopted for the phosphate buffer in our method, the addition of the other reagents to carry out the assay results in a final pH ca. 8.0 being given, which
is required for optimum enzyme activity (Okuyama and
Satake, 1960).
The ACE catalytic activity is influenced by the nature of the substrate; Hip-Gly-Gly shows the highest activity
on a HEPES medium, at pH 8.15 (Dorer et al., 1976).
Our results showed no significant difference in the product absorbances at pH values 7.00, 7.50 and 8.15
(p40:05) which, in turn, did differ from the others
(po0
:05) (Fig. 4b). These findings led us to select pH
8.15 for the HEPES solution, the same value reported in
the previous colorimetric method (Neels et al., 1983).
It is known that substrates containing the dipeptides His-Leu or Gly-Gly in their terminal portions are
cleaved by ACE (Yang et al., 1970). In the case of
0 20 40 60 80 100 120 140 0.0
0.2 0.4 0.6 0.8 1.0 1.2 1.4
ACE (U/l)
Absorbance (415 nm)
Fig. 3. Calibration graph as a regression between ACE activity and the absorbance of TNP-Gly-Gly. Points are means7SEM of 10 replicates.
(a)
7.00 7.50 8.15 8.50 9.00 0.0
0.1 0.2 0.3 0.4 0.5
pH assay buffer
Absorbance (415 nm)
(b)
7.5 15 30 60 0.0
0.2 0.4 0.6
Hip-Gly-Gly (mmol/l)
Absorbance (415 nm)
25 30 37 40 45 0.00
0.15 0.30 0.45
Temperature of incubation (oC)
Absorbance (415 nm)
(c) (d)
0.0 0.1 0.2 0.3 0.4 0.5
20 25 30 35 40 Time of incubation (min)
Absorbance (415 nm)
(e) 7.5 8.0 8.5 9.3 9.6
0.0 0.1 0.2 0.3
pH phosphate buffer (100 mmol/l)
Absorbance (415 nm)
Hip-Gly-Gly, the 30 mmol/l concentration is
recom-mended forin vitroassaying the ACE activity (Yang et
al., 1970;Weisser and Schloos, 1991;Neels et al., 1982). This substrate concentration was confirmed by our
results, as stated in Fig. 4c. The absorbances obtained
for Hip-Gly-Gly solutions of 30 and 60 mmol/l were
significantly higher (po0:05) than the others (Fig. 4c)
and thus 30 mmol/l of substrate was employed in our method.
Kinetics studies carried out with ACE
demons-trated that 371C is the temperature of choice for
optimum enzyme activity (Cushman and Cheung,
1971; Pihlanto-Leppa¨la¨ et al., 1998). Among the temperatures assayed during method development, 37,
40 and 451C did not differ significantly (p40:05)
(Fig. 4d). Based on this finding, we selected 371C for our method, considering that it mimics the physiologic temperature and is in agreement with results from
kinetics studies (Cushman and Cheung, 1971;
Pihlanto-Leppa¨la¨ et al., 1998).
According to previous works, the activity of ACE remains constant over a period of 35 min and the incubation time recommended for enzyme optimum
activity is within 30–90 min (Hansen et al., 1995;
Duncan et al., 1999; Weisser and Schloos, 1991). The
graph depicted inFig. 4eshows no significant difference
(p40:05) between the incubation times of 35 and 40 min
which, in turn, are different from the others. For this reason, the incubation time of 35 min was chosen for our method.
Sensitivity of the assay
The sensitivity of the method was tested by
determin-ing the IC50 value for the reference ACE inhibitor,
captopril, using a concentration–response curve. The
IC50 value determined by our colorimetric method was
14.1 nmol/l, whereas the value reported for captopril
was 23 nmol/l, obtained by a fluorimetric assay (Ondetti,
1988). As far as we know, there is no previous report on
the IC50 value for captopril determined by a
colori-metric assay, employing similar conditions. Considering
the great variability of values reported for the IC50
of captopril, ranging from 11 to 23 nmol/l, the colori-metric method may be regarded more sensitive than
the fluorimetric assay (Ondetti, 1988). It is recognized
that IC50 values may vary due to the influence of
several factors, including the conditions of the assay,
the enzyme source, the calculation method and
the relationship between the inhibitor and the
enzyme source (Vermeirssen et al., 2002; Neels et al.,
1982; Ariyoshi, 1993), thus explaining the differences observed between the fluorimetric and the colorimetric assays.
Validation of the colorimetric assay
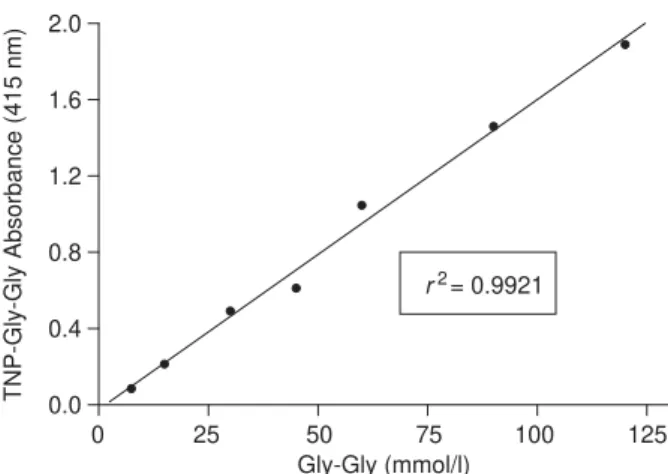
Linearity
The calibration curve (Fig. 5) was linear in the range
7.5–120.0 mmol/l of Gly-Gly (r2¼0:9921) and the
linear regression equation is y¼ 0:02403þ0:01625x.
Precision
The CV obtained for intra-day and inter-day assays were 7.63% and 13.61%, respectively. These values are within the range acceptable for results obtained from assays with multiple sources of variation, the limit of
CV¼2–10% being recommended for intra-day assays
and CV¼15–20% for inter-day assays (Chasin et al.,
1998;Nigrinis, 1995).
Precision between methods
The precision between the colorimetric and the HPLC assay for ACE inhibiting activity does not differ
significantly (p40:05), according to the Fisher test
(F ¼1:92) applied to the variance ratio of the two
methods (Inmetro, 2003).
Accuracy
The recovery of Gly-Gly varied from 97.0% to
101.8% (Table 2), a satisfactory range in analytical
terms, considering the complex composition of the matrix.
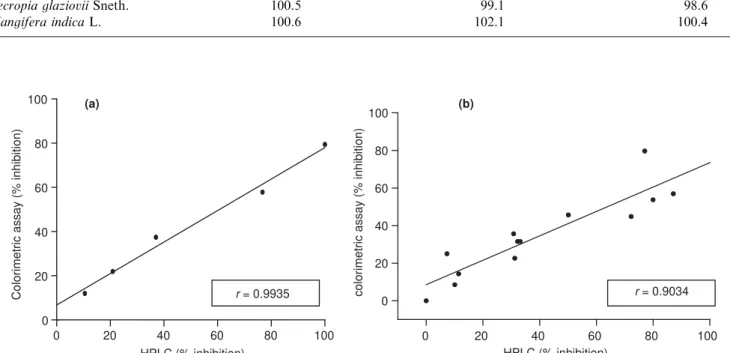
Correlation between methods
In order to investigate the correlation between the
HPLC (Elbl and Wagner, 1991) and the new
colori-metric assay for ACE inhibitory activity, we tested different concentrations of captopril by the two methods
and a strong correlation was observed (r¼0:9935)
(Fig. 6a). Additionally, 13 plant extracts were assayed by the two methods and submitted to correlation
0 25 50 75 100 125 0.0
0.4 0.8 1.2 1.6 2.0
r2= 0.9921
Gly-Gly (mmol/l)
TNP-Gly-Gly Absorbance (415 nm)
analysis (r¼0:9034) (Table 3; Fig. 6b). These results allowed us to attest undoubtedly the correlation between
the methods. Among the species assayed, Argemone
mexicana, Cecropia glazioui, Mangifera indica, Persea americana and Tulbaghia violaceae were selected based
on their traditional use as antihypertensive and/or diuretics, whereas a chemosystematic approach was adopted for the others.
Procyanidins and flavonoids are the major classes of
natural products presenting in vitro ACE inhibitory
Table 2. Recovery of Gly-Gly (% mean;n¼6)
Plant extract Gly-Gly concentration (mmol/l)
15 30 45
Argemone mexicanaL. 101.8 97.0 100.8
Cecropia glazioviiSneth. 100.5 99.1 98.6
Mangifera indicaL. 100.6 102.1 100.4
r = 0.9935 r = 0.9034
0 20 40 60 80 100 0
20 40 60 80 100
HPLC (% inhibition)
Colorimetric assay (% inhibition)
(a) (b)
0 20 40 60 80 100 0
20 40 60 80 100
HPLC (% inhibition)
colorimetric assay (% inhibition)
Fig. 6. Correlation between ACE inhibitory activity determined by the HPLC method and by the new colorimetric assay for (a) captopril solutions and (b) plant extracts. Points are means of triplicates.
Table 3. ACE inhibitory activity of plant extracts assayed by the colorimetric and HPLC methods (% mean;n¼3)
Plant extracts ACE inhibition
HPLC assay Colorimetric assay
Argemone mexicanaL. 0.0 0.0
Buddleja stachyoidesCham. & Schltdl. 31.2 22.7
Cecropia glazioviiSneth. 72.2 44.9
Combretum fruticosumStuntz 79.9 53.8
Croton antisyphiliticusMart. 32.2 31.6
Hancornia speciosaGomes 50.1 45.7
Leea rubraBl. Ex Spreng. 87.1 57.0
Mangifera indicaL. 10.1 8.6
Persea americanaMiller 7.3 25.1
Phoenix roebeliniiO’Brien 77.0 79.7
Pyrostegia venusta(Ker.) Miers 33.1 31.6
Tabebuia serratifolia(Vahl) Nicholson 11.4 14.3
activity, isolated from plants selected by
ethnopharma-cological approach (Wagner et al., 1991;Wagner, 1998;
Lacaille-Dubois et al., 2001;Actis-Goretta et al., 2003). Other classes of active compounds include phenylpro-panes, xanthones, fatty acids, terpenoids, alkaloids and
peptide amino acids (see references reviewed inBraga et
al., 2000). The active extracts reported here will be further submitted to bioguided fractionation, aiming to isolate and identify the ACE-inhibiting compounds.
In conclusion, the work demonstrated that the proposed colorimetric assay is a suitable method for the screening of potential ACE inhibitors. The analytical parameters evaluated during the method validation were satisfactory and therefore it can be used as an assay for the primary screening of plant extracts. Besides, the time required for method execution is shorter than the HPLC assay and it involves only inexpensive reagents and a microtitre plate reader.
Acknowledgments
This work was supported by PRPq/UFMG funds (Projetos Estruturantes 2002). CNPq (Brazil) is also acknowledged for a research fellowship (F.C.B) and CAPES for a Ph.D. fellowship (C.P.S.).
References
Actis-Goretta, L., Ottaviani, J.I., Keen, C.L., Fraga, C.G., 2003. Inhibition of angiotensin converting enzyme (ACE) activity by flavan-3-ols and procyanidins. FEBS Lett. 555, 597–600.
Ariyoshi, J., 1993. Angiotensin-converting enzyme inhibitors derived from food proteins. Trends Food Sci. Technol. 12, 86S–90S.
Braga, F.C., Wagner, H., Lombardi, J.A., Oliveira, A.B., 2000. Screening the Brazilian flora for antihypertensive plant species for in vitro angiotensin-I-converting enzyme inhibiting activity. Phytomedicine 7, 245–250.
Chasin, A.A.M., Nascimento, E.S., Ribeiro-Neto, L.M., Siqueira, M.E.P.B., Andraus, M.H., Salvadori, M.C., et al., 1998. Validac¸a˜o de me´todos em ana´lises toxicolo´gicas: uma abordagem geral. Rev. Bras. Toxicol. 11, 1–6. Coates, D., 2003. The angiotensin-converting enzyme (ACE).
Int. J. Biochem. Cell Biol. 35, 769–773.
Cushman, D.W., Cheung, H.S., 1971. Concentrations of angiotensin-converting enzyme in tissues of the rat. Biochim. Biophys. Acta 250, 261–265.
Dorer, F.E., Kahn, J.R., Lentz, K.E., Levine, M., Skeggs, L.T., 1976. Kinetic properties of pulmonary angiotensin-converting enzyme. Hydrolysis of hippurylglycylglycine. Biochim. Biophys. Acta 429, 220–228.
Duncan, A.C., Ja¨ger, A.K., Van Staden, J., 1999. Screening of Zulu medicinal plants for angiotensin converting enzyme (ACE) inhibitors. J. Ethnopharmacol. 68, 63–70.
Elbl, G., Wagner, H., 1991. Anew method for the in vitro screening of inhibitors of angiotensin-converting enzyme (ACE), using the chromophore- and fluorophore-labelled substrate dansyltriglycine. Planta Med. 57, 137–141. Fell, A.F., 1986. Ultraviolet, visible and fluorescence
spectro-photometry. In: Moffat, A.C., Jackson, J.A., Moss, M.S., Widdop, B. (Eds.), Clarke’s Isolation and Identification of Drugs in Pharmaceuticals, Body Fluids and Post-mortem Material. The Pharmaceutical Press, London, pp. 221–236.
Hansen, K., Nyman, U., Smitt, U.W., Adsersen, A., Gudik-sen, L., Rajasekharan, S., et al., 1995.In vitroscreening of traditional medicines for anti-hypertensive effect based on inhibition of the angiotensin converting enzyme (ACE). J. Ethnopharmacol. 48, 43–51.
Inmetro, Normalizac¸a˜o e Qualidade Industrial. Orientac¸o˜es sobre validac¸a˜o de me´todos de ensaios quı´micos, DOQ-CGCRE-008, marc¸o/2003.
Lacaille-Dubois, M.A., Franck, U., Wagner, H., 2001. Search for potential angiotensin converting enzyme (ACE)-inhibi-tors from plants. Phytomedicine 8, 47–52.
Neels, H.M., Scharpe´, S.L., Van Sande, M.E., Verkerk, R.M., Van Acker, K.J., 1982. Improved micromethod for assay of serum angiotensin converting enzyme. Clin. Chem. 28, 1352–1355.
Neels, H.M., Van Sande, M.E., Scharpe´, S.L., 1983. Sensitive colorimetric assay for angiotensin converting enzyme in serum. Clin. Chem. 29, 1399–1403.
Nigrinis, L.S.O., 1995. El me´todo de analisis para los estudios de estabilidad y de biodisponibilidad de medica-mentos. Parte II. Rev. Colomb. Cienc. Quim-Farm. 23, 95–101.
Okuyama, T., Satake, K., 1960. On the preparation and properties of 2,4,6-trinitrophenyl-amino acids and peptides. J. Biochem. 47, 454–466.
Ondetti, M.A., 1988. Structural relationships of angiotensin converting-enzyme inhibitors to pharmacologic activity. Circulation 77 (suppl. I), I–74-I-78.
Pihlanto-Leppa¨la¨, A., Rokka, T., Korhonen, H., 1998. Angiotensin I converting enzyme inhibitory peptides derived from bovine milk proteins. Int. Dairy J. 8, 325–331. Satake, K., Okuyama, T., Ohashi, M., Shinoda, T., 1960. The spectrophotometric determination of amine, amino acid and peptide with 2,4,6-trinitrobenzene 1-sulfonic acid. J. Biochem. 47, 654–660.
Snyder, S.L., Sobocinski, P.Z., 1975. An improved 2,4,6-trinitrobenzenesulfonic acid method for the determination of amines. Anal. Biochem. 64, 284–288.
Unger, T., 2002. The role of the renin-angiotensin system in the development of cardiovascular disease. Am. J. Cardiol. 89, 3A–10A.
Varagic, J., Frohlich, E.D., 2002. Local cardiac renin-angiotensin system: hypertension and cardiac failure. J. Mol. Cell Cardiol. 34, 1435–1442.
Vermeirssen, V., Camp, J.V., Verstraete, W., 2002. Optimiza-tion and validaOptimiza-tion of an angiotensin-converting enzyme inhibition assay for the screening of bioactive peptides. J. Biochem. Biophys. Methods 51, 75–87.
L.D., Bauer, R. (Eds.), Phytomedicines of Europe Chem-istry and Biological Activity. American Chemical Society, Washington, pp. 46–61.
Wagner, H., Elbl, G., Lotter, H., Guinea, M., 1991. Evaluation of natural products as inhibitors of angiotensin I-converting enzyme (ACE). Pharm. Phamacol. Lett. 1, 15–18.
Weisser, K., Schloos, J., 1991. The role of enzyme and substrate concentration in the evaluation of serum angio-tensin converting enzyme (ACE) inhibition by enalaprilatin vitro. Biochem. Pharmacol. 42, 1729–1737.