A Work Project, presented as part of the requirements for the Award of a Masters Degree in Management from the NOVA – School of Business and Economics.
How training evaluation can be used to
potentiate employee development in an
organization
Rita Loução de Almeida Student Number 1117
A Project carried out on the Management course, under the supervision of: Professor Carlos Marques
Abstract
This work project tackles a challenge presented by a corporate university and aims to study the impact of training evaluation on employee development. This project is composed by two studies. Study I is a qualitative study that refers to a benchmark of corporate universities and their best practices. Study II, a quantitative research, examines the impact of learning evaluation results on competencies of company’s potential assessment system and on individual performance. Despite learning evaluation results should not be consider alone on employee development decisions, they are usually used in training decisions, such as further training needs; and in career development, for instance to select high potentials and provide career guidance.
Table of Contents
1. Introduction ... 5
2. Framework ... 5
2.1.Work Project Design ... 6
2.2.Hypotheses ... 6
3. STUDY I - Benchmark of Corporate Universities & Training Best Practices .. 7
3.1.Brief Literature Review for Study I ... 7
3.2.Methodology ... 9
3.2.1.Data Collection and Qualitative Methods ... 9
3.2.2.Sample ... 10
3.3.Data Analysis and Interpretation ... 11
3.3.1.Training Trends ... 11
3.3.1.1.Training trends in Portugal ... 11
3.3.1.2.International trends ... 13
3.3.2.Benchmark of Corporate Universities ... 13
3.3.3.Relationship between Learning Evaluation and Employee Development. 15 3.3.4.Relationship between Learning Evaluation and Potential ... 16
3.3.5.Summary of Best Practices of Training Evaluation ... 16
3.4.Conclusions from Study I ... 17
4. STUDY II - Impact of Training Evaluation on Potential Competencies and Employee Performance ... 17
4.1.Brief Literature Review for Study II ... 18
4.2.Methodology ... 19
4.2.1.Variables Description ... 19
4.2.1.1.Training Evaluation ... 19
4.2.1.2.Potential Competencies ... 20
4.2.1.3.Individual Performance ... 22
4.2.1.4.Other Variables ... 23
4.2.2.Data Collection ... 24
4.2.3.Sample ... 24
4.2.4.Metric Characteristics ... 25
4.3.Data Analysis and Interpretation ... 27
4.3.2.Impact of Learning Evaluation on Individual Performance ... 28
4.3.3.Impact of Personal and Organizational Charact. on Learning Evaluation 29 4.4.Conclusions from Study II ... 29
5. Main Conclusions ... 30
6. Recommendations ... 31
7. References ... 32
1. Introduction
In general, training refers to a planned learning experience that aims to induce a long-lasting change on one’s knowledge, skills, attitudes and behaviors (Marques et al., 1995). In business, the purpose of training is to improve employees’ performance to aid the company achieve its strategic goals (Noe et al., 2008).
Today’s business world requires companies that are continuously adapting to changes and employees who are constant learners; thus companies change when their employees change and it embraces a growing focus on employee development (Guinn & Williamson, 2012). Therefore, training is becoming more important for companies as a human resource development tool (Ashton and Easterby-Smith, 1979; cited by Iqbal, 2011) and so, Portuguese companies are increasing their investment on training programs (Human Resources HR Portugal Website, Jun 2013). However, there is a lack of studies about the impact of training evaluation on employee development and how to use training evaluation results.
This work project, taking a “problem solving” form, tackles a challenge presented by a
company on answering “how training evaluation can be used to potentiate employee
development?”. This study is developed within the corporate university of a company
from the energy sector. Company’s corporate university aims to reinforce a common culture and promote employee development by coordinating employee development initiatives and executing corporate training programs.
2. Framework
This work project is composed by two studies. Study I refers to a benchmark that
examines different companies’ overview regarding training evaluation and their current
quantitative study that examines the relationship between training evaluation results and employee development. In more detail, it explores the relationship between learning
evaluation results and competencies considered in company’s potential assessment
system and in individual performance. Furthermore, it is analyzed how personal and organizational features influence training results.
2.1.Work Project Design
The project design, presented below, reflects the purpose of this project in finding a relationship between training evaluation and potential competencies and individual performance, as well as additional relationships with other variables (academic background, degree, working time and segment).
2.2.Hypotheses
As mentioned above, the challenge proposed by the company intends to analyze the relationship between learning evaluation results and potential competencies. Based on this, the first hypothesis arises as the following: H1: Training evaluation impacts
positively employee’s potential competencies. In fact, training aims to change one’s knowledge, skills, attitudes and behaviors (Marques et al., 1995). However, due to the lack of empirical studies regarding the above relation, an alternative hypothesis is considered, based on the availability of data. Indeed, Allen (2007) states that “to truly know whether training has been beneficial, we need to measure if performance
(individual or organizational) has improved”. Therefore, the second hypothesis is the
estimated based on employee’s competencies. In fact, Kandula (2013) states that
“competency is a reliable indicator of how a person can perform”. Also, Spencer and
Spencer (1993), cited by Kandula (2013), reinforces that a “competency causes or
predicts performance”. Therefore, the third hypothesis is the following: H3: There is a
positive impact of potential competencies on individual performance. However, since it is not the main objective of this work project and was not asked by the corporate university, it is presented on the separate appendix document.
3. STUDY I - Benchmark of Corporate Universities & Training Best Practices
Study I refers to a benchmark of corporate universities in Portugal. In this section, it is examined training trends in Portugal and internationally, as well as companies’ overview regarding training evaluation and best practices.
3.1.Brief Literature Review for Study I
The concept of corporate university has been difficult to define (Prince and Beaver,
2001) and there are several definitions in the literature since the 90’s. According to
Allen (2002), a corporate university is an educational unit that conducts several activities to promote individual and organizational learning and it must be aligned with
organization’s mission, goals and strategy. Furthermore, the author presents four levels
the session, such as physical conditions, trainers’ quality and knowledge acquired (Marques et al., 1995). However, the core of the evaluation is the analysis of the impact of training on business performance, on employee development, on teams, which is named training validation by Marques et al. (1995).
Despite some limitations, the Kirkpatrick model (1976) is adopted in this work project since it is a reference in the literature. It consists in four levels of evaluation: reaction, learning, behavior and results (Kirkpatrick, 2007). In brief, reaction level (level one)
refers to measuring participants’ satisfaction after a course, to assess how they feel
about the course in order improve the program if necessary. However, being satisfied does not mean that participants have learned (Kirkpatrick, 2007). Therefore, learning
level (level two) evaluates the change in participant’s knowledge, skills and attitudes.
Subsequently, behavior level (level three) measures behavior changes caused by training; usually assessed before and after a program (Kirkpatrick, 2007). Finally, results level (level four) measures the impact of training on business results, such as improvements on quality, customer satisfaction, employee engagement, as well as increased productivity and cost savings (Kirkpatrick, 2007). Companies face an increasing pressure for proven results, which is also applied to the training context. Hence, an additional level is proposed by Phillips & Stone (2002), which is return on (training) investment, which refers to the monetary benefits of training.
types of evaluation uses in the literature - instrumental, conceptual, symbolic use - however, it is a topic of permanent discussion (Johnson et al., 2009). In short, instrumental use refers to the direct decisions or actions based on evaluation results (Patton, 2002), such as improvements of the existing training programs: modify length, teaching methods and/or replace trainers. Conceptual use “involves the use of
evaluations to influence thinking and deepen understanding […] as clarifying a
program’s model, testing theory, distinguishing types of interventions, figuring out how
to measure outcomes” (Patton, 2002), as well as future decisions in terms of program
holding and advanced courses (Bober & Barlett, 2004). Finally, symbolic use refers to justify a program and demonstrate its worthiness (Bober & Barlett, 2004). Overall, despite its importance, training evaluation is frequently absent and is often limited to the reaction level (Dahita & Jha, 2011).
3.2.Methodology
3.2.1. Data Collection and Qualitative Methods
Data is collected from eight interviews conducted to multinational companies in Portugal or large Portuguese companies, based on a semi-structure questionnaire. The questionnaire is composed by a total of sixteen questions that explore the following topics (see questions in detailed in the separate appendix document):
General overview about training programs in Portugal: where is inquired training
target, time spent for the last three years and programs’ content;
Training evaluation: where it is asked the importance of training evaluation and what
levels are included in the evaluation, based on the four levels of the Kirkpatrick model (1976) and the fifth level of Phillips & Stone (2002);
Evaluation utilization: includes the importance and purpose of using results. Answers
Questions about learning results are asked in more detail in order to determine its
importance and the purposes of that use;
The last section includes the specific relation between training evaluation and
potential, as well as company’s best practices.
The questionnaire is created by the author of this work project and it was validated by the responsible of the internship. Note that different questions may be included, as well as other models of training evaluation and evaluation use.
The first contact with companies was done by email, where the work project’s objectives and methodology were explained briefly. Then, a face-to-face interview was conducted, expect for three cases: a phone call interview and two cases in which the information was collected via email. Then, the information was transcribed and a written document was created (see the eight complete interviews in the separate appendix document), based on the information collected from the interview, annual reports and the website. Afterwards, the company validates the document, in order to ensure that information can be included in this project. Due to confidentiality issues, companies are not revealed and thus, a code is assigned to each company (letters from A to H). Moreover, data about training trends in Portugal is collected from one interview with a management consulting firm with expertise in human capital. These facts are supported by international trends collected from the most updated reports of the Chartered Institute of Personnel and Development (CIPD) and the American Society of Training and Development (ASTD) in order to shorten limitations that might arise from the fact that training trends findings are based on one source.
3.2.2. Sample
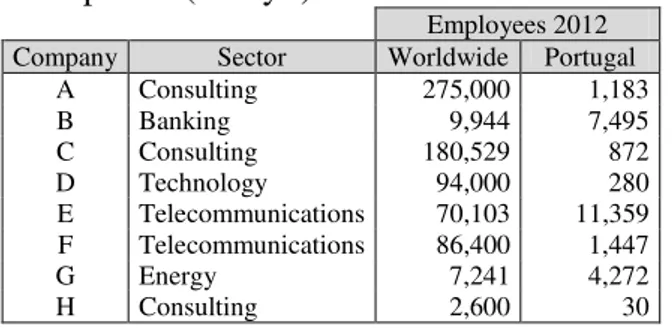
The size of these companies in terms of employees can be seen in the table below. Table I: Figures about companies (Study I)
Employees 2012 Company Sector Worldwide Portugal
A Consulting 275,000 1,183 B Banking 9,944 7,495 C Consulting 180,529 872 D Technology 94,000 280 E Telecommunications 70,103 11,359 F Telecommunications 86,400 1,447 G Energy 7,241 4,272 H Consulting 2,600 30
3.3. Data Analysis and Interpretation
This section begins with a general overview about training trends in Portugal, as well as international trends. Then, it is present a benchmark of corporate universities about training evaluation and evaluation use. In third place, findings about the relationship between training evaluation and potential are presented. This section ends with a summary of best practices about training.
3.3.1. Training Trends
Training trends in Portugal are based on an interview on October 18th, 2013 with a consulting company expert in human resources. The company supports corporate universities in terms of its structure, processes, mission, vision and model; develops specific training programs; and supports training needs.
3.3.1.1.Training trends in Portugal
eLearning and classroom, which is also increasing, since it allows cost reduction and still keep controlling and ensuring training effectiveness.
In a context of crisis, companies are focusing their training programs in relevant topics that differentiate the company in the market. They are changing their business priorities, which leads to more sophisticated training programs. Also, the crisis leads to a change
in the employee’s profile (the employee must be more dynamic) and so training has the
role to support this transition. Moreover, the concept of corporate university is more suitable for large companies, since it allows synergies, cost reduction and training optimization. Training evaluation is becoming more controlled and well-organized, since training is an investment and so needs to be justified, which leads to a structured and grounded training.
Considering the Kirkpatrick model (1976), companies tend to stay in the first two levels (reaction and learning). However, there is an increasing trend for structured training programs in multinational companies, which reflects the importance of the next levels (behavior and results). Moreover, companies use mainly reaction results to improve the existing training programs (instrumental use). Learning results are linked to performance in the case of technical skills, and in some specific but not common cases, learning results are used on career issues.
3.3.1.2.International trends
Overall, international trends are aligned with Portuguese ones. The profile of companies that invest in training does not depend on the sector or size, and the number of hours spent on training tends to be constant over the years. Similar to Portugal, training tends to be organization- and business-focused and the central target is high-potential employees and senior managers. Regarding training areas, leadership and managerial skills are the main focus, as well as transversal behaviors and culture issues. Moreover, concerning delivery methods, there is a reduction on classroom and trainer-led instruction, and the most common practices are on-the-job training and in-house development programs, and eLearning combined with other types of learning. Technology-driven methods are increasing, such as webinars, virtual and mobile learning. In a context of crisis, companies, which reported a worse situation in the last year, are more likely to reduce their training investment.
Regarding training evaluation, there is an increasing emphasis on measuring and evaluating training effectiveness due to the current economic situation and the need to justify the investment. Despite the effort to link evaluation and business impact, results measurement is still a gap, since companies are at the reaction level of the Kirkpatrick model (1976). Finally, the most effective learning and development practice pointed out is on-the-job training and coaching by line managers, since it provides immediate benefits, for instance builds capability and competence.
3.3.2. Benchmark of Corporate Universities
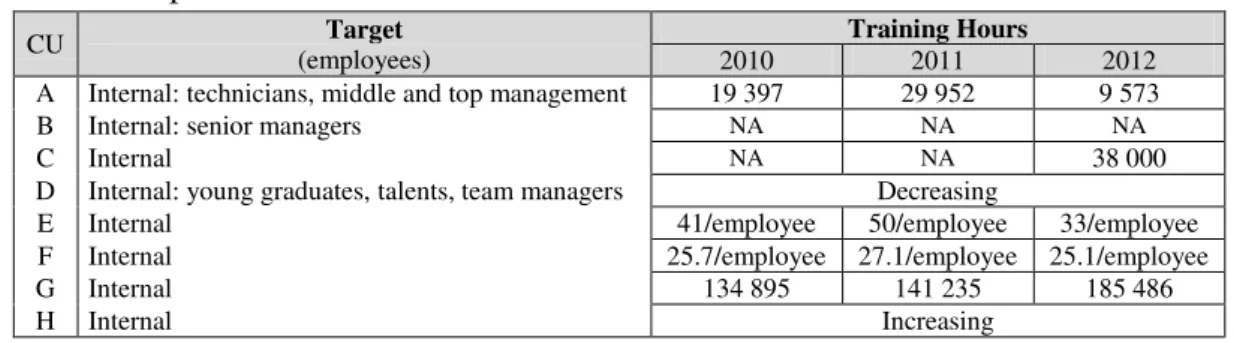
university B focuses only on courses that offer academic credits or degrees, by developing its own programs with partnerships with leading Portuguese universities. Table II represents a brief comparison of corporate university’s target and training
hours’ evolution.
Table II: Corporate Universities Overview
CU Target
(employees)
Training Hours
2010 2011 2012 A Internal: technicians, middle and top management 19 397 29 952 9 573 B Internal: senior managers NA NA NA
C Internal NA NA 38 000 D Internal: young graduates, talents, team managers Decreasing
E Internal 41/employee 50/employee 33/employee F Internal 25.7/employee 27.1/employee 25.1/employee G Internal 134 895 141 235 185 486 H Internal Increasing
CU: Corporate university; NA: Not applicable Note: Different units for “Training Hours” are presented due to the information provided by each company
In brief, the time spent on training varies among corporate universities. On one hand, the decrease in time spent on training is explained by: the increase of pre-work; of the eLearning component and the decrease of classroom; and the economic context. On the other hand, the increase in time is explained by the increase in the number of new employees and training needs. Note that some companies are under a legal restriction of providing at least thirty five hours per employee per year, on a three-year average.
Training programs’ purpose varies according company’s business and in general,
corporate universities focus on technical skills for the majority of internal employees, usually the ones that start new functions. Concerning soft skills, the most common is leadership and they tend to be offered to specific groups such as senior managers and high potentials. Moreover, corporate universities attach a very high level of importance to training evaluation, but they tend to stay in the first levels - reaction, learning and behavior. It was expected based on the current training trends presented before. Note that the methods used within each level differ among companies.
indicators, such as clients’ satisfaction. A certain level of satisfaction is defined and the
gap between the objective and the current satisfaction level is determined. Then, the variable training is the only that changes and the others remain constant (same clients, same purchasing power, same products, etc.) and the new client satisfaction level is determined. Then, the company connects the results level with ROI, in which costs refers to the money spent on that training course and benefits are the increase on client’s satisfaction.
Regarding evaluation utilization, corporate universities confer a high importance to it but the most popular use is instrumental; nevertheless conceptual and symbolic uses were also present. In brief, every company uses the results from satisfaction level to improve existing training programs, such as assessing suppliers’ quality and content adequacy; adapting program’s length, objectives, trainers, methodology, facilities; and aligning expectations. Moreover, the results from learning and behavior levels tend to be conceptually used, which refers to advanced courses decisions and course effectiveness assessment. There are only three corporate universities that use training results to demonstrate programs’ worthiness, in order to show the impact of training on business results and the return of the money invested on training.
3.3.3.Relationship between Learning Evaluation and Employee Development
In short, employee development is an initiative between the employee and the company regarding the acquisition of knowledge, skills, attitudes and behaviors, which involves
an equilibrium between employee’s needs and career objectives and company’s goals
It is common among consulting firms to use learning results to determine the level of competence of an employee, conveying a certification. This certification influences the members that are chosen to a project, and then, influence one’s career progression and performance assessment. Moreover, there is one company that uses learning results in the promotion system in case of draws, as well as in mobility; however they are seldom cases, which correspond to employees from the management area that revealed potential on engineering and were recommended to move to other department.
3.3.4. Relationship between Learning Evaluation and Potential
Regarding the relationship between learning results and potential, it is vital to consider that the definition of potential differs from company to company. When talking about potential, one key issue is to define “potential for what”, which refers to the target area or function. Sometimes, potential is assessed in terms of comparison among employees based on pre-defined criteria. Overall, companies in Portugal tend to link potential with the topic of leadership. Most common findings indicate that potential is frequently linked with talent: potential is assessed first and then the results influence the access to advance training and academic degrees funding.
3.3.5. Summary of Best Practices of Training Evaluation
It is crucial to take into account that best practices may depend on the corporate university type, structure, objectives, as well as the sector. In fact, Patton (2002) states
that “the assumptions undergirding the phrase “best practices” (e.g., that there must be a
single way to do something) are highly suspect.”
Corporate universities must only move to the next level of evaluation if that level and the previous one are well-structured and defined. Every level adds different value to the corporate university and to the company and any level must not be passed over.
3.4.Conclusions from Study I
Overall, training tends to be business-focused and high-potential employees and senior managers are the central target. Regarding methods, classroom training is decreasing and eLearning is increasing since it allows time and cost reduction and convenience. Companies tend to stay in the first two levels (reaction and learning) of the Kirkpatrick model (1976); however, there is an increasing trend for structured training programs, which reflects the importance of the next levels. The popular uses identified were instrumental; nevertheless conceptual and symbolic uses were also present.
Hence, learning results are mainly used to assess whether an employee is prepared to move to the next level of a training program, to further training needs decisions and to
demonstrate programs’ effectiveness. Moreover, some companies link learning results
with certifications and career progression, promotions in case of draws and mobility. Potential is frequently connected with talent and is assessed first in order to influence the access to advance training and academic degrees funding. Finally, it is crucial for corporate universities to measure the impact and training effectiveness, by increasing their emphasis on the results and ROI levels, without ignoring the early levels.
4. STUDY II - Impact of Training Evaluation on Potential Competencies and
Employee Performance
Study II aims to examine the relationship between learning evaluation and competencies
considered in company’s potential assessment system and individual performance.
4.1.Brief Literature Review for Study II
Employee development is a shared responsibility between the employee and the employer regarding the acquisition of knowledge, skills, attitudes and behaviors to prepare ones for future changes in job requirements (Noe et al., 2008). According to this author, employee development involves formal education, job experiences, interpersonal relationships and assessment. In brief, Noe et al. (2008) defines formal
education as one’s participation in training courses; and describes job experiences as
“job enlargement, rotating to a new job, promotions, or transfers”. Moreover,
interpersonal relationships usually refers to the relation between a more experienced employee and the employee that aims to help on “better understand the company and gain visibility to key persons in the organization” (Noe et al., 2008). The same author
defines assessment as measuring one’s performance, knowledge, skills, behaviors and
personality characteristics.
In fact, the ultimate goal of training relates with competencies regardless their nature - technical, social or behavioral competencies, current or future ones (Marques et al., 1995). There are several definitions for competency presented in the literature. In brief, competencies consist on a set of behaviors needed to perform a task or function (Vathanophas & Thai-ngam, 2007). Moreover, performance refers to a specific task achievement measured against predetermined levels of proficiency set by the company (Sultana et al., 2012). Overall, training leads to the acquisition of skills and knowledge that results in changes in one’s competencies, which improve job performance (Aguinis & Kraiger, 2009). Moreover, Noe et al. (2008) states that employee skills and abilities
are “the raw material of performance” and further explains that “these raw materials are
behaviors only if they have the necessary knowledge, skills, abilities and other
characteristics”.
4.2.Methodology
Study II, a quantitative study, is a correlational research in which is assumed that is examined the cause-effect relation between variables. In this section, it is presented the description and characterization of the variables and the process of collecting data. Furthermore, the sample of this study is described, as well as the metric characteristics.
4.2.1. Variables Description
Taking into account work project hypotheses, it is important to characterize the main variables of this study - training evaluation, potential competencies and individual performance - in order to understand in more detail the design of this project.
4.2.1.1.Training Evaluation
In this study, the variable training evaluation refers to the learning level of the Kirkpatrick model (1976). In this case, it is used five variables that are the scores from five courses of the “Development and Valorization Program” of the corporate university. This program, transversal to all departments of the company, aims to provide insights about energy business and finance, as well as regulation and competition, which are critical subjects to the company’s daily business. Training evaluation refers to the following five variables:
Introduction to Energy Business (IEB) - it provides insights about the energy sector
and its structural changes in the medium- and long-run. It is a mandatory course.
Introduction to Energy Business Senior Experts (IEB SE) - this course provides a
Introduction to Business Finance I (IBF I) - it provides a global overview about
finance and its applicability to firm’s business. It is mandatory and focuses on employees without experience or background in finance.
Introduction to Business Finance II (IBF II) - is a more detail and deeper version of
IBF I and targets employees with experience or background in finance.
Regulation and Competition (RC) - it relates with the economic regulation in the
energy sector and the competition. It is a mandatory course regardless one’s academic background, experience, function or segment.
Test scores are a continuous variable (Newbold, Carlson & Thorne, 2007) and may take any value from 0 to 20 with two decimals. It can be seen below that IEB is the course with the highest mean, 16.24, whereas RC is the course with the lowest, 14.12.
Table III: Scores Descriptive
IEB IEB SE IBF I IBF II RC N Valid 226 192 186 82 86
Missing 402 436 442 546 542 Mean 16.24 15.77 14.56 15.26 14.12 Std. Deviation 2.52 2.91 2.87 3.10 2.97 Variance 6.34 8.44 8.21 9.63 8.81 Minimum 6.00 6.00 6.40 6.40 4.40 Maximum 20.00 20.00 20.00 20.00 19.33
Additionally, since the purpose of this project is to understand how learning evaluation affects potential competencies (H1) or individual performance (H2), test scores are independent variables that try to predict either potential competencies or individual performance. From Table III, it can be seen that there are missing values for each course since employees did not do all tests. In fact, there are rare cases when it happens and so the five courses have different population and must be analyzed separately.
4.2.1.2.Potential Competencies
Company’s potential assessment refers to the following eight competencies that
Strategic Vision and Market Orientation (SVMO) - it refers to understanding
company’s strategy, vision, values, market context and positioning.
Organizational Commitment (OC) - it involves engagement and commitment to
company’s ideologies, values and policies.
Teamwork (TW*) - it only applies to employees who belong to teams and are not
responsible for one. It refers to the easiness of integration in a team and one’s cooperation with team members.
Results Oriented (RO) - one’s actions and attitudes must be aligned with goals.
Change Openness (CO) - refers to ones’ flexibility and quick adaptation to change.
Initiative and Continuous Improvement (ICI) - the employee should be proactive on
searching different and innovative ideas and solutions for business challenges.
Client Orientation Internal and External (COIE) - employees must be personally
committed to meet and exceed client’s expectations.
Development and Team Leadership (DTL*) - it only applies to employees who
coordinate a team. They must guide the team towards objectives, conveying guidelines and clear priorities, by delegating the adequate activities according one’s development and motivation.
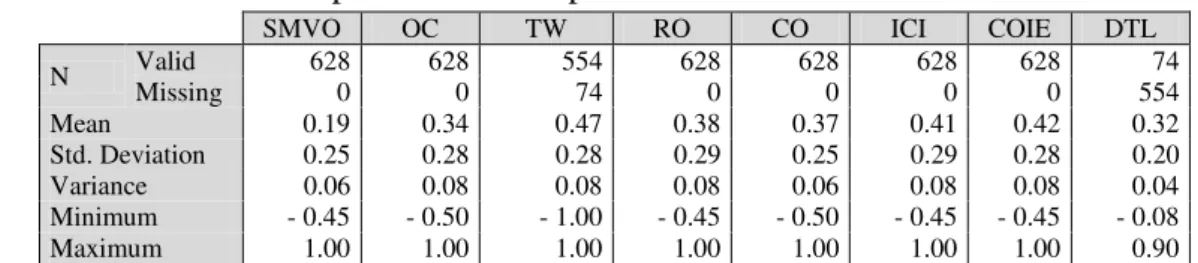
In brief, since the beginning of 2012, employees are divided into groups according to responsibilities and job function (see Appendix I). For each group, there is a level of proficiency defined according to market references (see Appendix II). The final evaluation is done according to the level of proficiency, ranking from 1 to 5 with two decimals. In order to measure every competency with the same scale regardless the group, it was calculated a gap between the level of proficiency and the final evaluation, which is a continuous variable according to Newbold, Carlson & Thorne (2007) and it varies from -1.00 to 1.00 in this sample (0 corresponds to be aligned with expectations).
Table IV: Potential Competencies Descriptive
SMVO OC TW RO CO ICI COIE DTL N Valid 628 628 554 628 628 628 628 74
Missing 0 0 74 0 0 0 0 554 Mean 0.19 0.34 0.47 0.38 0.37 0.41 0.42 0.32 Std. Deviation 0.25 0.28 0.28 0.29 0.25 0.29 0.28 0.20 Variance 0.06 0.08 0.08 0.08 0.06 0.08 0.08 0.04 Minimum - 0.45 - 0.50 - 1.00 - 0.45 - 0.50 - 0.45 - 0.45 - 0.08 Maximum 1.00 1.00 1.00 1.00 1.00 1.00 1.00 0.90
The variable “potential competencies” is a dependent variable since is expected to observe the effect of learning evaluation on potential competencies (H1). As a final remark, the final evaluation in each competency is determined by a weighted average of
different interveners, depending on one’s group (see Appendix III). A minimum of 60%
of this evaluation is determined by one’s supervisor. This variable is somehow contaminated because supervisors have access to employee’s tests scores, and so their decisions regarding potential competencies assessment might be influenced by that.
4.2.1.3.Individual Performance
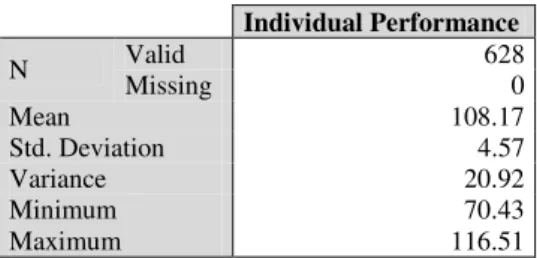
Individual performance is one value weighted by four elements: personal goals (15%),
An employee that scores 100% in individual performance means that is aligned with expectation (similar to a gap of 0 in potential competencies). Individual performance has a mean of 108.17, as it can be seen in the table below.
Table V: Individual Performance Descriptive
Individual Performance
N Valid 628 Missing 0 Mean 108.17 Std. Deviation 4.57 Variance 20.92 Minimum 70.43 Maximum 116.51
Finally, individual performance is a dependent variable, since it is expected to analyze how individual performance is predicted by learning evaluation (H2).
4.2.1.4.Other Variables
Furthermore, personal features are one’s academic background and degree; and
organizational features refer to working time and segment. First of all, academic background is composed by three main areas: Technology (mainly science and
engineering); Economics, management and accounting; and Law, social sciences and humanities, which were defined according to the “index of area of study and course”
from “Direção-Geral do Ensino Superior” (2013), which is a Portuguese central service
that coordinates university courses. It is a discrete variable: Technology takes the value -1, Law, social sciences and humanities takes the value 1 (opposite areas); and Economics, management and accounting takes 0. Second, degree is an ordinal variable since is divided in seven increasing categories from 1 to 7: basic, high school, bachelor, undergraduation, post graduation, masters, and masters/MBA.
value from 1.12 to 37.10 in this sample. Finally, employees are divided into three segments according to the increasing level of responsibility within the company: 1
corresponds to Experts, 2 to Managers and Senior Experts and 3 to High Direction and Direction. It is an ordinal variable since express the rank ordering of those three items.
4.2.2. Data Collection
Data that correspond to the scores of the five courses is provided by company’s corporate university. Moreover, potential competencies and individual performance data is collected from the Human Resources department of the company.
4.2.3. Sample
45.3%, 49.9% corresponds to Managers and Senior Experts and only 4.8% corresponds to the highest segment High Direction and Direction.
4.2.4. Metric Characteristics
Before analyzing the impact of learning evaluation on potential competencies and individual performance, it is studied the characteristics of the metrics, in this section. First, it is important to recall the project design and examine it in more detail. As can be seen in the design below, H3 is not consider, because is not the main objective of this work project and individual performance is highly contaminated, so it was transfer to the separate appendix document.
Non-leaders: This analysis includes SMVO, OC, RO, CO, ICI, COIE and TW,
excluding DTL. In this case, the factorial analysis is statistical meaningful (Appendix IV) since the value of KMO and Bartlett's is 0.87 > 0.60 (Maroco, 2003) - and so is adequate to proceed. From the table below, it can be concluded that despite there are
seven competencies for assessing one’s potential, there is only one explanatory factor
that holds 46% of the total variability.
Table VI: Total Variance Explained (Non-leaders)
Factor Initial Eigenvalues Extraction Sums of Squared Loadings
Total % of Variance Cumulative % Total % of Variance Cumulative %
1 3.222 46.022 46.022 3.222 46.022 46.022
2 .784 11.200 57.222
3 .749 10.693 67.916
4 .623 8.894 76.810
5 .576 8.227 85.037
6 .567 8.093 93.130
7 .481 6.870 100.000
Leaders: This analysis includes SMVO, OC, RO, CO, ICI, COIE and DTL,
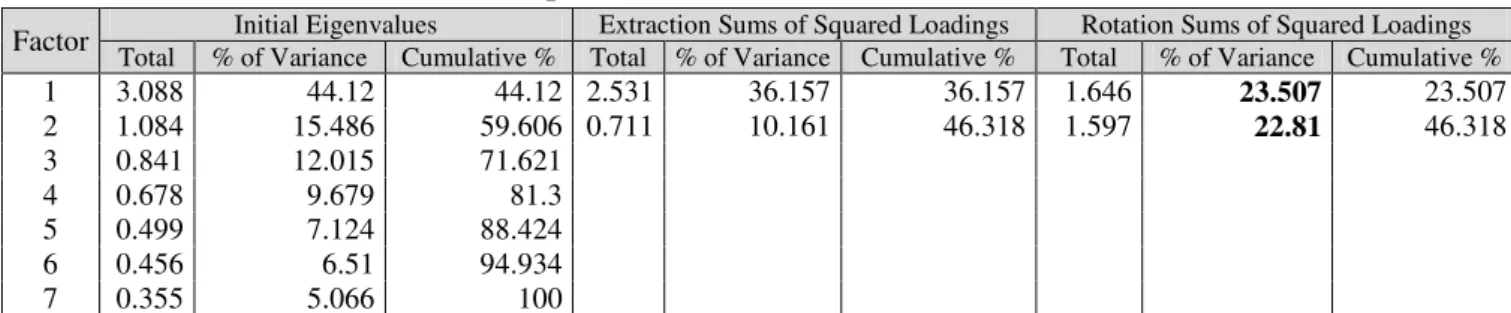
excluding TW. There is statistical meaning since KMO and Bartlett's Test is 0.77 and so it is suitable to proceed (see Appendix IV). From the following table, it can be concluded that there are two factors that explain the potential assessment. In this case, employees with team coordination are assessed based on two factors that explain 46.32% of the total variability.
Table VII: Total Variance Explained (Leaders)
Factor Initial Eigenvalues Extraction Sums of Squared Loadings Rotation Sums of Squared Loadings
Total % of Variance Cumulative % Total % of Variance Cumulative % Total % of Variance Cumulative %
1 3.088 44.12 44.12 2.531 36.157 36.157 1.646 23.507 23.507
2 1.084 15.486 59.606 0.711 10.161 46.318 1.597 22.81 46.318
3 0.841 12.015 71.621
4 0.678 9.679 81.3
5 0.499 7.124 88.424
6 0.456 6.51 94.934
7 0.355 5.066 100
Table VIII: Rotated Factor Matrix
Factor Potential Competencies 1 2 SMVO Strategic Vision and Market Orientation 0.856 0.048 OC Organizational Commitment 0.417 0.281 RO Results Oriented 0.201 0.629
CO Change Openness 0.321 0.466 ICI Initiative and Continuous Improvement 0.571 0.471 COIE Client Orientation Intern and Extern 0.502 0.266 DTL Development and Team Leadership 0.128 0.781
4.3. Data Analysis and Interpretation
After analyzing the metric characteristics of the variables, the next step is to check the hypotheses of this project - through the correlation matrix - which are presented in the next three sections. The correlation matrix is used to describe whether there is a significant correlation between the variables (sig.< .05) and its strength (Pearson coefficient).
4.3.1. Impact of Learning Evaluation on Potential Competencies
First of all, potential competencies are significantly correlated among them (see Appendix V), i.e. they are not independently, except for SMVO and DTL that are not correlated. It was expected given the results from the factorial analysis. Moreover, the inter correlation matrix for learning evaluation is not applicable since the population differs among tests. In this section, it is addressed the main objective of this work project by using the correlation matrix presented below.
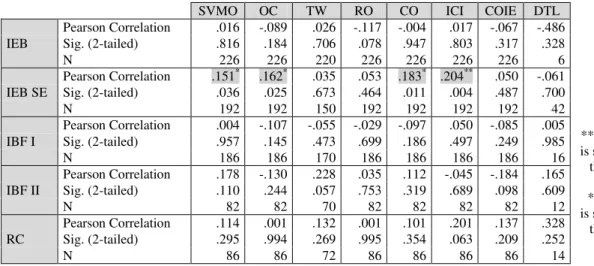
Table IX: Correlation Matrix (H1)
SVMO OC TW RO CO ICI COIE DTL
**. Correlation is significant at the 0.01 level (2-tailed). *. Correlation is significant at the 0.05 level (2-tailed). IEB
Pearson Correlation .016 -.089 .026 -.117 -.004 .017 -.067 -.486 Sig. (2-tailed) .816 .184 .706 .078 .947 .803 .317 .328 N 226 226 220 226 226 226 226 6 IEB SE
Pearson Correlation .151* .162* .035 .053 .183* .204** .050 -.061 Sig. (2-tailed) .036 .025 .673 .464 .011 .004 .487 .700 N 192 192 150 192 192 192 192 42 IBF I
Pearson Correlation .004 -.107 -.055 -.029 -.097 .050 -.085 .005 Sig. (2-tailed) .957 .145 .473 .699 .186 .497 .249 .985 N 186 186 170 186 186 186 186 16 IBF II
Pearson Correlation .178 -.130 .228 .035 .112 -.045 -.184 .165 Sig. (2-tailed) .110 .244 .057 .753 .319 .689 .098 .609 N 82 82 70 82 82 82 82 12 RC
It can be verified that there is no correlation between most of the learning evaluation results and the potential competencies. Nevertheless, there is a significant correlation between one test - Introduction to Energy Business Senior Experts - and the following potential competencies: Strategic Vision and Market Orientation, Organizational Commitment, Change Openness and Initiative and Continuous Improvement. It implies that H1 is only partial accepted for the training course: Introduction to Energy Business Senior Experts.
4.3.2. Impact of Learning Evaluation on Individual Performance
Since H1 is only partial accepted, H2 needs to be tested. It can be concluded from the table below that there is no correlation between three courses results and individual performance. However, two courses - Introduction to Energy Business Senior Expects and Introduction to Business Finance II - are correlated with individual performance and so they seem to be relevant for individual performance. It implies that H2 is only partially accepted.
Table X: Correlation Matrix (H2)
INDPERF
*. Correlation is significant at the 0.05 level (2-tailed). IEB
Pearson Correlation -.024 Sig. (2-tailed) .716
N 226
IEB SE
Pearson Correlation .185*
Sig. (2-tailed) .010
N 192
IBF I
Pearson Correlation .002 Sig. (2-tailed) .976
N 186
IBF II
Pearson Correlation .227* Sig. (2-tailed) .041
N 82
RC
Pearson Correlation .203 Sig. (2-tailed) .061
N 86
constraints (Noe et al., 2008). Noe et al. (2008) refers to companies’ culture that discourages employees from exhibiting effective behaviors or simply employees are not motivated, which commonly occurs when employees rely on not being rewarded or recognized for demonstrating those behaviors.
4.3.3. Impact of Personal and Organizational Charact. on Learning Evaluation
From Table XI, it can be concluded that employees from the Humanities area have lower grades in the IEB test than employees from the Technology area, which is expected based on the content of the course. Moreover, the higher the employee’s degree, the greater the score is, for every course. However, employees, who are working in this firm for a long period, score lower in IEB SE, IBF I and IBF II (even stronger). Table XI: Correlation Matrix (Personal and Organizational Features)
IEB IEB SE IBF I IBF II RC
**. Correlation is significant at the 0.01 level (2-tailed). *. Correlation is significant at the 0.05 level (2-tailed). Academic
Background
Pearson Correlation -.251** -.002 -.134 .008 .178 Sig. (2-tailed) .000 .978 .068 .942 .101 N 226 192 186 82 86 Degree
Pearson Correlation .318** .208** .229** .270* .270* Sig. (2-tailed) .000 .004 .002 .014 .012 N 225 190 186 82 85 Working
Time
Pearson Correlation -.119 -.163* -.214** -.498** -.136 Sig. (2-tailed) .073 .024 .003 .000 .212 N 226 192 186 82 86
4.4. Conclusions from Study II
Overall, company’s potential assessment system differs between non-leaders and
leaders. On one hand, non-leaders have been evaluated through one explanatory factor, which means that employees are evaluated based on an overall perception. On the other
hand, leaders’ potential assessment is based on two factors.
there are only two courses correlated with individual performance. On one hand, an employee might have acquired the skills and knowledge but is not translating it into behaviors or actions due to situational constraints (Noe et al., 2008), since employees might not believe on being rewarded or recognized. On the other hand, it might refer to the lack of opportunity to put into practice the acquired skills, knowledge and behavior.
5. Main Conclusions
It was presented the challenge of answering “how training evaluation can be used to
potentiate employee development?”, which refers to how learning evaluation - scores from knowledge tests - and employee development are linked. In this section, main conclusions of both studies are presented.
Main conclusions of Study I:
Training tends to be business-focused.
High-potential employees and senior managers are the central target.
Classroom training is decreasing and eLearning is increasing.
Companies tend to stay in the first two levels of the Kirkpatrick model (1976).
The most popular use of training results identified was instrumental.
Companies usually link learning results with certifications and career progression.
Potential influences the access to advance training and academic degrees funding.
Training impact and ROI are relevant levels to measure training effectiveness.
Main conclusions of Study II:
Non-leaders have been evaluated through one explanatory factor (overall perception).
Leaders’ potential assessment is based on two factors.
H1 is partially accepted since only IEB SE is significantly correlated with SMVO,
OC, CO and ICI.
6. Recommendations
First of all, since there is no correlation between IEB, IBF I, IBF II and RC and potential competencies, the company should not take into account these scores on
employee’s potential assessment. Despite IEB SE is correlated with potential
competencies, it should not be taken into account on assessing potential competencies in order to ensure a uniform and coherent potential assessment system within the organization, since this course is taken by senior managers and not by all employees. Likewise, despite there is a significant correlation between IEB SE and IBF II and individual performance, the scores should not be used on performance assessment for the same reason presented above for the potential assessment system.
In general, the corporate university must be aware of the fact that employees from the Humanities area have lower grades than employees from the Technological area; it might be necessary to provide an introductory course in order to better prepare them to the main course or provide more training time. Likewise, employees who are working for longer in the company need more training or training time, to ensure that they acquire the necessary knowledge and skills, and so they require a special attention. Overall, based on the literature1 and the benchmark, learning results are effective tools for two main purposes regarding employee development: (1) training and (2) career development. (1) First, tests scores help to assess further training needs since they reveal the current level of skills and knowledge of participants. Second, tests also help deciding whether one is prepared to move to the next level within a program (defining a cut-off score, for instance). Third, tests and course’s effectiveness are also linked, since scores provide information about one’s level of knowledge and so shows whether
course’s objectives were being achieved (usually assessed through pre and post testing).
(2) Tests provide a first “clue” about employees’ inherent ability for development in a
1
certain area, since scores can “project” the likelihood of success on a specific subject. In
this case, scores can be used to select high potentials to advance training (sometimes though cut-off scores). Then, within that program, the progress of that employee can be monitored through the scores of other tests. Moreover, scores can help to provide career guidance, by understanding which employees fit a specific career development path to reach a position.
However, test scores must not be used alone in these decisions, since it represents only a
small portion of employees’ skills. Hence, it is recommended to the company to include
the results from training courses of the corporate university when an assessment of the employee is done, in order to ensure that the assessment provides the whole picture about the employee. Finally, employees must receive information about the implications of training results in order to engage them in the whole process.
7. References
Aguinis, Hermanm, and Kurt Kraiger. 2009. “Benefits of Training and Development
for Individuals and Teams, Organizations and Society”. Annual Review of Psychology, 60: 451-469.
Allen, Mark. 2002. The Corporate University Handbook: Designing, Managing and
Growing a Successful Program. New York: AMACOM.
Allen, Mark. 2007. The Next Generation of Corporate Universities. San Francisco: Pfeiffer.
Allen, Mark, and Philip McGee. 2004. “Measurement and Evaluation in Corporate
Universities”. New Directions for Institutional Research, Wiley Periodicals, Inc., 124: 81-92.
ASTD. 2012. “2012 State of the Industry Report”. American Society of Training and Development. http://www.astd.org/.
Bober, Christopher, and Kenneth Barlett. 2004. “The Utilization of Training
Program Evaluation in Corporate Universities”. Human Resources Development Quarterly, 15(4): 363-383.
CIPD and Cornerstone. 2013. “Annual Survey Report 2013 Learning and Development”. Chartered Institute of Personnel and Development. http://www.cipd.co.uk/.
DGES. 2013. Direcção-Geral do Ensino Superior. http://www.acessoensinosuperior.pt/indarea.asp (accessed November, 2013).
U.S. Department of Labor Employment and Training Administration. 2006.
“Testing and Assessment: A Guide to Good Practices for Workforce Investment
Professionals”.
Guerci, Marco, Emilio Bartezzaghi, and Luca Solari. 2010. “Training evaluation in Italian corporate universities: a stakeholder-based analysis”. International Journal of Training and Development, 14(4): 291-307.
Guinn, Stephen, and Gary Williamson. 2012. “Employee Development: Lesson
Learned”. American Society of Training & Development.
http://www.astd.org/Publications/Newsletters/ASTD-Links/ASTD-Links
Articles/2012/05/Employee-Development-Lessons-Learned (accessed October, 2013).
Human Resources Portugal. 2013. HR Portugal.
http://www.hrportugal.pt/2013/06/11/65-das-empresas-portuguesas-apostou-em-formacao-em-2010/ (accessed September, 2013).
Iqbal, Muhammad. 2011. “An Empirical Analysis of the Relationship between Characteristics and Formative Evaluation of Training”. International Business Research, 4(1): 273-286.
Johnson et al. 2009. “Research on Evaluation Use: A Review of the Empirical
Literature from 1986 to 2005”. American Journal of Evaluation, 30(3): 377-410. Kirkpatrick, Donald, and James Kirkpatrick. 2007. Implementing the Four Levels:
A Practical Guide for Effective Evaluation of Training Programs. Berrett-Koehler Publishers.
Maroco, João. 2003. Análise Estatística – Com Utilização do SPSS. Lisboa: Edições Sílabo.
Marques, Carlos et al. 1995. “Medir Resultados da Formação: para Além da Ilusão”.
Newbold, Paul, William Carlson, and Betty Thorne. 2007. Statistics for Business and
Economics. New Jersey: Pearson Prentice Hall.
Noe, Raymond et al. 2008. Human Resources Management: Gaining a Competitve
Advantage. McGraw-Hill.
Patton, Michael. 2002. “Evaluation, Knowledge Management, Best Practices, and
High Quality Lesson Learned”. American Journal of Evaluation, 22 (3): 329-336. Phillips, Jack, and Ron Stone. 2002. How to Measure Training Result: A Practical
Guide to Tracking the Six Key Indicators. McGraw-Hill.
Prince, Christopher, and Graham Beaver. 2001. “The Rise and Rise of the Corporate University: the emerging corporate learning agenda”. The International Journal of Management Education, 1(2): 17-26.
Sultana, Afshan et al. 2012. “Impact of Training on Employee Performance: A Study
of Telecommunication Sector in Pakistan”. Interdisciplinary Journal of Contemporary Research in Business, 4 (6): 646-661.
Vathanophas, Vichita, and Jintawee Thai-ngam. 2007. “Competency Requirements for Effective Job Performance in the Thai Public Sector”. Contemporary Management Research, 3(1): 45-70.
8. Appendices
Appendix I - Division per Group (Study II)
Appendix II - Level of Proficiency of Potential Competencies for Groups (Study II)
Appendix III - Interveners of Potential Competencies Assessment (Study II)
Group Population
Group I Board of Directors of Business Units; First line directors of Holding Group II First line directors of Business Units; Second line directors of Holding Group II.A Senior executives without team coordination
Group III Managers with a formal team coordination Group IV Managers without a formal team coordination Group V Coordinators
Group VI Senior Experts Group VII Experts
Level of Proficiency - Potential Competencies
NA: Not Applicable *Employees are evaluated either in TW or in DTL: team members in Teamwork and team leaders in Development and Team Leadership, not in both at the same time.
Group SVMO OC TW* RO CO ICI COEI DTL* Group I 4.5 4.5 NA 4.5 4.5 4.5 4.5 4.5 Group II 4.0 4.0 NA 4.0 4.0 4.0 4.0 4.0 Group II.A 4.0 4.0 4.0 4.0 4.0 4.0 4.0 NA Group III 3.0 3.0 NA 4.0 4.0 3.0 3.0 4.0 Group IV 3.0 3.0 4.0 3.0 4.0 3.0 3.0 NA Group V 2.0 3.0 NA 3.0 3.0 3.0 3.0 3.0 Group VI 2.0 3.0 3.0 3.0 3.0 3.0 3.0 NA Group VII 2.0 3.0 2.0 2.0 3.0 2.0 2.0 NA
Assessment of Potential Competencies (2012)
NA: Not Applicable
Appendix IV – Factorial Analysis Adequacy (Non-leaders & Leaders) (Study II)
KMO and Bartlett's Test Non-leaders Leaders
Kaiser-Meyer-Olkin Measure of Sampling Adequacy. .870 .772
Bartlett's Test of Sphericity Approx. Chi-Square 928.744 130.765
df 21 21
Sig. .000 .000
Appendix V – Inter Correlation Matrix – Potential Competencies (Study II)
SVMO OC TW RO CO ICI COIE DTL
**. Correlation is significant at the 0.01 level (2-tailed). *. Correlation is significant at the 0.05 level (2-tailed). c. Cannot be computed because at least one of the variables is constant. SVMO
Pearson Correlation 1 .347** .262** .345** .293** .414** .347** .149
Sig. (2-tailed) .000 .000 .000 .000 .000 .000 .205 N 628 628 554 628 628 628 628 74 OC
Pearson Correlation .347** 1 .416** .389** .372** .383** .428** .231*
Sig. (2-tailed) .000 .000 .000 .000 .000 .000 .048 N 628 628 554 628 628 628 628 74 TW
Pearson Correlation .262** .416** 1 .353** .349** .366** .406** .c Sig. (2-tailed) .000 .000 .000 .000 .000 .000 N 554 554 554 554 554 554 554 0 RO
Pearson Correlation .345** .389** .353** 1 .278** .443** .421** .523** Sig. (2-tailed) .000 .000 .000 .000 .000 .000 .000 N 628 628 554 628 628 628 628 74 CO
Pearson Correlation .293** .372** .349** .278** 1 .399** .294** .383** Sig. (2-tailed) .000 .000 .000 .000 .000 .000 .001 N 628 628 554 628 628 628 628 74 ICI
Pearson Correlation .414** .383** .366** .443** .399** 1 .456** .468** Sig. (2-tailed) .000 .000 .000 .000 .000 .000 .000 N 628 628 554 628 628 628 628 74 COIE
Pearson Correlation .347** .428** .406** .421** .294** .456** 1 .264* Sig. (2-tailed) .000 .000 .000 .000 .000 .000 .023 N 628 628 554 628 628 628 628 74 DTL
Pearson Correlation .149 .231* .c .523** .383** .468** .264* 1 Sig. (2-tailed) .205 .048 .000 .001 .000 .023 N 74 74 0 74 74 74 74 74
A Work Project, presented as part of the requirements for the Award of a Masters Degree in Management from the NOVA – School of Business and Economics.
How training evaluation can be used to
potentiate employee development in an
organization
APPENDICE DOCUMENT
Rita Loução de Almeida Student Number 1117
A Project carried out on the Management course, under the supervision of: Professor Carlos Marques
Table of Contents
1. Study I Appendices ... 3
1.1.Interview Guide for Portuguese Training Trends ... 3 1.2.Interview Guide for Corporate Universities ... 5 1.3.Training Trends in Portugal - Interview ... 8 1.4.Company A Interview ... 13 1.5.Company B Interview ... 18 1.6.Company C Interview ... 25 1.7.Company D Interview ... 31 1.8.Company E Interview ... 37 1.9.Company F Interview ... 44 1.10.Company G Interview ... 51 1.11.Company H Interview ... 58 1.12.Training Evaluation Levels ... 62 1.13. Types of Evaluation Utilization ... 62 2. Study II Appendices ... 63
1. Study I Appendices
1.1.Interview Guide for Portuguese Training Trends
Training Trends in Portugal - Interview Guide
Training Trends in Portugal
1. What is the profile of the Portuguese companies that most invest in training? Size, industry, etc.
2. What is the investment (in hours) for the years for Portuguese companies?
3. What are the top investment areas?
4. What is the learning methods most used? eLearning, blended learning, classroom?
5. What are the major reasons for companies in Portugal invest in training?
6. What is the “training target”? Internal employees, external?
7. How far the concept of Corporate University is developed in Portugal?
Training Evaluation Trends
2. In what levels are most of the companies? Why? Trends regarding learning evaluation uses
3. Do companies use the evaluation? If yes, for what (criteria)?
Best Practices
4. How are these topics developed in the literature and in companies?
5. How do companies link (training evaluation and) knowledge assessment and employee development?
6. How do companies link (training evaluation and) knowledge assessment and employee potential?
7. How do companies relate tests’ scores and potential?
1.2.Interview Guide for Corporate Universities
Benchmark of Corporate Universities – Interview Guide
General Overview about Training
1. What is the training target of the company, in general?
2. How many hours does the company spend on training per year, approximately? Year 2010:
Year 2011: Year 2012:
3. What is the training programs content/purpose?
Training Evaluation
4. What is the importance of training evaluation for the company?
Not important
Little importance
Few importance
Important
Very important
Crucial
Does not apply/answer/know
5. Does the company evaluate training? If yes, how (levels)?
Evaluation Utilization
6. What is the importance of training evaluation utilization for the company?
Not important
Little importance
Few importance
Important
Crucial
Does not apply/answer/know
7. Does the company use training evaluation results? If yes, for what purposes?
Learning Results Uses
8. What is the importance of learning assessment results for the company?
Not important
Little importance
Few importance
Important
Very important
Crucial
Does not apply/answer/know
9. Does the company use learning results (for example, test/exam scores)? If yes, how (criteria)?
10.What is the evaluation grade scale?
0 to 20
0 to 10
0 to 5
No scale – participants only do the test/exam
Other:
11.Who has access to the learning results (final scores)? Why?
12.How does the company communicate the learning results (scores) to the supervisor?
Specific Best Practices (national and international if applicable)
14.How does the company relate learning assessment and potential?
15.Does the company have a training model (formal or informal)?
1.3.Training Trends in Portugal – Interview
Training trends in general in Portugal
1. What is the profile of the Portuguese companies that most invest in
training?
Companies that invest on training are typically companies that maintain a positive track record in business results, and not because of its size. Therefore, the companies that most invest in internal training for its employees are the following: multinational companies, national companies and companies that highly depend on the global market.
2. What is the trend on the investment in training, for the last three years?
Overall, the investment in Portugal in training is decreasing (number of hours decreased); however there is an increase on the customization and specialization of the training. Companies are reducing the investment on training since they are focusing the training programs in specific topics that are most relevant to its business.
Multinational companies are focusing on priority themes and people, putting
extra control on its training budget and target groups due to the economic crisis in Portugal. Therefore, these companies must be much more sophisticated regarding its client relation, and so it is important to prepare employees in this topic, which is done through training.
A lot of National companies must reinvent themselves to become more
efficient; so it is important to empower its employees in specific topics.
Companies that highly depend on the global market are concerned about
new markets and culture.
In conclusion, companies are providing training regarding specific topics and to key employees. For example, there was a great resize in the pharmaceutical sector in Portugal in 2013, which results on new positions to some employees; therefore the investment in training increased for this particular case.
3. What are the top investment areas?
It depends on the company. Soft skills area is still a gap in Portugal.
4. What is the learning methods most used? eLearning, blended learning,
classroom?
Classroom training is decreasing and e-learning is increasing, since e-learning allows time and cost reduction, which leads to convenience. However, blended learning is also an increasing trend. It a combination of e-learning and classroom, which allows companies to reduce costs and still, keep the control and guarantee the acquisition of knowledge.
5. What are the major reasons for companies in Portugal invest in training
during the crisis?
Companies are focusing its training programs in the most relevant topics that differentiate the company in the market. This means that due to the crisis, companies changed their business priorities, which leads them to sophisticate the training programs make it much more focused. Moreover, the crisis lead to a change in the employee’s profile (the employee must be more dynamic) and so training has the role
6. How far the concept of Corporate University is developed in Portugal?
The concept of Corporate University is more suitable to large companies, since it aims to create synergies, reduce costs and optimize training. Still, there is an increasing trend of the concept mostly in multinational/global companies.
Training evaluation trends
7. Is it common for companies to evaluate training?
There is an increasing trend regarding training evaluation; training is becoming more controlled and well-organized. Training is an investment and so the company needs to justify it, which is leading to a structured and grounded training.
8. In what levels of the Kirkpatrick model1 are most of the companies?
Companies tend to stay in the first two levels (level one and two). However, there is an increasing trend for structured training programs in multinational companies, which is reflected in an increase of the importance of the next levels (level three and four).
9. For what purposes do companies use training evaluation?
Companies use mainly the results from level one to improve the existing training programs. The results from level two are used to link knowledge evaluation and performance in the case of technical skills. Additionally, in some specific not common cases, level two results are used in knowledge management; this means that companies link knowledge results with career and succession issues in key areas.
1
Level 1 – Reaction/Satisfaction Level 2 – Learning
Best practices
10.How are these topics developed in companies in Portugal?
Multinational companies and large national companies tend to have these topics well-defined and structured.
11.How do companies link training evaluation and employee potential?
The definition of potential differs from company to company. When talking about potential, is important to understand one key issue: “potential for what”, which refers
to the area or function. Overall, companies tend to link potential with the topic of leadership, in which the results from knowledge tests are a minimum requirement, since behavior competencies are more valued.
12. How do companies relate tests’ scores and potential?
The weight of the scores in potential estimation in companies is around ten percent.
13.What are the assessment tools that companies should use to support
individual development and potential?
In order to assess potential, companies can use a large variety of tools. The most
common are the following: personality questionnaires, such as “Talent Q”; leadership
diagnoses; soft skills diagnoses, to assess behavior competencies such as leadership competencies and emotional intelligence. Additional tools are interviews, team challenges, and case studies, usually used in the assessment center.
14.Best practices in general