DEVELOPMENT OF COMMUNICATION
OF CHILDREN AGED BETWEEN ONE AND THREE YEARS
OLD AND THEIR RELATIONSHIP WITH THE FAMILY
AND SCHOOL ENVIRONMENTS
Desenvolvimento da comunicação de crianças de um a três anos
e sua relação com o ambiente familiar e escolar
Jordana Siuves Dourado(1), Sirley Alves da Silva Carvalho(2), Stela Maris Aguiar Lemos(2)
(1) Universidade Federal de Minas Gerais – UFMG, Belo
Hori-zonte, MG, Brasil.
to three years old and pre-school children from
four to six years old. The early childhood education
institutions aim at the full development of children in their physical, psychological, intellectual and social aspects1. Thus, schooling can impact educational,
social and cultural aspects and be a strategy to enhance the quality of life of the population2.
The incorporation of day care centers to education systems, especially municipal systems,
INTRODUCTION
According to the National Educational Bases and Guidelines Law (LDBEN, Law 9.394/96), day care centers are institutions for children from birth
ABSTRACT
Purpose: to analyze the communication development of children aged one to three years from two day care centers in Belo Horizonte city considering the variables familiar environment and school environments. Methods: 70 children from 1 to 3years from daycare were evaluated. Initially, the environment of the day care centers were assessed according to the scale ITERS ((Infant and Toddlers Environment Rating Scale-Revised)), subsequently was performed the Resource Inventory of Family Environment to characterize the education environment. In the day care centers were performed
evaluations of hearing and language through otoacoustic emissions and communicative proile. We chose exploratory analysis of variables in order to characterize the sample. Next, we performed a multiple regression analysis in order to obtain a mathematical relationship between the data, checking in the set of independent variables that most inluence the dependent variable. Results: were found
54% ofthe male, 46% failed the hearing screening, and the highest average in the Protocol of Proile Communicative was in the ield: Communication – Reception.In relation to the school environment,
the highest scores were obtained in institution A. There was relationship between communicative
proile and inventory of resources of the family environment.Conclusion: the results corroborate the
literature that report the direct inluence of environmental stimuli on child development and also claims that the contexts in which the individual develops may contribute to its development, and the family
and the school are the main source of support for the child. Thus, it’s necessary further studies about the school-child-family triad.
consequences15. Hearing loss during the irst
three years of life impairs not only the acquisition of language during this crucial period, but also the future of the child in the school16.
In this context, childhood development must be highlighted from the perspective of the network
of meanings that contemplates the human devel-opment approach with reference to the analysis of the situation and the interaction established between people. Human development is understood as a process that involves construction between and through the interactions that people establish in
speciic scenarios17,18.
It is important to highlight that the period of life in which the main cognitive acquisitions occur coincides with the age in which children attend the daycare. Thereby, the purpose of this study was to analyze the communication development of children aged between one and three years from two day care centers in the city of Belo Horizonte according to the variables: family and school environments.
METHODS
This is an observational analytic cross-sectional study with non-probability sample conducted in two early childhood education institutions in Belo Horizonte. The institution A, which is public and is located on the northeast regional, and the insti-tution B, which is private, associated with the City Hall of Belo Horizonte and is located in the eastern regional. The study was approved by the Research Ethics Committee of the Federal University of Minas Gerais, opinion no. ETIC 402/08.
Seventy regularly enrolled children were included in the study, 25 of the day care A and 45 of the day care B, and whose parents have read and signed the free and cleared term of consent.
Initially, the environment of the day care centers was assessed according to the Scale of the ITERS-R (Infant Toddler Environment Rating Scale – Revised), which allows to analyze the elements and organization of the environment19. The scale
consists of 35 items, grouped into seven subscales, namely: Routines/personal care, material/furniture for children; oral language and comprehension; learning activities; (child-adult) interaction; structure of the program of activities; needs of the adults (teachers and parents). The scale was applied in the form of observation made by the researchers and interviews with educational coordinators. Average scores for each day care were calculated as proposed by the literature19. The scores served as
a parameter in the qualiication of the environmental
resources of the day care centers for comparison between them.
intuitions, i. e., school environment. According to the literature3, institutions of early childhood education,
especially community and associated institutions,
generally present greater deiciencies concerning
to building and equipment, in relation to comfort, sanitation and suitability to age3.
The Western way of life and urban demand has inluenced the enrollment of children increas -ingly earlier and for a longer period of time in early childhood education institutions. Thus, its mission is changing, passing from childcare Institution to the scope of social and educational space. Thus, it must meet two inseparable and complementary
functions: to take care and to educate2,4-6.
The contexts in which the individuals develop may contribute to the vulnerability to risks, both those
inherent to each phase as due to life circumstances, to development. The day care center is considered a collective environment with organized space in order to promote shared events, where there is a pedagogical proposal of interaction of infants7. So,
the family and the school are the main systems that support the children in their development. The association between poor school performance and social and emotional problems can be pointed out as a major health problem in children8-10.
During the irst years of life the social world of
the child should include contact with other children. Currently this contact has been increasingly early, due to socioeconomic and cultural transformations, which have promoted the education of even more young children in collective environments such as
day care centers. A research that identiied and
analyzed episodes of interaction of 21 infants was
performed. This analysis revealed frequent, luid
and choppy interactions between infants, more than just doing something together. Indeed, the inter-active events involve the regulation of the behavior of the other, even from a distance, or even if one
of the partners does not know that is regulating the
behavior of the other7.
The irst three years of life are considered the
most important for the development of hearing
and speaking skills, as this is the critical period of
maturation of the nervous system. This is one of the reasons to promote healthy childhood devel-opment in institutions where the children remain for
long periods during a key stage of their growth and
development11-14.
Language is a communication mean, becoming a social instrument used in interactions. In case
of small children, the language dificulties may
result from abnormal development process of the
verbal expression and reception. Therefore, the early identiication of these changes during the
frequencies 5 to 2 (5, 4, 3 and 2 kHz) and signal/ noise ratio ≥ 6. The analyzer used was AUDX of the
Biologicbrand. The result was classiied as “pass” or
“fail”. To pass it was necessary to present adequate
responses in three of the four tested frequencies. The Kolmogorov Smirnov Test that evaluates the behavior of the observations of a group follows a normal distribution was performed. The tested hypothesis is that the observations
present a normal distribution. It was veriied that
it cannot be stated that all study variables are normally distributed. Nonparametric tests were performed for the variables that are not normal.
The exploratory analysis of the variables was
chosen in order to characterize the sample. The
Kruskal-Wallis and Mann-Whitney tests were used
to evaluate the equality between averages. For the normal variables, the T test was used to evaluate the variance between two groups and the ANOVA test was used to detect the difference between averages. To analyze the association between the variables, the Pearson test and Spearman
correlation coeficient were used. In order to ind
a mathematical relationship between the data, the Multiple Linear Regression Analysis was used for the variables provided from a normal population,
checking in the set of independent variables those that most inluence the dependent variables through the backward method. For variables that do not
provide from a normal population with the same goal of the Multiple Regression, the Gamma model was
used with Log link function. Results with conidence interval of 95% and p-value ≤ 0.05 were considered statistically signiicant associations.
The software R version 2.15.0 was used for the entry, processing and analysis of the quantitative data.
RESULTS
The distribution of variables related to age, gender, institution and hearing evaluation are presented in the Table 1.
Subsequently, the characterization of the family environment was performed, in which the RAF questionnaire (Inventory of Resources of the Family Environment) was used, with multiple choice questions and items, elaborated and validated for the Brazilian Portuguese10. The questionnaire presents
as areas of assessment of the resources that
promote the development of proximal, activities that
indicate family stability and parental practices that promote the connection between family and school. It is noteworthy that, for ages between one and two years, an adaptation was made in which items related to leisure and school activities that were not
relevant for the age were excluded. For this purpose
a national reference20 was used. The questionnaire
was applied before entering or leaving the day care center. A relative global score was calculated, and the following formula was used for each one of the
ten topics: gross score/maximum score x 10.
Then, the language of these children was evaluated in a room of the day care center itself,
in individual sessions of approximately 40 minutes,
and, when necessary, in the recreation environment,
using a Communication Proile Protocol21, which
allowed the evaluation of the Communication regarding reception and emission, in addition to the Cognitive Aspects of the Language. The
linguistic aspects covered include lexical-semantic
language, phonological and pragmatic subsystems. The cognitive aspects evaluated include the
devel-opment of seriation, classiication, working memory
and body schema. Although the instrument used is not a standardized test but a protocol of behavior observation, Performance Ratios (ID) were calcu-lated as proposed in the literature22, i. e., the ID
were calculated in percentage in each area, with
maximum value of 100%. The indexes were calcu
-lated considering the number of assessed behaviors less the number of non-observed behaviors, multi-plied by 100 and divided by the number of assessed behaviors22.
Figure 1 presents the scores (total and of subscales) obtained by the ITERS-R Scale for the characterization of the early childhood education institutions. The total score obtained by the ITERS-R in the institution A was 4,28 and in the institution B was 3.94, whereby in the subscales: Oral language and comprehension, Interaction, Program Structure and Parents and staff23 the institution A achieved
better results. The institution B presented higher scores in the subscales: Space and furniture and Personal Care Routines.
Table 1 shows that 64.3% of the children were from the day care center B. Such fact can be
explained by the greater number of enrolled children
and physical space of this day care center. It is also observed that the sample is mainly composed by males, which does not unbalance the sample, since the difference is only 8.6%. Regarding the age, a smaller number (16) of one year old children and the same number (27) of children aged between two to
three years was veriied. Regarding hearing evalu
-ation, most of the sample, 46% failed in the exami -nation of Distortion Product Otoacoustic Emission.
Table 1 – Distribution of the sample according to the variables: age, gender, day care center and hearing evaluation
Variables Statistics
Frequency Percentage Valid Percentage
Age
1 year 16 22,8 22,8
2 years 27 38,6 38,6
3 years 27 38,6 38,6
Total 70 100,00 100,00
Gender
Female 32 45,7 45,7
Male 38 54,3 54,3
Total 70 100,00 100,00
Institution
A 25 35,7 35,7
B 45 64,3 64,3
Total 70 100,00 100,00
OAE
‘Pass’ 27 38,6 54,0
“Fail” 23 32,9 46,0
Total 50 71,40 100,00
Lost Sample 20 28,60 ___ Total 70 100,00 ___
Legend: OAE – Otoacoustic Emissions
Subscales Institution A Institution B
Space and furniture 3,40 4,60 Routines of Personal Care 3,30 4,30 Oral language and comprehension 4,30 3,00
Activities 3,00 3,00
Interaction 5,00 4,00
Program Structure 5,00 4,30 Parents and staff 5,00 4,40
Total score 4,28 3,94
average (0.56). Tables 2, 3 and 4 show the results
of the communication proiles according to the
variables: age, gender and early childhood insti-tution, respectively.
From the areas assessed by the Communication
Proile Protocol, the Communication – Reception
domain presented the highest average (0.66), and Communication – Emission presented the lowest
Table 2 – Association of the Communication Proile with the variable age
Communication Proile Age N Average Standard
deviation Minimum Maximum p-value
Communication Proile Global Index
1,00 12 0,59 0,17 0,33 0,88
0,33
2,00 28 0,58 0,18 0,26 0,88
3,00 25 0,65 0,17 0,21 0,93
Total 65 0,61 0,18 0,21 0,93
Communication Proile Communication-Reception
1,00 12 0,70 0,25 0,25 1,00
0,02*
2,00 28 0,57 0,24 0,25 1,00
3,00 25 0,74 0,17 0,25 1,00
Total 65 0,66 0,23 0,25 1,00
Communication Proile Communication-Emission
1,00 12 0,42 0,23 0,18 0,91
0,03
2,00 28 0,56 0,22 0,18 1,00
3,00 25 0,64 0,24 0,00 1,00
Total 65 0,56 0,24 0,00 1,00
Communication Proile Cognitive Aspects of the Language
1,00 12 0,75 0,14 0,44 1,00
0,06
2,00 28 0,64 0,22 0,17 1,00
3,00 25 0,59 0,15 0,33 0,89
Total 65 0,64 0,19 0,17 1,00
ANOVA
* the Kruskal-Wallis test was used for this variable, since it does not have a normal distribution.
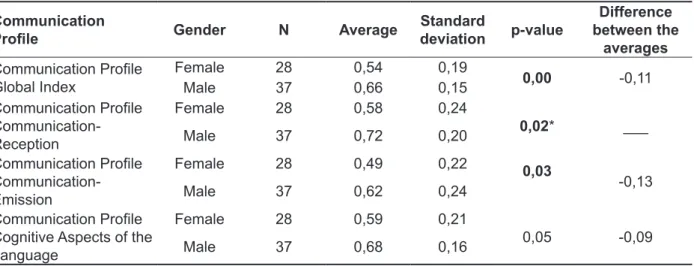
Table 3 – Association of the Communication Proile with the variable gender
Communication
Proile Gender N Average deviationStandard p-value
Difference between the
averages
Communication Proile Global Index
Female 28 0,54 0,19
0,00 -0,11 Male 37 0,66 0,15
Communication Proile
Communication-Reception
Female 28 0,58 0,24
0,02* ___
Male 37 0,72 0,20
Communication Proile
Communication-Emission
Female 28 0,49 0,22
0,03
-0,13 Male 37 0,62 0,24
Communication Proile
Cognitive Aspects of the Language
Female 28 0,59 0,21
0,05 -0,09 Male 37 0,68 0,16
Test –T
Family Environment showed that the question related to schedules and routines presented the highest average (7.47), while the question related to planned activities presented the lowest average (0.24).
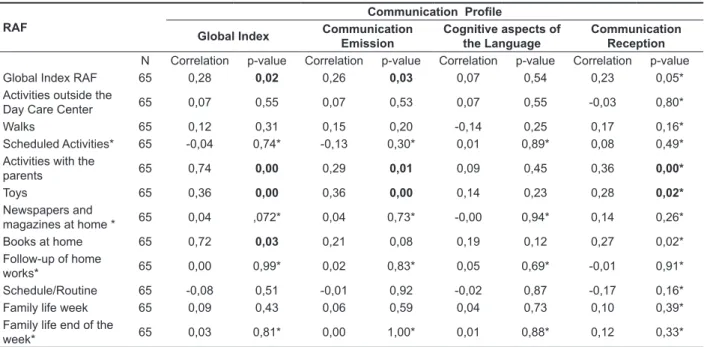
Table 5 shows the results of the communication
proile (global and domain index) and its association
with the results (global and per question) of the Inventory of Resources of the Family Environment. The analysis of the Inventory of Resources of the
Table 4 – Association of the Communication Proile with the variable day care center
Communication Proile Institution N Average Standard
deviation p-value
Difference between the
averages
Communication Proile
Global Index AB 2243 0,660,58 0,200,16 0,10 0,07
Communication Proile
Communication-Reception
A 22 0,73 0,25
0,03* ___
B 43 0,62 0,21
Communication Proile
Communication-Emission
A 22 0,62 0,27
0,19 0,08 B 43 0,53 0,22
Communication Proile
Cognitive Aspects of the Language
A 22 0,66 0,19
0,70 0,01 B 43 0,64 0,19
Test –T
* the Mann-Whitney test was used for this variable, since it does not have a normal distribution.
Table 5 – Association of the Communication Proile and inventory of the family resources
RAF
Communication Proile
Global Index Communication
Emission
Cognitive aspects of the Language
Communication Reception
N Correlation p-value Correlation p-value Correlation p-value Correlation p-value
Global Index RAF 65 0,28 0,02 0,26 0,03 0,07 0,54 0,23 0,05*
Activities outside the
Day Care Center 65 0,07 0,55 0,07 0,53 0,07 0,55 -0,03 0,80*
Walks 65 0,12 0,31 0,15 0,20 -0,14 0,25 0,17 0,16*
Scheduled Activities* 65 -0,04 0,74* -0,13 0,30* 0,01 0,89* 0,08 0,49* Activities with the
parents 65 0,74 0,00 0,29 0,01 0,09 0,45 0,36 0,00*
Toys 65 0,36 0,00 0,36 0,00 0,14 0,23 0,28 0,02*
Newspapers and
magazines at home * 65 0,04 ,072* 0,04 0,73* -0,00 0,94* 0,14 0,26*
Books at home 65 0,72 0,03 0,21 0,08 0,19 0,12 0,27 0,02*
Follow-up of home
works* 65 0,00 0,99* 0,02 0,83* 0,05 0,69* -0,01 0,91*
Schedule/Routine 65 -0,08 0,51 -0,01 0,92 -0,02 0,87 -0,17 0,16*
Family life week 65 0,09 0,43 0,06 0,59 0,04 0,73 0,10 0,39*
Family life end of the
week* 65 0,03 0,81* 0,00 1,00* 0,01 0,88* 0,12 0,33*
Legend: RAF-Inventory of Resources of the Family Environment / toys
Pearson Test
of multiple regression were adjusted in order to estimate the association between the results of speech therapy evaluations and evaluations of the environmental resources.
It is noteworthy that, in all models for analysis of
the explanatory variables, the null hypothesis was
rejected. Thus, the models were adjusted to the proposed study.
In order to verify possible causal relationships
between variables, ive statistical models were
analyzed by multiple regression. The multiple regression analysis should be performed when
a phenomenon cannot be explained by a single
causal agent but by a multiplicity of factors, therefore a dependent variable must be placed as a function
of several explicative variables24. Thus, the models
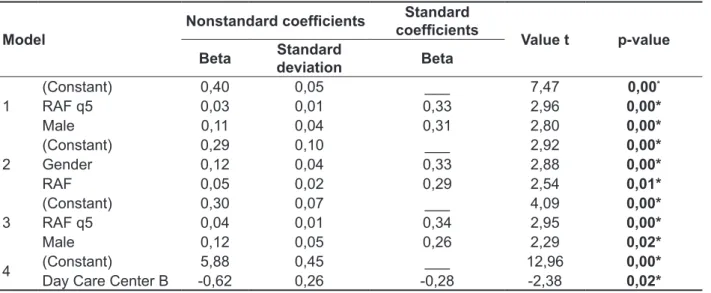
Table 6 – Presentation of the results of multiple regression
Model
Nonstandard coeficients coeficientsStandard
Value t p-value Beta Standard
deviation Beta
1
(Constant) 0,40 0,05 ___ 7,47 0,00*
RAF q5 0,03 0,01 0,33 2,96 0,00*
Male 0,11 0,04 0,31 2,80 0,00*
2
(Constant) 0,29 0,10 ___ 2,92 0,00*
Gender 0,12 0,04 0,33 2,88 0,00*
RAF 0,05 0,02 0,29 2,54 0,01*
3
(Constant) 0,30 0,07 ___ 4,09 0,00*
RAF q5 0,04 0,01 0,34 2,95 0,00*
Male 0,12 0,05 0,26 2,29 0,02*
4 (Constant) 5,88 0,45 ___ 12,96 0,00* Day Care Center B -0,62 0,26 -0,28 -2,38 0,02* Legend: RAF Q5 – question 5 of the Inventory of Resources of the Family Environment / toys.
Test T
Four models of multiple regression are shown in
Table 6. When performing the analysis of the model
one, it is possible to identify that, when the variable RAF-question 5, related to which and how many toys the child has at home, increases by one unit,
the Communication Proile variable (Global Index)
increases 0.03 units in average.
The analysis of the model two enables us to
deduce that, when the RAF variable (Global Index)
increases by one unit, the variable Communication
Proile (Global Index) increases 0.05 units in
average.
The model three demonstrates that, when the variable RAF-question 5, which is related to which and how many toys the child has at home, increases
by one unit, the variable Communication Proile
(Communication – Emission) increases 0.04 units in average.
The analysis of the model four suggests that
the variable RAF (Global Index) has a statistically signiicant positive relation with the variable early
childhood education institution, whereby when the variable institution is B (public), the average RAF
variable (Global Index) tends to decrease in 0.62
development, up to three years old, in critical period of cognitive, motor and language15,30,31 acquisitions.
The analysis of the Inventory of Resources of the
Family Environment, in turn, can be explained by the
age range studied: children in this age should have
more regular schedule for daily activities like lunch,
bathing, time to sleep, and it is not common that
these children participate in regular extracurricular
activities such as English classes and sports. The literature shows that the organization of routines and activities in the childhood education is a challenge for educators and technical staff of the institutions32
since the families may present different routines. This fact contributes for the diversity of habits and routines of children in early childhood institutions.
The result analysis of the ITERS-R Scale, shows that, in subscales more dependent on economic factors (space and furniture), the institution B achieved better scores. In turn, the institution A has obtained the best scores in the subscales dependent on human resources (personal care routine) and professional performance (oral language and comprehension). The care offered
in early childhood institutions is primarily linked
to the physical part of the children and not to the attention related to emotional aspects or stimulation for the development of the children. Such actions are individually performed by educators, not being determined by the coordination of the institution6,13.
This is also corroborated by the literature that reports that the conceptions and practices of care/
education vary in part according to the expecta -tions that each educator has in relation to children and the types of relationships established between educator-child and also between child-child7,23,33. It
must be highlighted that the literature reveals that the majority of educators believe that children at this age do not need stimulus, they are just in the daycare center, because it is a place where they are
sheltered while their parents are working, and have dificulty to overcome impoverished care routines
with food and hygiene, therefore not incorporating the practices that lead to the full development of the children3,11.
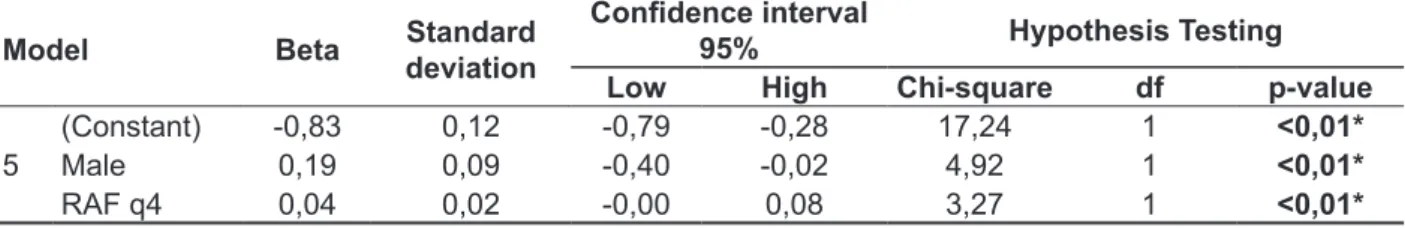
Table 7 shows the Gama model as a log function. After analysis of the model 5, a statistically signif-icant positive relationship between Communication
Proile (Communication and Reception) with the
question 4 (Activity with the parents) of the Inventory of Resources of the Family Environment (RAF) and with males.
DISCUSSION
Most of the sample in the hearing evaluation,
46%, failed in the Examination of Distortion Product Otoacoustic Emission. This examination assesses
the integrity of the outer hair cells (inner ear), but this requires an appropriate function of the middle ear. One factor to consider is that, according to the literature, 80% of the children have otitis at least once until eight years old and the recurrent otitis is increasing in the last decades, especially in developing countries16. It must be highlighted that
also the excess of environmental noise could be another factor to inluence the test results, as for the
realization of the otoacoustic emissions the level of
background noise should not exceed 55 dBA25.
Despite the Registered Brazilian Standard (NBR) 1015226 suggests that the noise level for educational
environments should not exceed 55 dBA, studies
show that higher levels are found in these environ-ments27-29. Thus, the high incidence of failures in
the hearing evaluation may have been caused by
excessive noise of the environment, or by a high
number of children with otitis. The data could not be proven because no measurements of acoustic immitance or measurement of the environmental noise, which is one limitation of the present study, were performed.
The fact that the higher average in the
Communication Proile Protocol was in the
Communication – Reception domain can be
explained by the development sequence of the communication of the individuals: irst, they
acquire the ability to receive and then develop the ability to send. It is noteworthy that the sample comprises children still in the age of communication
Table 7 – Presentation of the results of the Gama Model with Log link function
Model Beta Standard
deviation
Conidence interval
95% Hypothesis Testing
Low High Chi-square df p-value
5
(Constant) -0,83 0,12 -0,79 -0,28 17,24 1 <0,01*
Male 0,19 0,09 -0,40 -0,02 4,92 1 <0,01*
RAF q4 0,04 0,02 -0,00 0,08 3,27 1 <0,01* Legend: RAF q4 – question 4 of the Inventory of Resources of the Family Environment.
objective tests it can provide important information about the child’s hearing. Even so, more than half of the sample presented OAEs, indicating the absence of hearing loss greater than 30-40 dBHL and do not present conductive loss.
It is worth noting that this study was not an
exhaustive research on school-child-family triad, but only seeks to bring attention to the issue and its
relation with the communication development. Thus, it is necessary to go further in the discussion and
seek jobs with other methodological designs, such
as longitudinal studies.
Regarding the Communication Proile, it was
observed that the Communication – Reception domain presented the highest average, and the Communication – Emission the lowest average.
Featuring the educational environment, it was observed that the total score obtained through ITERS-R was higher in the institution A, and it was repeated in the subscales: Oral language and comprehension, Interaction, Program Structure and Parents and staff. The day care center B, in turn, presented higher scores in the subscales: Space and furniture and Personal Care Routines.
The characterization of the stimulation resources present in the family environment through the Inventory of Resources of the Family Environment, has enabled to observe that the question 9 (Schedule/Routine) presented the highest average, and the question 3 (Programmed Activities), the lowest. Such data may indicate that, in the scope of the family environment, the attention to the child routine is more important than the schedule of activities. This fact mainly relies on the age range studied, since language, sport and cultural activities are not considered priorities in the range of one to 24 months.
Data such as those of the present study may be relevant for the speech practice, because it is
possible to consider these indings as issues for
discussion about actions to foster health in early childhood education and in the discussion about the development of children aged between one and three years. It is worth stressing that the literature has valued studies on the evolution of the attention
prospect and inluence of interactional and environ -mental factors in the development of children in the childhood education 36-40.
CONCLUSION
It is noticed that the greater exposure of the
children to toys, the greater their chances of having better communication performance. Such result corroborates the literature that reports the direct
inluence of stimulation in the family environment
for the childhood development10. The consulted
sources indicate the direct inluence of the variety
and quality of stimulation available for the child in the family environment on the development of the child and cognitive performance8.
The contexts in which the individual develops may
contribute to the development, being the family the main source of support to the child9. It is necessary
to go beyond the children, beyond the developing
individuals and enclose them within the network of
meanings where they are inserted17, 18. The literature
emphasizes that the home environment is the irst
socialization environment of the human being, so it is essential to understand the aspects related to the growth and development of the children in the family
context and reality34.
Although the institution A has obtained the highest average in the ITERS-R scale, indicating improved environmental resources, the analysis of socio-demographic data of the City Hall of Belo Horizonte shows that the institution B is in a region with higher socioeconomic indicators. It means that there is no correspondence between sociodemo-graphic factors and favorable school environment35,
what is not supported by the reviewed literature36.
It is worth noting that this assumption should
be carefully veriied, since establishing a direct
relationship between economic factors and
devel-opment may be an inappropriate simpliication in
the discussion of the human development. Other
intrinsic and extrinsic conditions in which each child
is inserted must be considered. Thus, in this study, other variables that were not considered may have
inluenced the results.
It is noteworthy to remember that parents who share part of their free time with the children, providing them with various enriching cultural and educational activities, foster the cognitive devel-opment, school performance and interpersonal adjustment9.
REFERENCES
1. BRASIL. Lei de Diretrizes e Bases da Educação Nacional. Lei nº 9.394/96,de 20 de dezembro de 1996. Estabelece as diretrizes e bases da educação
nacional. Diário Oicial da União, Brasília, DF, 23
dez. 1996.
2. Lordelo ER, Bichara ID. Revisitando as funções
da imaturidade: uma relexão sobre a relevância
do conceito na Educação Infantil. Psicol. USP [periódico na internet]. 2009;[Acesso em: 10 de
julho de 2013] 20(3):337-54. Disponível em http://
pepsic.bvsalud.org/pdf/psicousp
3. Vieira LMF. A educação infantil e o plano nacional de educação: as propostas da CONAE 2010.Educ Soc.[periódico na internet].2010;[Acesso em de
• Communication Proile (Communication and
Reception) and Inventory of Resources of the Family Environment (Activity with the parents); There was an interrelationship between the assessed environmental resources, as evidenced
by the statistically signiicant positive association
between the Inventory of Resources of the Family Environment and early childhood institution.
• Communication Proile (Global Index) and
Inventory of Resources of the Family Environment (Toys);
• Communication Proile (Global Index) and
Inventory of Resources of the Family Environment
(Global Index);
• Communication Proile (Communication and
Emission) and Inventory of Resources of the Family Environment (Toys);
10 junho de 2013] 31(112):809-31. Disponível em
http://www.scielo.br/pdf/es/v31n112/09.pdf
4. Campos MM, Esposito YL, Bhering E, Gimenes N, Abuchaim B. A qualidade da educação infantil: um estudo em seis capitais Brasileiras. Cad Pesqui. [periódico na internet]. 2011; [Acesso em
de 10 junho de 2013]41(142):20-54. Disponível
emhttp://www.scielo.br/scielo.php?pid=S0100-15742011000100003&script=sci_arttext
5. Souza NN. Concepções de educadoras de creche
sobre o desenvolvimento da criança na faixa etária
de zero a três anos [dissertação]. Curitiba (PR), Universidade Federal do Paraná; 2008.
6. Moreira ARCP. Os bebês e os espaços da creche : um estudo de caso. R Educ Públ. [periódico na internet]. 2013; [Acesso em de 10
RESUMO
Objetivo: analisar o desenvolvimento da comunicação de crianças de um a três anos frequenta-doras de duas instituições de educação infantil da cidade de Belo Horizonte segundo as variáveis: ambientes familiar e escolar. Métodos: foram avaliadas 70 crianças regularmente matriculadas, de um a três anos. Inicialmente, o ambiente da creche foi avaliado segundo a Escala Infantand Toddlers Environment Rating Scale-Revised, posteriormente foi realizada a caracterização do ambiente fami-liar, utilizando-se o Inventário de Recursos do Ambiente Familiar. Foram realizadas avaliações de
lin-guagem e audição, por meio do Protocolo de Peril Comunicativo e Emissões Otoacústicas. Optou-se pela análise exploratória das variáveis, a im de caracterizar a amostra. Em seguida, foi realizada aná
-lise de regressão múltipla, a im de buscar uma relação matemática entre os dados, veriicando, no
conjunto de variáveis independentes, as que mais inluenciam a variável dependente. Resultados:
observou-se que 54% da amostra são do sexo masculino, 46% falharam na triagem auditiva, e a
maior média no Protocolo de Peril Comunicativo foi no domínio Comunicação – Recepção. Em rela
-ção ao ambiente escolar, os maiores escores foram obtidos na institui-ção A. Houve inter-rela-ção
entre peril comunicativo e inventário de recursos do ambiente familiar. Conclusão: os resultados do
estudo corroboram a literatura que relata a inluência direta de estímulos ambientais no desenvolvi
-mento infantil e airma também que os contextos onde o indivíduo se desenvolve podem contribuir para o seu desenvolvimento, sendo a família e a escola as principais fontes de suporte à criança. Desse modo, é preciso aprofundar os estudos quanto à tríade criança-escola-família.
DESCRITORES: Fonoaudiologia; Creches; Desenvolvimento Infantil; Meio Ambiente; Linguagem
15. Prates LPCS, Martins VO. Distúrbios da fala e
da linguagem na infância. Rev Med Minas Gerais.
2011;21(S3):S54-S60.
16. Lima-Gregio AM, Lucila LL, Feniman MR. Otite média recorrente e habilidade de localização sonora em pré-escolares. Rev CEFAC. [periódico na internet]. 2010; [Acessado em 10 de junho de
2013]12(6):1033-40. Disponível em: http://www.
scielo.br/pdf/rcefac/2010nahead/80-09.pdf
17. Barros S, Cruz O. Participação das mães na
creche e no jardim de infância em Portugal. Rev
Amazônica [periódico na internet]2013;[Acesso em
15 de maio de 2013] 8(1):8-32. Disponível em:http://
dialnet.unirioja.es/servlet/articulo?codigo=4046090 18. Rossetti-Ferreira MC, Amorim KS, Oliveira ZMR. Olhando a criança e seus outros: uma trajetória de pesquisa em educação infantil. Psicol USP. [periódico na internet].2009; [Acesso em
de 10 junho de 2013]20(3):437-64. Disponível
em:
http://www.scielo.br/scielo.php?pid=S0103-65642009000300008&script=sci_arttext
19. Lima ABR, Bhering E. Um estudo sobre creches como ambiente de desenvolvimento. Cad Pesqui. [periódico na internet].2006;[Acesso em 10 de junho
de 2013]36(129):573-96. Disponível em http://www.
scielo.br/pdf/cp/v36n129/a0436129.pdf
20. Papalia DE, Olds SW. Desenvolvimento
Humano. 1ª d. Porto Alegre: Artes Médicas Sul; 2000.
21. Chiari BM, Nakagwa CS, Cormedi EA, Silva MA,
Mattos NS, Cardoso, RM. Proposta de Sistematização de dados da avaliação fonoaudiológica através da observação de comportamentos de crianças de 0 a 6 anos. Pró-Fono R Atual Cient.1991;3(2):29-36. 22. Santos JN, Lemos SMA, Rates SPM, Lamounier JA. Anemia em crianças de uma creche pública e as repercussões sobre o desenvolvimento de linguagem. Rev paul pediatr. [periódico na internet]. 2009; [Acesso em 10 de junho de 2013]27(1):67-73.
Disponível em http://www.scielo.br/pdf/rpp/
v27n1/11.pdf
23. Barros RP, Carvalho M, Franco S, Mendonça R, Rosalém A. Uma avaliação do impacto da qualidade da creche no desenvolvimento infantil. Pesq Planej Econ (PPE). [periódico na internet]2011; [Acesso
em 1º dezembro de 2012]41(2):213-32.[Disponível
em http://www.sae.gov.br/primeirainfancia/Artigo_ PPE.pdf
24. Vieira S. Bioestatística: tópicos avançados. 2
ed. Rio de Janeiro, Elsevier : Ed. Campus, 2003.
25. American Speech-Language-Hearing Association ASHA. The Guidelines for Audiologic
junho de 2013]1(49):305-25. Disponível emhttp:// periodicoscientificos.ufmt.br/ojs/index.php/
educacaopublica/article/view/917/718
7. Lucisano RV, Pfeifer LI, Pinto, MPP, Santos JLF. Interações sociais de crianças pré-escolares
com Síndrome de Down durante atividades extracurriculares. Rev Bras Enferm. [periódico
na internet]. 2013;[Acesso em 15 de maio de
2013]66(1):116-22.Disponível em:http://www.scielo.
br/pdf/reben/v66n1/v66n1a18.pdf
8. Filho FL, Medeiros SM, Lamy ZC, Moreira MEL. Ambiente domiciliar e alterações do desenvolvimento em crianças de comunidade da
periferia de São Luís – MA. Ciênc. Saúde Coletiva
[periódico na internet]. 2011; [Acessado em 10 de
junho de 2013]16(10):4181-7.[Disponível em:http://
www.scielo.br/scielo.php?pid=S141312320110011
00023&script=sci_arttext
9. Romski MA, Sevcik RA, Adamson LB.
Randomized comparison of augmented and nonaugmented language interventions for toddlers with developmental delays and their parents. J Speech Lang Hear Res [periódico na internet]. 2010; [Acessado em 2013 junho 10] 53:350-64.
Disponível em http://jslhr.asha.org/cgi/content/
abstract/53/2/350
10. Marturano EM. O inventário de recursos
do ambiente familiar. Psicol Relex Crit.
2006;19(3):498-506.
11. Carabolante AC, Ferriani MGC. O crescimento
e desenvolvimento de crianças na faixa etária de
12 a 48 meses em creche na periferia da cidade de Ribeirão Preto – SP. Revelet de enferm. [periódico na internet]. 2003;[Acesso em 10 junho
de 2013]5(1):28-34. Disponível em http://www.fen.
ufg.br/fen_revista/
12. Biscegli TS, Polis LB, Santos LM, Vicentin M. Avaliação do estado nutricional e do desenvolvimento neuropsicomotor em crianças frequentadoras de creche. Rev paul pediatr. 2007;24(4):323-9.
13. Mendes JCP, Pandoli MM, Carabetta JV,
Colombo-Souza PNNF. Fatores associados a alteração da linguagem em crianças pré-escolares. Rev soc Bras Fonoaudiol. [periódico na internet]. 2012; [Acesso em 12 de dezembro de 2012]
17(2):177-81. Disponível em: duc://www.scielo.
br/scielo.php?script=sci_arttext&pid=S1516-80342012000200013&lng=en. duc://dx.doi.
org/10.1590/S1516-80342012000200013.
33. Eltink CF. Indícios utilizados para avaliar o
processo de integração de bebês em uma creche [dissertação]. Ribeirão Preto (SP): Faculdade de
Filosoia, Ciências e Letras de Ribeirão Preto,
Universidade de São Paulo; 1999 [Acesso em
10 de junho de 2013]. Disponível em: http://www.
worldcat.org/title/indicios-utilizados-para-avaliar-o-processo-de-integracao-de-bebes-em-uma-creche/ oclc/55914381
34. Paiano M, Andrade BB, Cazzoni E, AraújoJJ,
Waidman MAP, Marcon SS. Distúrbios de conduta
em crianças do ensino fundamental e sua relação com a estrutura familiar. Rev Bras Crescimento Desenvolv Hum. 2007; [Acesso em de 10 junho
de 2013] 17(2):111-21. Disponível em: http://www.
revistas.usp.br/jhgd/article/download/19838/21910.
35. Estatísticas e Mapas de Belo Horizonte. Portal
da Prefeitura de Belo Horizonte [Acesso em 15 de
jan de 2010]. Disponível em:http://portalpbh.pbh.
gov.br/pbh/ecp/comunidade.do?evento=portlet&pId
Plc=ecpTaxonomiaMenuPortal&app=estatisticas&t ax=9085&lang=ptBR&pg=5922&taxp=0&
36. SoejimaCS, Bolsanello MA. Programa de Intervenção e Atenção Precoce com Bebês na Educação Infantil. Educar em Revista. 2012;43:65-79.
37. ScopelRR, Souza VC, Lemos SMA. A inluência
do ambiente familiar e escolar na aquisição e no desenvolvimento da linguagem: revisão de literatura. Rev CEFAC [periódico na internet]. 2012;[Acesso
em de 10 junho de 2013]14(4):732-41. Disponível
em http://www.scielo.br/pdf/rcefac/v14n4/33-11.pdf 38. Mendonça JE, Lemos SMA. Promoção da saúde e ações fonoaudiológicas em educação infantil. Rev CEFAC [periódico na internet]. 2011; [Acesso em
de 10 junho de 2013]13(6):1017-30. Disponível em:
http://www.scielo.br/pdf/rcefac/v13n6/194_10.pdf 39. Amorim KS, Anjos AM, Rossetti-Ferreira MC. Processos Interativos de Bebês em Creche.
PsicolRelex Crit. 2012;25:1-12.
40. Rutanen N. Crianças de dois anos de idade como coconstrutoras de cultura. Psicol USP [periódico na internet]. 2009;[Acesso em de 10
junho de 2013]20(3):375-87. Disponível em:
http://www.scielo.br/scielo.php?pid=S0103-65642009000300005&script=sci_arttext
acústico procedimento. Rio de Janeiro: Associação
Brasileira de Normas Técnicas, 1987. Disponível
em http://www.ebah.com.br/content/ABAAAAfYEAI/ nbr-10152-niveis-ruido-conforto-acustico
27. JaroszewskiGC,Zeigelboim BS, Lacerda A. Ruído
escolar e sua implicação na atividade de ditado. Rev CEFAC. [periódico na internet] 2007;[Acesso em
de 10 junho de 2013];9(1):122-32. Disponível em: http://www.scielo.br/scielo.php?script=sci_arttext&
pid=S1516-18462007000100016
28. Gonçalves VSB, Silva LS da, Silva MC
da, Coutinho AS. Estudoendêmico do ruído
e da inteligibilidade de fala dos professores:
umcomparativo entre duas escolas. XXVI ENEGEP,
2006 out9-11 Fortaleza, CE, Brasil.Acessado em: 10
de junho de 2013 Disponível em: http://www.abepro.
org.br/biblioteca/ENEGEP2006_TR500335_7316. pdf
29. Nascimento LS, Lemos SMA. A inluência do ruído ambiental no desempenho de escolares nos
testes de padrão tonal de frequência e padrão tonal de duração. Rev CEFAC [periódico na internet] 2012;[Acesso em de 10 junho de
2013]14(3):390-402. Disponível em http://www.scielo.br/pdf/rcefac/
v14n3/170-10.pdf
30. Braga AKP, Rodovalho JC, Formiga CKMR. Evolução do crescimento e desenvolvimento neuropsicomotor de crianças pré-escolares de zero
a dois anos do município de Goiânia (GO). Rev
Crescimento desenvolv Hum. [periódico na internet]. 2011;[Acesso em de 10 junho de 2013] 21(2):230-9.
Disponível em http://pepsic.bvsalud.org
31. Limissuri RCA, Bei-Lopes DM. Fonologia
e vocabuláriona percepção de educadoras sobre comunicação de pré-escolares. Rev Est Pedag. 2009;[Acesso em de 10 junho de 2013]
90(225):433-48. Disponível em http://www. emaberto.inep.gov.br/index.php/RBEP/article/
viewFile/1358/1255
32. Campos MM. Educar crianças pequenas: em
busca de um novo peril de professor. Retratos da
Escola. 2008;[Acesso em de 10 junho de 2013] 2(
2-3):121-31.Disponível em: duc//www.esforce.org.
br.
Received on: August 08, 2013 Accepted on: March 29, 2014 Mailing address:
Stela Maris Aguiar Lemos
Av. Prof. Alfredo Balena, 190 sala 251 Belo Horizonte – MG – Brasil
CEP 30130-100