Rev Bras
Cineantropom
Hum
DOI: http://dx.doi.org/10.5007/1980-0037.2018v20n5p456
original article
Sedentary time and perceived neighborhood
environment in adolescents aged 12-17 years
Tempo sedentário e ambiente percebido sobre o bairro
em adolescentes de 12 a 17 anos
Tais Taiana Sarabia1
Mariana Silva dos Reis1
Priscila Bezerra Gonçalves1,2
Rodrigo Siqueira Reis1,3,4
Abstract – The environment around the residence could contribute to attenuate or increase time spent in sedentary activities, and in low energy expenditure activities (1.5 METS) in adolescents. The aim of this study was to analyze the association between sedentary time and perceived neighborhood environment in adolescents aged 12-17 years living in south-ern Brazil. This was an observational cross-sectional study conducted from August 2013 to May 2014, with a sample of adolescents (12-17 years), recruited from 32 census tracts in Curitiba, Brazil. All census tracts were selected according to walkability and income characteristics. Perceived environment was assessed through the NEWS-Y questionnaire, and sedentary time along seven days was obtained through accelerometers (GT1M, GT3x and GT3x+). Linear regression models were used to test the associations, and included age, nutritional status, socioeconomic level and education level as confounding variables. All analyses were performed considering p-value <0.05 through SPSS software 20.0. The analytical sample included 364 adolescents (girls=50.5%; mean age=14.7, SD=1.7) with valid accelerometry data, showing on 489.6 minutes/day (SD=99.5) spent in sedentary time activities. After adjusting for confounding variables, only the perception of places for walking and cycling remained associated with sedentary time for both boys (B=-23.402, p=0.016) and girls (B=-15.572; p=0.079). Perception of places for walking and cycling has an inverse relationship with sedentary time among adolescents living in places with extremes of walkability and income.
Key words: Adolescent; Urban area; Sedentary lifestyle.
Resumo – O ambiente no entrono da residência pode contribuir para atenuar ou acentuar o tempo em atividades sedentárias em adolescentes. Objetivou-se avaliar a associação entre o tempo sedentário e a percepção do ambiente sobre o bairro em adolescentes de 12 a 17 anos residentes no sul do Brasil. Este foi um estudo transversal realizado entre os meses Agosto, 2013 e Maio, 2014, em uma amostra de adolescentes, recrutados em 32 setores censitários da cidade de Curitiba-PR, Brasil. Os setores foram selecionados de acordo com as características de walkability e renda. O ambiente percebido foi avaliado com o questionário NEWS-Y. O tempo sedentário foi avaliado de maneira objetiva por meio de acelerômetros (GT1M, GT3x e GT3x+) durante sete dias consecutivos. Modelos de regressão linear foram empregados para testar as associações, sendo consideradas como variáveis de confundimento a idade, o estado nutricional, o nível socioeconômico e a escolaridade. As análises foram realizadas considerando o valor de p<0,05 através do software SPSS 20,0. A amostra analítica contou com 364 adolescentes com dados válidos de acelerômetros (meninas=50,5%; idade média=14,7 anos, DP=1,7 anos), tendo apresentando 489,6 minutos/dia (DP=99,5 minutos/dia) de tempo em atividades sedentárias. Após ajuste para as variáveis de confundimento apenas a percepção de lugares para caminhar e para pedalar manteve-se associada com tempo sedentário tanto para meninos (B=-23,402; p=0,016) quanto para meninas (B=-15,572; p=0,079). A percepção de locais para caminhar e pedalar tem relação inversa com tempo sedentário entre adolescentes residentes em locais com extremos de walkability nível socioeconômico.
1 Pontifical Catholic University of Paraná. Research Group on Physical Activity and Quality of Life. Curitiba, PR. Brazil.
2 Pontifical Catholic University of Paraná. Graduate Program in Health Technology Curitiba, PR. Brazil.
3 Washington University in Saint Louis. Brown School. Prevention Research Center. Saint Louis, USA.
4 Pontifical Catholic University of Paraná. Graduate Program in Urban Management. Curitiba, PR. Brazil.
Received: November 17, 2017
INTRODUCTION
The social, economic and technological changes that have occurred in the last decades have contributed to marked changes in the behavior of children and adolescents, especially regarding physical activity (PA) and sedentary time (ST)1. Current recommendations suggest that children and adolescents
should limit their ST2 to a maximum of two hours a day. However, the
current scenario is increasingly distant from this recommendation, since more than half of Brazilian adolescents spend at least two hours a day or more watching television and / or sitting on a common weekday for more than three hours involved in other activities such as computer use, video games and other activities3. Studies conducted in developed countries have
indicated that these values are even more worrisome, since adolescents spend between 5.5 and 8.5 hours per day on ST4.
Prolonged exposure to ST is associated with a number of negative health indicators, including increased risk of all-cause mortality, problems related to sleep, attention, and learning impairments5,6. Moreover, excess
ST is also associated with a higher incidence of obesity, lower levels of PA and higher consumption of foods rich in calories and fat7. In addition,
people who adopt ST in childhood and adolescence tend to maintain or increase this behavior in adulthood1.
The environment around the residence to which adolescents are exposed can attenuate or accentuate their ST. For example, access to places suitable to play, adequate knowledge about the neighborhood in which they live, positive standards for PA in the neighborhood, and high perceived safety that mothers have about the neighborhood have an inverse relationship with screen time4. In addition, the size of open public spaces, dead-end streets,
and the quality of parks and playgrounds in the neighborhood is inversely related to computer and video game time in children8. On the other hand,
domestic access to devices such as video game, computer and television showed positive association with screen time4. In Brazil, there is still lack
of evidence on the relationship between the neighborhood environment and home with ST, the associations found are still weak, inconsistent with international literature and from studies with self-reported ST measures9.
The aim of this study was to evaluate the association between ST and perceived environment characteristics in adolescents aged 12-17 years.
METHODOLOGICAL PROCEDURES
This is a cross-sectional study in the form of a household survey and com-bined objective measures (accelerometers) and self-reports (questionnaires). Data were extracted from a larger project called ESPAÇOS Adolescentes. This project aims to investigate the association between the built environ-ment, PA and obesity in adolescents10. In Brazil, it was carried out in the
of adolescents living in selected sites and finally visits; in the first visit, the accelerometer was delivered for the adolescent along with the instructions, in the second visit, the accelerometer was collected and an interview with the adolescent was conducted. This project was approved by the Ethics Research Committee of PUCPR (protocol no. 1356.945 / 2012).
Sample selection and data collection
Sampling used census tracts as primary sampling units, which were de-fined from the characteristics of walkability and income. The walkability index of each sector was computed from three environment indicators: residential density, street connectivity and land use mix11. This
informa-tion was made available by the Institute of Research and Urban Planning of Curitiba (IPPUC), based on the geographic information system (GIS). The overall walkability score was obtained after adding the Z score of the three indicators. The median Z score was -1.0409 with minimum values of -2.73 and maximum of 2.67. All census tracts were included (n = 2.395) and for each area, the walkability score was estimated. Sixteen sectors of high and 16 sectors of low walkability were selected, being eight of low income and eight of high income in each category, totalizing 32 census tracts. For income variable, the median was R$ 2.340,40, with minimum of R$ 968,58 and maximum of R$ 5.101,68. From the selection of the census tracts with different characteristics of environment and income, it was possible to select adolescents with gender distribution in order to guarantee statistical power.
Adolescents aged 12-17 years enrolled in the public or private education network of Curitiba-PR, residing in the census tract selected for at least one year, with no physical limitations (which prevented the practice of physical activities) or cognitive limitations (which prevented the comprehension of questions) were considered eligible for this study.
Data collection was performed between August 2013 and June 2014 by the members of the Research Group on Physical Activity and Quality of Life (GPAQ ), all received theoretical and practical training. Data col-lection took place in two moments, at the first moment, the interview with the family head and the delivery of the accelerometer for the adolescent was carried out, in the second moment, the accelerometer was collected, interview with adolescents and anthropometric measurements were per-formed. Both signed the free and informed consent form.
Study instruments and variables
• Independent variableThe Neighborhood Environment Walkability Scale for Youth (NEWS-Y), adapted for Brazilian adolescents12, was used to assess perceptions of the
satisfaction12. All questions related to the characteristics of the
surround-ings of the adolescents’ residence, considering the distance traveled in a 10 to 15 minutes walk from the residence. The validity and reliability of the instrument was tested and showed good agreement in most blocks, with six domains with intra-class correlation coefficient above 0.72 (p <0.05) and cronbach’s alpha above 0.67.
• Dependent variable
ST was determined from measurements obtained with the use of accelerom-eters (Actigraph GT3X Plus, GT3X and GT1M) used in the hip. Devices were programmed to be used for seven consecutive days, with epochs of 30 seconds. ActiLife software version 6.11.5 was used for programming, downloading and processing data. Records containing <60 minutes of con-secutive zeros (without records) in one hour were considered valid, including only those with ≥10 hours (weekday) and ≥8 hours (weekend) with records. Participants who presented valid records for at least five days with at least one day of the weekend were considered eligible for the study13. In all, 44
adolescents (8.8% of the total number of accelerometers sent to the field) did not present valid records and were invited to reuse the accelerometer and 33 successfully re-used them (6.6% of the total). The cutoff point used for sedentary time classification was <100 counts/minute14. The monitoring
during the use occurred by telephone on the 2nd and 5th day of use in order
to verify the correct use and clarify doubts.
• Confounding Variables
Information on sex, age, nutritional status, socioeconomic level and parental schooling was obtained through a questionnaire. Sex was obtained by the observation of interviewers (male and female). Age was calculated from the date of birth. For nutritional status, measures of weight and stature obtained according to Conde and Monteiro were used15.For socioeconomic
status (SES), the questionnaire proposed by the Brazilian Association of Research Companies16 was used, which considers the number of household
appliances, presence of maid and parental schooling, which was reported during the interview with parents.
• Analysis and treatment of data
For the purposes of analysis, variables were treated as follows: the percep-tion of the environment was calculated through a score generated from the sum of items in each domain, obtaining the mean of each domain. ST was analyzed in minutes per day, and age was continuously used. Nutritional status was classified into three categories: a) low weight, b) adequate weight and c) overweight/obesity, according to recommendations of Conde and Monteiro15. SES was classified into three levels: a) low (C1 + C2 + D + E),
Confounding variables with three or more classification levels (SES, nutritional status and parental schooling) were transformed into dummy variables to allow their inclusion in multiple linear regression analyses to identify the specific contribution of each level in the final models. Pearson’s correlation was used to test the association between independent variables and potential confounding variables with the dependent variable, and collinearity was tested by examining the variance inflation factor (FIV). Finally, multiple linear regression analyses were conducted to identify the contribution of the perceived neighborhood environment in adolescents’ ST. Three regression models were created. In the first model, bivariate analyses were performed between individual variables, perceived neighbor-hood environment and ST. In the second model, a multivariate analysis was performed between each domain of the perceived environment and ST adjusted for confounding variables that presented p <0.05 in the bivariate analysis (age, socioeconomic level, parental schooling). In the third model, a multivariate analysis was performed between all domains of the perceived neighborhood environment that presented p <0.05 in model 2 adjusted for confounding variables. Descriptive and linear regression analyses were stratified according to sex and conducted in SPSS software version 20.0, adopting significance level of 5%.
RESULTS
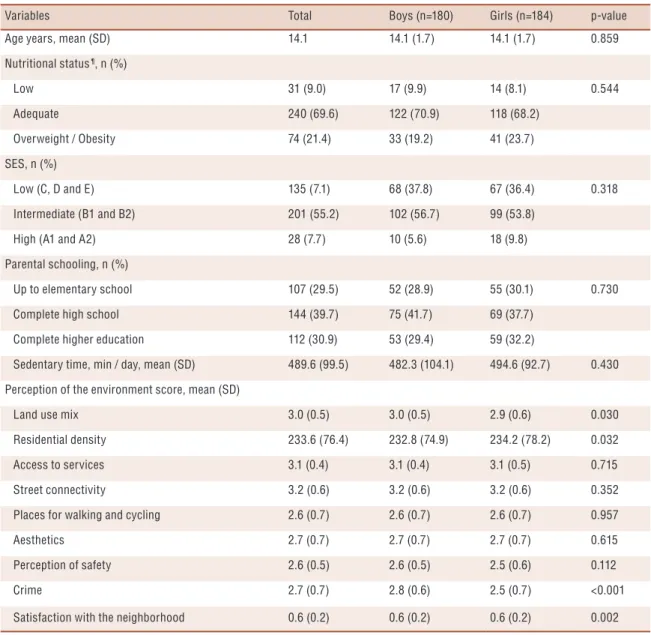
A total of 503 families (one parent and one adolescent per family) par-ticipated in the study. Of these, 364 (72.4%) presented adolescents with valid accelerometer data, and these were included in the analytical sample. No significant differences were found in sociodemographic characteristics between participants with valid and non-valid accelerometry data. Par-ticipants had mean age of 14.1 (SD = 1.7) years, with similar distribution between boys and girls (50.5% girls), predominantly with normal weight (69.6%) and intermediate socioeconomic status (55.2 % classified in strata B1 and B2). Regarding schooling of the family head, 39.7% (n = 144) re-ported having completed high school. The adolescents spent, on average, 489.6 (SD = 99.5) minutes per day in ST (Table 1).
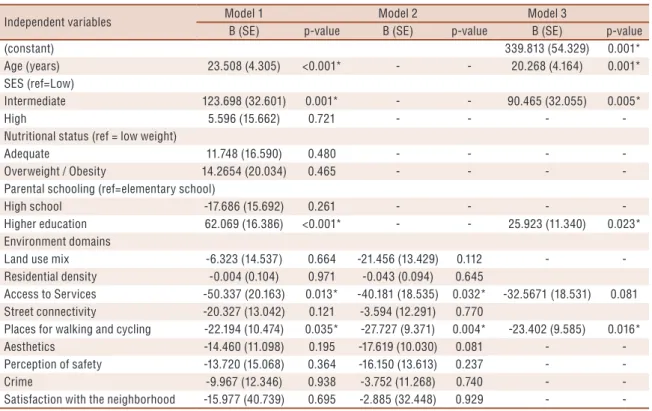
higher education (B = 25.923, p = 0.023) and perception of places for walk-ing and cyclwalk-ing (B = -23.402, p = 0.016) showed significant associations. Table 3 presents the results of the linear regression models between ST and perceived environment for girls. Model 1 presents the bivariate analysis data, and only variable age (B = 18.494; p <0.001) was associated with ST. In the model 2, the results of the bivariate analyses between environment domains and ST, adjusted for confounding variables that showed p <0.05, showed that land use mix (B = -23.412; p = 0,051) and perception of places for walking and cycling (B = -17.603; p = 0.046) presented significant as-sociations. Finally, in model 3, composed of confounding variables and perceived environment variables that presented p <0.05, the results showed that age (B = 20.648, p = 0.001) and perception of places for walking and cycling (B = -15.572, p = 0.079) maintained significant results.
Table 1. Description of sociodemographic characteristics, sedentary time and perceptions of the neighborhood environment of study
participants. Curitiba, PR, Brazil (n = 364).
Variables Total Boys (n=180) Girls (n=184) p-value
Age years, mean (SD) 14.1 14.1 (1.7) 14.1 (1.7) 0.859
Nutritional status ¶, n (%)
Low 31 (9.0) 17 (9.9) 14 (8.1) 0.544
Adequate 240 (69.6) 122 (70.9) 118 (68.2)
Overweight / Obesity 74 (21.4) 33 (19.2) 41 (23.7)
SES, n (%)
Low (C, D and E) 135 (7.1) 68 (37.8) 67 (36.4) 0.318
Intermediate (B1 and B2) 201 (55.2) 102 (56.7) 99 (53.8)
High (A1 and A2) 28 (7.7) 10 (5.6) 18 (9.8)
Parental schooling, n (%)
Up to elementary school 107 (29.5) 52 (28.9) 55 (30.1) 0.730
Complete high school 144 (39.7) 75 (41.7) 69 (37.7)
Complete higher education 112 (30.9) 53 (29.4) 59 (32.2)
Sedentary time, min / day, mean (SD) 489.6 (99.5) 482.3 (104.1) 494.6 (92.7) 0.430
Perception of the environment score, mean (SD)
Land use mix 3.0 (0.5) 3.0 (0.5) 2.9 (0.6) 0.030
Residential density 233.6 (76.4) 232.8 (74.9) 234.2 (78.2) 0.032
Access to services 3.1 (0.4) 3.1 (0.4) 3.1 (0.5) 0.715
Street connectivity 3.2 (0.6) 3.2 (0.6) 3.2 (0.6) 0.352
Places for walking and cycling 2.6 (0.7) 2.6 (0.7) 2.6 (0.7) 0.957
Aesthetics 2.7 (0.7) 2.7 (0.7) 2.7 (0.7) 0.615
Perception of safety 2.6 (0.5) 2.6 (0.5) 2.5 (0.6) 0.112
Crime 2.7 (0.7) 2.8 (0.6) 2.5 (0.7) <0.001
Satisfaction with the neighborhood 0.6 (0.2) 0.6 (0.2) 0.6 (0.2) 0.002
Table 2. Linear regression on the contribution of the perceived environment in sedentary time measures, controlled for sociodemographic variables among boys. Curitiba, PR, Brazil. (Boys = 180).
Independent variables Model 1 Model 2 Model 3
B (SE) p-value B (SE) p-value B (SE) p-value
(constant) 339.813 (54.329) 0.001*
Age (years) 23.508 (4.305) <0.001* - - 20.268 (4.164) 0.001*
SES (ref=Low)
Intermediate 123.698 (32.601) 0.001* - - 90.465 (32.055) 0.005*
High 5.596 (15.662) 0.721 - - -
-Nutritional status (ref = low weight)
Adequate 11.748 (16.590) 0.480 - - -
-Overweight / Obesity 14.2654 (20.034) 0.465 - - -
-Parental schooling (ref=elementary school)
High school -17.686 (15.692) 0.261 - - -
-Higher education 62.069 (16.386) <0.001* - - 25.923 (11.340) 0.023*
Environment domains
Land use mix -6.323 (14.537) 0.664 -21.456 (13.429) 0.112 -
-Residential density -0.004 (0.104) 0.971 -0.043 (0.094) 0.645
Access to Services -50.337 (20.163) 0.013* -40.181 (18.535) 0.032* -32.5671 (18.531) 0.081 Street connectivity -20.327 (13.042) 0.121 -3.594 (12.291) 0.770
Places for walking and cycling -22.194 (10.474) 0.035* -27.727 (9.371) 0.004* -23.402 (9.585) 0.016*
Aesthetics -14.460 (11.098) 0.195 -17.619 (10.030) 0.081 -
-Perception of safety -13.720 (15.068) 0.364 -16.150 (13.613) 0.237 -
-Crime -9.967 (12.346) 0.938 -3.752 (11.268) 0.740 -
-Satisfaction with the neighborhood -15.977 (40.739) 0.695 -2.885 (32.448) 0.929 -
-Note. B = Beta value; SE = Standard error; SES = Socioeconomic status; * p <0.05; Model 1 = Bivariate analysis; Model 2 = Multivariate analysis adjusted for confounding variables with p <0.05 in model 1; Model 3 = Multivariate analysis with environment domains with p <0.05 in model 2 adjusted for confounding variables.
Table 3. Linear regression on the contribution of the perceived environment in sedentary time measures, controlled for sociodemographic
variables among girls. Curitiba, PR, Brazil. (Girls = 184).
Independent variables Model 1 Model 2 Model 3
B (SE) p-value B (SE) p-value B (SE) p-value
(constant) 339.813 (54.329) 0.001*
Age (years) 18.494 (3.867) <0.001* - - 20.648 (3.993) 0.001*
SES (ref=Low)
Intermediate -0.271 (23.581) 0.991 - - -
-High 23.7113 (13.941) 0.091 - - -
-Nutritional status (ref = low weight)
Adequate 3.720 (14.604) 0.799 - - -
-Overweight / Obesity 8.206 (16.823) 0.626 - - -
-Parental schooling (ref=elementary school)
High school 4.670 (14.466) 0.747 - - -
-Higher education 21.138 (14.928) 0.158 - - -
-Environment domains
Land use mix -5.219 (12.186) 0.669 -23.412 (11.931) 0.051* -20.574 (11.969) 0.087 Residential density -0.070 (0.089) 0.432 -0.087 (0.085) 0.303
Access to Services -8.134 (14.517) 0.576 -14.136 (13.748) 0.305 -
-Street connectivity -0.687 (11.637) 0.953 -1.129 (11.005) 0.918
Places for walking and cycling -16.870 (9.303) 0.071 -17.603 (8.776) 0.046* -15.572 (8.808) 0.079*
Aesthetics -11.693 (9.873) 0.238 -10.941 (9.333) 0.243 -
-Perception of safety -2.387 (12.234) 0.846 -4.174 (11.641) 0.720 -
-Crime -7.939 (9.704) 0.414 -8.036 (9.169) 0.382 -
-Satisfaction with the neighborhood -3.267 (33.358) 0.922 -5.699 (31.582) 0.857 -
DISCUSSION
The findings of this study demonstrate that there is a negative association between ST and places for walking and cycling between adolescents of both sexes from the city of Curitiba, Brazil. This study was the first to investigate the association between ST, measured by accelerometry and the perceived neighborhood environment in adolescents aged 12-17 years in Latin America. Studies such as this are fundamental to understand which aspects of the neighborhood environment in which adolescents live and are exposed to can be modified or used in interventions that attenuate or reverse the increase of ST in this population group.
The positive association between ST and age is reported in several studies conducted in different countries, showing that ST increases from childhood to adolescence17,18. In addition, those who remain in ST for
hours during adolescence are more likely to maintain this behavior in adult-hood1,19. A recent review (only with longitudinal studies) of changes in ST
from elementary to high school found, based on 19 independent samples, that both screen-based ST and overall ST increased during school transi-tion17. In general, there was an increase of approximately 10-20 minutes per
day per year in sedentary time, evaluated by accelerometry17. It is speculated
that increased responsibilities, search for good academic performance, entry into the labor market, and other priorities may contribute to this association. In addition, ST seems to be more accessible and easier than PA, tending to increase as the child spends more time alone at home, with access to television and computer in their own rooms20. Another finding of
the present study showed that belonging to the intermediate socioeconomic level, when compared to the low socioeconomic level, and the fact that the family head had higher education was associated with higher ST among boys. This association is consistent with other national studies21,22. Possibly,
higher schooling can help increase family income, thus facilitating access to sedentary leisure facilities and activities.
The perception of nearby places for walking and cycling, character-ized by the perception of the quantity and quality of sidewalks available in the neighborhood where adolescents reside was associated with ST for boys and girls. Considering that the positive attributes of the environment influence the type of transportation and commuting11,23,24, the presence of
these places and their proximity are believed to encourage active commuting (walking or cycling) among adolescents, which are represented in large part by mild intensity PA. This finding corroborates studies conducted in other countries that have reported that environmental domains are associated with PA25. Such findings reinforce the premise that ST can be minimized
since adolescents spend longer time performing light intensity PA that may reflect improvements in the physical environment (e.g., sidewalks), where adolescents reside26. Active commuting (walking and cycling) can
mortality when related to mild or moderate PA levels6,28, e.g., high levels
of moderate PA attenuate the increased risk of death associated with ST, although moderate PA does not eliminate the increased risk associated with excessive ST. In this way, the diversity of places for walking and cycling, positively perceived by adolescents, is important to reduce ST in adoles-cents from Curitiba-PR and contributes to lower mortality in the general population. However, it is critical to consider that the perception of the environment around the adolescent’s residence differs between sexes29, so
the interventions in order to reduce ST should be different for boys and girls. Based on these findings, it is important to consider variables of differ-ent levels (intrapersonal, interpersonal and environmdiffer-ental) in studies that attempt to understand a certain behavior, as recommended by the socio-ecological model30. The same difficulty found in Brazil in understanding
the aspects that can influence the ST of adolescents, is verified in developed countries. Studies that attempted to respond to the relationship between ST and perceived environment with similar aims as this study have found that adolescents residing in neighborhoods more favorable to PA practice spent less time on sedentary behaviors; however, these analyses, as well as the present study, were not adjusted for the PA level of adolescents7-9.
Some limitations need to be considered, since as it is a cross-sectional study, it is not possible to identify the causal relationship between variables, and it is only possible to verify associations between them. In addition, the sampling process was established to expand the contrasts of areas with different physical and social characteristics; however, the sample is not representative of the city’s adolescent population, so data cannot be extrapo-lated. However, no response bias was found, which allows considering that adolescents living in the sampled areas were well represented. Moreover, the sample size allowed detecting effects smaller than those found in the present study. The neighborhood walkability and income scores were not tested as confounding variables.
CONCLUSION
The results of this study demonstrate that the perception about the existence of places for walking and cycling has an inverse relationship with ST in adolescents from the city of Curitiba-PR, Brazil. Interventions to reduce ST among adolescents should take into account the environment around the adolescents’ homes, improving the quantity and quality of sidewalks, cycle paths, parks and areas that allow them to walk or cycle. However, exposure to favorable environments can help reduce ST in this phase, which strengthens the importance of these findings in policies and changes with a focus on improving the neighborhood and city environment.
considering psychosocial variables, quantity of items in the room and ST bouts in order to identify associations that best explain these behaviors among adolescents. Intervention or longitudinal studies would answer these questions with more consistent data.
COMPLIANCE WITH ETHICAL STANDARDS
Funding
This research did not receive any specific grant from funding agencies in the public, commercial, or not-for-profit sectors. This study was funded by the authors.
Conflict of interest statement
The authors have no conflict of interests to declare.
Ethical approval
Ethical approval was obtained from the local Human Research Ethics Committee - Pontifícia Universidade Católica do Paraná, 1356.945/201 and the protocol was written in accordance with the standards set by the Declaration of Helsinki.
Author Contributions
Conceived and designed the experiments: RSR, Performed the experi-ments: TTS, MSR, PBG. Analyzed the data: TTS, MSR, PBG. Con-tributed reagents/materials/analysis tools: RSR, TTS, PBG, MSR. Wrote the paper: TTS, PBG, MSR.
REFERENCES
1. Pate RR, Mitchell JA, Byun W, Dowda M. Sedentary behaviour in youth. Br J Sports Med 2011;45(11):906–13.
2. Council on Communications and Media. Media Use in School-Aged Children and Adolescents. Pediatrics 2016;138(5):e20162592–e20162592.
3. Brasil. Ministério da Saúde. Pesquisa de Orçamentos Familiares (POF) 2008-2009: Antropometria e estado nutricional de crianças, adolescentes e adultos no Brasil. Instituto Brasileiro de Geografia e Estatística. Rio de Janeiro; 2010.
4. Salmon J, Veitch J, Abbott G, ChinAPaw M, Brug JJ, TeVelde SJ, et al. Are associations between the perceived home and neighbourhood environment and children´s physical activity and sedentary behaviour moderated by urban/rural location? Health Place 2013;24:44–53.
5. Mamun AA, O’Callaghan MJ, Williams G, Najman JM. Television watching from adolescence to adulthood and its association with BMI, waist circumference, waist-to-hip ratio and obesity: a longitudinal study. Public Health Nutr 2013;16(1):54–64.
6. Tremblay MS, LeBlanc AG, Kho ME, Saunders TJ, Larouche R, Colley RC, et al. Systematic review of sedentary behaviour and health indicators in school-aged children and youth. Int J Behav Nutr Phys Act 2011;8(1):98.
8. Veitch J, Timperio A, Crawford D, Abbott G, Giles-Corti B, Salmon J. Is the neighbourhood environment associated with sedentary behaviour outside of school hours among children? Ann Behav Med 2011;41(3):333–41.
9. Martins MDO, Cavalcante VLR, Holanda GDS, Oliveira CG De, Maia FES, Meneses Júnior JR De, et al. Associação entre comportamento sedentário e fatores psicossociais e ambientais em adolescentes da região nordeste do Brasil. Rev Bras Ativi Fís Saúde 2012;17(2):143–50.
10. Alberico CO, Schipperijn J, Reis RS. Use of global positioning system for physical activity research in youth: ESPAÇOS Adolescentes, Brazil. Prev Med 2017;103S:S59-S65.
11. Reis RS, Hino AAF, Rech CR, Kerr J, Hallal PC. Walkability and physical activ-ity: Findings from curitiba, brazil. Am J Prev Med 2013;45(3):269–75.
12. Lima AL, Rech CR, Reis RS. Equivalência semântica, de itens e conceitual da versão brasileira do Neighborhood Environment Walkability Scale for Youth (NEWS-Y). Cad Saúde Pública 2013;29(12):2547–53.
13. Cain KL, Sallis JF, Conway TL, Van Dyck D, Calhoon L. Using accelerom-eters in youth physical activity studies: a review of methods. J Phys Act Health 2013;10(3):437–50.
14. Choi L, Liu Z, Matthews CE, Buchowski MS. Validation of accelerometer wear and nonwear time classification algorithm. Med Sci Sports Exerc 2011;43(2):357–64.
15. Conde WL, Monteiro CA. Valores críticos do índice de massa corporal para classificação do estado nutricional de crianças e adolescentes brasileiros. J Pediatr (Rio J) 2006;82(4):266–72.
16. ABEP. Associação Brasileira de Empresas de Pesquisa. Critério de classificação econômica Brasil. 2010;
17. Pearson N, Haycraft E, Johnston JP, Atkin AJ. Sedentary behaviour across the primary-secondary school transition: A systematic review. Prev Med 2017;94:40-7.
18. Mitchell JA, Pate RR, Dowda M, Mattocks C, Riddoch C, Ness AR, et al. A prospective study of sedentary behavior in a large cohort of youth. Med Sci Sport Exerc 2012;44(6):1081–7.
19. Carson V, Cliff DP, Janssen X, Okely AD. Longitudinal levels and bouts of sed-entary time among adolescent girls. BMC Pediatr 2013;13:173.
20. Gebremariam MK, Totland TH, Andersen LF, Bergh IH, Bjelland M, Grydeland M, et al. Stability and change in screen-based sedentary behaviours and associ-ated factors among Norwegian children in the transition between childhood and adolescence. BMC Public Health 2012;12(1):104.
21. Ferreira RW, Rombaldi AJ, Ricardo LIC, Hallal PC, Azevedo MR. Prevalence of sedentary behavior and its correlates among primary and secondary school students. Rev Paul Pediatr 2016;34(1):56–63.
22. Dias PJP, Domingos IP, Ferreira MG, Muraro AP, Sichieri R, Goncalves-Silva RMV. Prevalence and factors associated with sedentary behavior in adolescents. Rev Saude Publica 2014;48(2):266–74.
23. Reis RS, Hino AAF, Florindo AA, Anez CRR, Domingues MR. Association between physical activity in parks and perceived environment: a study with ado-lescents. J Phys Act Health 2009;6(4):503–9.
24. Sugiyama T, Cerin E, Owen N, Oyeyemi AL, Conway TL, Van Dyck D, et al. Perceived neighbourhood environmental attributes associated with adults’ recrea-tional walking: IPEN Adult study in 12 countries. Health Place 2014;28:22-30.
25. Ding D, Adams M a, Sallis JF, Norman GJ, Hovell MF, Chambers CD, et al. Perceived neighborhood environment and physical activity in 11 countries: do as-sociations differ by country? Int J Behav Nutr Phys Act 2013;10:57.
CORRESPONDING AUTHOR Tais Taiana Sarabia
Grupo de Pesquisa em Atividade Física e Qualidade de Vida (GPAQ) Rua Imaculada Conceição, 1155, Prado Velho, 80215-901. Curitiba, Paraná, Brasil.
E-mail: [email protected]
27. Van Dyck D, De Bourdeaudhuij I, Cardon G, Deforche B. Criterion distances and correlates of active transportation to school in Belgian older adolescents. Int J Behav Nutr Phys Act 2010;7:87.
28. Ekelund U, Steene-Johannessen J, Brown WJ, Fagerland MW, Owen N, Powell KE, et al. Does physical activity attenuate, or even eliminate, the detrimental association of sitting time with mortality? A harmonised meta-analysis of data from more than 1 million men and women. Lancet 2016;388(10051):1302–10.
29. Farias Júnior JC de, Reis RS, Hallal PC. Physical activity, psychosocial and perceived environmental factors in adolescents from Northeast Brazil. Cad Saude Publica 2014;30(5):941–51.