ABSTRACT: Diameter at breast height (DBH) is the simplest, most common and most important tree dimension in forest inventory and is closely correlatedwith wood volume, height and bio-mass. In this study, a number of linear and nonlinear models predicting diameter at breast height from stump diameter were developed and evaluated for Oriental beech (Fagus orientalis Lipsky) stands located in the forest region of Ayancık, in the northeast of Turkey. A set of 1,501 pairs of diameter at breast height-stump measurements, originating from 70 sample plots of even-aged Oriental beech stands, were used in this study. About 80 % of the otal data (1,160 trees in 55 sample plots) was used to fit a number of linear and nonlinear model parameters; the remain-ing 341 trees in 15 sample plots were randomly reserved for model validation and calibration response. The power model data set was found to produce the most satisfactory fits with the Ad-justed Coefficient of Determination, R2
adj (0.990), Root Mean Square Error, RMSE (1.25), Akaike’s Information Criterion, AIC (3820.5), Schwarz’s Bayesian Information Criterion, BIC (3837.2), and Absolute Bias (1.25). The nonlinear mixed-effect modeling approach for power model with R2
adj (0.993), AIC (3598), BIC (3610.1), Absolute Bias (0.73) and RMSE (1.04) provided much better fitting and precise predictions for DBH from stump diameter than the conventional nonlinear fixed effect model structures for this model. The calibration response including tree DBH and stump diameter measurements of the four largest trees in a calibrated sample plot in calibration produced the highest Bias, -5.31 %, and RMSE, -6.30 %, the greatest reduction percentage. Keywords:DBH, prediction, random parameters, calibration
Introduction
Diameter at breast height (DBH) is the simplest, most common and most important tree dimension in for-est inventory (Vanclay, 1994), since DBH is closely corre-latedto other dendrometric tree attributes, i. e. the wood volume, height and biomass. The diameter cannot be mea-sured at breast height in certain forest applications, such as illegal timber cut studies or unrecorded data from harvest-ed stands. In these forest applications, the stump diameter, which is measured at 0.3 m, remains an indicator of tree size (Randall et. al., 1984; Corral-Rivas et. al., 2007). DBH is initially predicted from the stump diameters directly measured on the logged trees, and then the tree volume and other tree attributes can be estimated from the DBH predicted (Bylin, 1982; Wharton, 1984; Parresol, 1998).
The relationship between the DBH and the stump diameter measured greatly depends on stand structures, where these stand conditions can be differentiated by site quality, stand density and stand ages. Accordingly, there is a nested structure (stand and plot), which can cause a lack of independence among diameter measurements with highly correlated data obtained from different sam-ple plots (West et. al., 1984; Gregoire, 1987).
In view of the disadvantages of the traditional mod-eling technique with the violation of assumptions in the regression estimation to fit the correlated hierarchical data structure (Searle et. al., 1992; Gregoire, 1987; Judge et. al., 1988), the linear and nonlinear mixed effect fitting technique have generally been accepted as the alternative
modeling approach to justify these serial correlation prob-lems among trees (Lappi and Bailey, 1988; Gregoire and Schabenberger, 1996; Hall and Clutter, 2004; Temesgen et. al., 2008). However, there are few studies that include the use of the linear and nonlinear mixed effect fitting procedure to fit the relationships between DBH and the stump diameter.
Despite the importance of predicting DBH in for-estry applications, mixed effect modeling for the rela-tionship between DBH and stump diameter in forestal ecosystems has been poorly understood. Thus, the ob-jective of the authors in the present study is to (i) de-velop a number of linear and nonlinear mixed effect models for predicting DBH from stump diameter for Oriental beech (Fagus orientalis Lipsky) stands located in the forest region of Ayancık, northeastern of Turkey, and (ii) evaluate a number of calibration strategies including different numbers of subsample trees for specifying the sampling unit-specific effect incorporated into the DBH predictions.
Materials and Methods
Data Description
This study was performed on Oriental beech stands located in the Göldag planning unit, Sinop, in the ˘
northeast of Turkey (647000-650000 E. 4629000-4632000 N. UTM ED 50 datum Zone 36 N). The altitudes of the study area ranged from 500 m to 970 m, with an average of 775 m. The study area was characterized geomorpho-Çankırı Karatekin University/Forest Faculty, Bademlik Avenue
–18200 – Çankırı – Turkey.
*Corresponding author <[email protected]>
Edited by: Thomas Kumke
Mixed effect models for predicting breast height diameter from stump diameter of
Ilker Ercanli*, Alkan Gunlu, Emin Zeki Başkent
Received June 29, 2014 Accepted November 20, 2014
logically as being steep terrain land with moderate and steep slopes ranging from 10 % to 60 %, with an average of 26 %.
In the stands studied, 70 sample plots were ran-domly selected so as to guarantee that various stand con-ditions including variability in site quality, age and stand density were found in the Oriental beech stands. The Oriental beech stands sampled were naturally regener-ated and uniformly stocked stands (60-90 % tree layer cover), without any evidence of historical damage such as fire or storm. In the Oriental beech stands studied, the Regional Forest Directory used moderate thinning regime and patch cutting procedures to guarantee the stand presence of the Oriental beech trees.
The size of circular plots ranged from 0.04 to 0.08 ha, which were dependent on the stand crown closure in order to achieve a minimum of 30-40 trees in sample plots. In each sample plot, the diameter at breast height (DBH) and stump diameter at 0.3 m stump height were measured to within a precision limit of 0.1 cm with cal-ipers for every living tree with a DBH greater than 4 cm. Thus, in total 1501 DBH/stump diameter pairs were used to develop the statistical models. Of special impor-tance was the random splitting into two data sets as fol-lows: the model fitting data and the validation data set. About 80 % of total data (1,160 trees in 55 sample plots) was used to develop DBH-stump diameter models. The remaining 341 trees in 15 sample plots (20 % of total data) were randomly reserved to evaluate calibration re-sponses of the nonlinear mixed effect model which was selected as the best predictive model. The mean, stan-dard deviations, minimum, maximum for model fitting and validation data set are presented in Table 1.
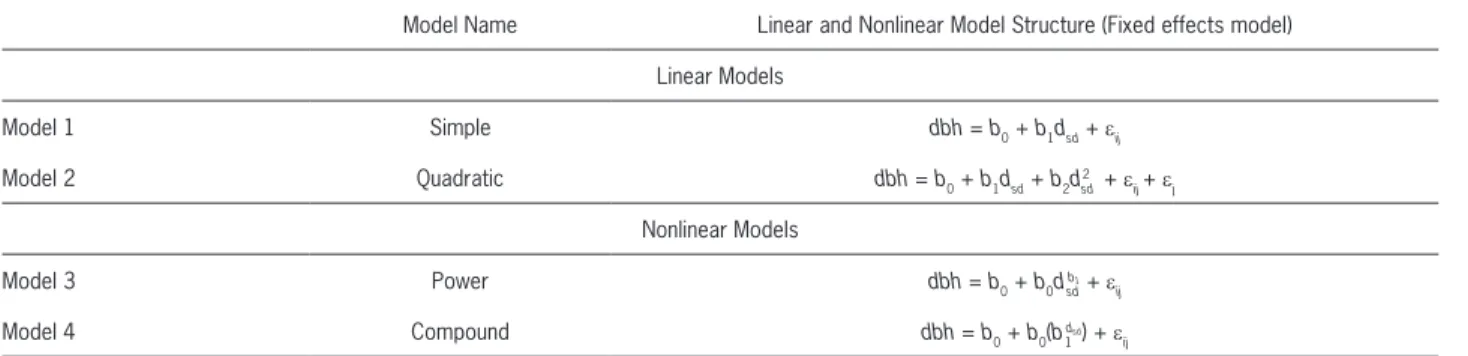
Analyzed Models
In this study, the allometric models used to de-velop statistical models for predicting DBH from stump diameter were both linear (simple, M1, and quadratic, M2, model) and nonlinear models (power, M3 and
com-pound, M4, model). Model structures analyzed in this study are shown in Table 2.
The linear regression models, M1-M2, were fitted by ordinary least squares using PROC REG procedure and the nonlinear models, M3-M4, were fitted by the non-linear regression analysis with the Marquadt algo-rithm using the PROC NLIN procedure of the SAS/ETS V9 software (SAS Institute Inc, 2004).
Model Selection and Evaluation
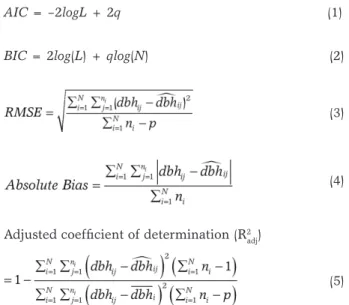
The linear and nonlinear models predicting DBH from stump diameter were evaluated as to their accuracy and precision by using the following five statistical criteria: Akaike’s Information Criterion (AIC), Schwarz’s Bayesian Information Criterion (BIC), the Root Mean Square Error (RMSE), the Absolute Bias, and the Adjusted Coefficient of Determination (R2
adj) using the following equations:
AIC = –2logL + 2q (1)
BIC = 2log(L) + qlog(N) (2)
(3)
(4)
Adjusted coefficient of determination (R2 adj)
(5)
where: L is the maximum value of the log likelihood function, q is the number of variance components, N
Table 1 − Summary statistics for sample trees and sample plots originated from fitting, validation and all data.
Variables Min. Mean Max. Std. Deviation
Diameter at Breast Height
Fitting 4.50 19.44 68.00 11.96
Validation 5.70 23.27 61.40 13.27
All 4.50 20.31 68.00 12.37
Stump Diameter
Fitting 5.10 22.33 77.00 13.45
Validation 6.40 26.59 68.80 15.13
All 5.10 23.29 77.00 13.96
Site Index
Fitting 11.8 24.5 32.8 5.2
Validation 10.9 20.6 33.7 4.8
All 10.9 22.6 33.7 4.9
Fitting 32 65 124 15.8
Stand Age Validation 28 58 114 12.8
All 28 65 112 14.9
Fitting 0.25 0.44 1.15 0.10
Density Index Validation 0.20 0.50 1.22 0.12
is the number of sample plots, ni is the number of trees in the ith plot, dbhij and d are the jth observed and estimated DBH in ith sample plot, respectively, and is the mean DBH in the ith sample plot. Smaller values of AIC, BIC, RMSE and the Absolute Bias indicate bet-ter model fit results. Higher values of R2
adj (the adjusted
coefficient of determination) with 1.0 as the ideal value give the predictable proportion of the variance of the dependent variable, tree diameter at breast height, and from the independent variable, a stump diameter.
The linear and nonlinear mixed effect modeling The linear and nonlinear fixed effect models struc-tures (Table 2) are based on the assumption that εij is distributed with variance σ2 as ε ~ N(0 , σ2 ) In ordinary least squares and nonlinear least squares regression techniques, it is assumed that the parameters, b0,b1 and b2, are fixed and stable across sampling units (i.e. site, stand and plots) within all populations. These models, including only fixed effects, provide the predictions of DBH for the mean population, which is common to all populations. However, the relationship between the DBH and the stump diameter varies from one stand to the next, since the stand conditions and structures are plot-specific, i. e. in terms of stand density, site and soil attributes, with significant variability.
The hierarchical sample structure resulted in the highly correlated observations for DBH and stump di-ameter data, which were measured in the same sampled plots. To fix this problem, the prediction systems based on the mixed effect modeling procedure including simul-taneously both fixed and random parameters in model structure, were used to fit the DBH – stump diameter model selected as the best predictive model.
In this study, the predictions for variance com-ponents and fixed parameters of the model selected as best predictive were obtained by PROC NLMIXED and PROC MIXED procedures of the SAS/ETS V9 software (SAS Institute Inc, 2004). In nonlinear mixed effect re-gression, SAS PROC NLMIXED uses the maximum likelihood estimation (ML) procedure. The adaptive Gaussian quadrature was used to solve numerically the integral over the random effects in SAS NLMIXED
pro-cedure, of which the detailed information was explained by Pinheiro and Bates (2000).
Calibration Response Evaluation
To calibrate the nonlinear mixed DBH models for specific sample plots, random parameters, ui and vi, for this plot were predicted by the best linear unbiased pre-dictors, BLUPs (Vonesh and Chinchilli, 1997);
(6)
where: represents the estimated random parameters for the localized plot, is the 2x2 variance-covariance matrix for the among-plot variability (common for all plots), is the estimated kxk variance-covariance ma-trix for the within-plot variability, is the kxq matrix of partial derivatives of the function with respect to ran-dom parameters , êij is the residual value, which was calculated as the difference between the observed DBH value and the one predicted by using the DBH model including merely the fixed parameters in subsamples (Gregoire, 1987; Yang et. al., 2009). In particular, the comprehensive formula and explanations for the BLUP equation can be obtained from the studies of Calama and Montero (2004) and Castedo Dorado et. al. (2006).
When the calibration procedure for the mixed ef-fect modeling approach was applied to predictions, the calibration responses of the DBH model were evaluated by using a number of sampling scenarios, which were based on subsample tree selections from the validation data set, 341 trees for Oriental beech in 15 sample plots - about 20% of the total data.
The estimation of random parameters, , was ar-rived at by using different sampling scenarios to obtain the DBH predictions. These sampling alternatives for calibration responses included the selection of previous trees based on certain stand size categories, i. e. largest, smallest and medium trees in the sample plots (Calama and Montero, 2004; Yang et. al., 2009). The sampling scenarios evaluated were as follows:
1) DBH and stump diameter of 3-5 randomly selected trees in the plot.
Table 2 − Equation structure of linear and nonlinear models analyzed in this study.
Model Name Linear and Nonlinear Model Structure (Fixed effects model)
Linear Models
Model 1 Simple dbh = b0 + b1dsd+ εij
Model 2 Quadratic dbh = b0 + b1dsd+ b2d
2 sd + εij + εj
Nonlinear Models
Model 3 Power dbh = b0 + b0dsdb1 + ε
ij
Model 4 Compound dbh = b0 + b0(b1
dsd) + ε ij
and the best predictive results were arrived at by the non-linear mixed effect model structure when two random parameters, b0 and b1 were included. Thus, the general expression of the nonlinear mixed effect M3 including b0 and b1 as random parameters is the following:
dbhij= (b0 + ui)dsdij(b1+vi)+ ε
ij (7)
with ~N(0, D) eij~N[0, Ri] (8)
where: b0 and b1 are fixed parameters, common to each sample plots, and ui and vi are the random parameters, specific to sample plots.
The parameter estimates and variance component estimates using the goodness-of-fit statistics, R2
adj, AIC,
BIC, Absolute bias and RMSE, in the nonlinear mixed effect M3 model are presented in Table 5. The param-eters of estimates with variance components of this M3 nonlinear mixed effect model were significant at a prob-ability level of 0.05 (p < 0.05).
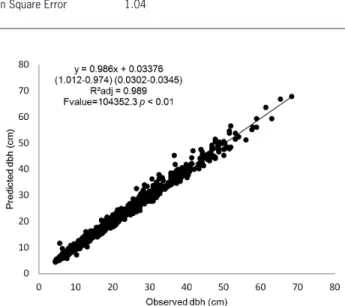
Figure 1 shows the plot of the standardized re-siduals versus the predicted DBH from the M3 nonlin-ear mixed effect model. The residuals of this M3 model indicate the random outlines of a residual around zero and no obvious significant trend. There is no serious breakdown of homoscedasticity that is the assumption of constant variance. Therefore, any weighting factor including alternative transformations for the DBH mod-el devmod-eloped is not required to remove the heterosce-dastic variance error; since the nonlinear mixed effect M3 model provided the assumption of homoscedastic-ity with homogeneous prediction variances. Similarly, the results of the F-test (Figure 2) with the confidence intervals for the model’s parameters showed that there was no reason to reject the null-hypothesis of intercept = 0 and slope = 1, which means that there were no systematic over nor underestimates in the DBH non-linear mixed effect M3 model (F value = 104352.3, p < 0.01). These desirable characteristic of the residual pattern underlined the statistical acceptability for these models as statistical regression models with no bias prediction results.
2) DBH and stump diameter of 3-5 largest trees in the plot.
3) DBH and stump diameter of 3-5 medium-size trees, considered as closest to the quadratic mean diameter at breast height in the plot.
4) DBH and stump diameter of 3-5 smallest trees in the plot.
As calibration responses, these sampling scenarios, including the selection of the previously subsampled trees, were evaluated by a number of statistical criteria and previ-ously defined statistics: ABSOLUTE BIAS and RMSE.
Results
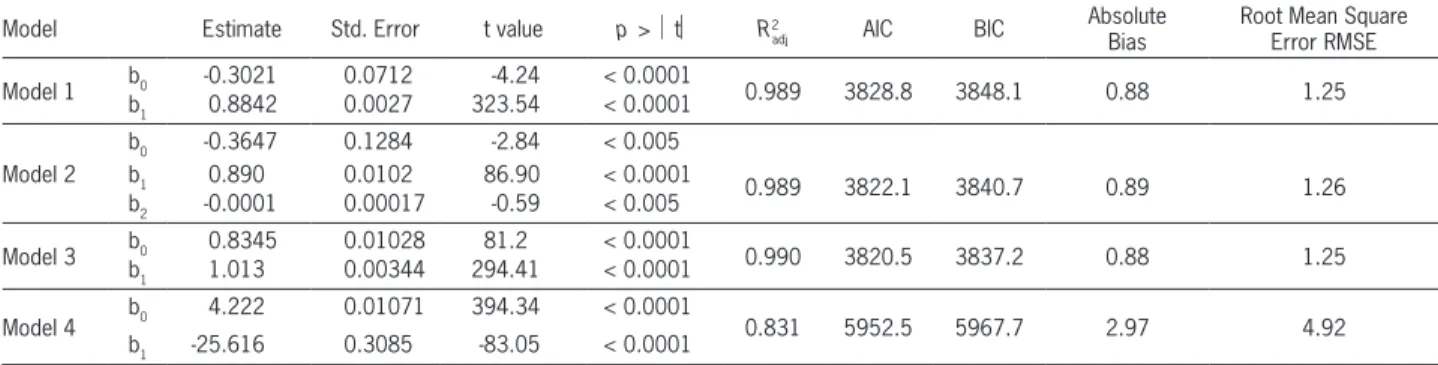
Model selection and nonlinear mixed effect modeling The parameter estimates with standard error, t-value and probability levels for the linear and nonlinear models that included only the fixed parameters in the model structure are presented in Table 3. All the param-eters of estimates for these models were significant (p < 0.05). Additionally, Table 3 shows the values of goodness-of-fit statistics, i. e. AIC, BIC, RMSE, Absolute Biasand R2
adj, for these linear and nonlinear models studied. These
goodness-of-fit statistics proposed that the M3 model, the power model, has better predictive ability in terms of R2
adj
(0.990), RMSE (1.25 cm), AIC (3820.5), BIC (3837.2), Ab-solute bias (1.25) than other models. Therefore, the base model for M3 was chosen as the best DBH-stump diam-eter relationship model and used for the nonlinear mixed effect modeling analysis that simultaneously included both fixed and random parameters in the model structure.
When the mixed effect modeling approach is adopt-ed, the important issue is to determine if the parameter is to be fixed or random in the model structure. In this eval-uation, the AIC and BIC statistics of the M3, including any random parameter alternatives, i.e. none whatsoever in this case, (all parameters being fixed-effect parameters), one (b0 or b1 random parameter) and two random param-eters (both b0 and b1 random parameters), are presented in Table 4. These alternatives result in, the greatest reduc-tions in AIC and BIC values, namely, 6.17 % and 5.92 %;
Table 3 − Parameter estimations with their standard errors and probability levels for linear and nonlinear models studied.
Model Estimate Std. Error t value p>t R2
adj AIC BIC
Absolute Bias
Root Mean Square ErrorRMSE
Model 1 b0 -0.3021 0.0712 -4.24 < 0.0001 0.989 3828.8 3848.1 0.88 1.25
b1 0.8842 0.0027 323.54 < 0.0001
Model 2
b0 -0.3647 0.1284 -2.84 < 0.005
0.989 3822.1 3840.7 0.89 1.26
b1 0.890 0.0102 86.90 < 0.0001 b2 -0.0001 0.00017 -0.59 < 0.005
Model 3 b0 0.8345 0.01028 81.2 < 0.0001 0.990 3820.5 3837.2 0.88 1.25
b1 1.013 0.00344 294.41 < 0.0001
Model 4 b0 4.222 0.01071 394.34 < 0.0001 0.831 5952.5 5967.7 2.97 4.92
Calibration Response Evaluation
Table 6 presents the absolute bias, RMSE and their % reduction values in these values as compared with predictions including only the fixed effect parameters of the M3 model for different sub-sample alternatives. The alternative based on the fixed-effect model structure without any random parameters resulted in the highest values of Absolute Bias and RMSE (0.95 and 1.30). How-ever, the best predictive results with the lowest Absolute Bias and RMSE, 0.89922 cm and 1.22123 cm respective-ly, with the highest reduction percentage, - 5.31 % and - 6.30 %, were achieved by the sampling alternative based on the selection of the four largest trees in the calibrated sample plot.
The second-best predictive performance with - 5.22 % and - 5.77 % reduction values for Absolute Bias and RMSE were obtained with the sampling alterna-tive based on the three largest subsampled trees in the plots. The sampling alternatives based on the selection of randomly selected sub-sample trees produced -1.29 % to -2.70 % reduction values in absolute bias and -2.72 % to -5.22 % reduction values in RMSE as moderately predictive results. The predictive ability of sampling al-ternatives based on the selection of the medium and the smallest subsample trees produced the worst predictive
Table 4−AIC and BIC values for M3 model structures including different random parameter alternatives for mixed modeling approach.
Random Parameters
Akaike’s Information Criterion (smaller is better)
Akaike’s Information Criterion AIC Reduction %
Schwarz’s Bayesian Information Criterion
(smaller is better)
Schwarz’s Bayesian Information Criterion
Reduction %
None (all parameters as fixed effects) 3820 - 3837.2
-u 3700 3.14 3742 2.48
v 3650 4.45 3688 3.89
u and v 3598 6.17 3610.1 5.92
Table 5−Fixed parameter and variance component prediction with their standard errors and probability levels for M3 nonlinear mixed effect model.
Estimate Std. Error t value p>t
Fixed parameters
b0 0.8485 0.01343 63.18 < 0.0001
b1 1.0089 0.00453 222.7 < 0.0001
variance components
0.00461 0.000134 34.51 < 0.0001
0.00051 0.0000057 89.20 < 0.0001
-0.00144 0.000017 -82.6 < 0.0001
1.1372 0.04921 23.11 < 0.0001
Goodness-of-fit statistics R2
adj 0.993 Absolute Bias 0.73
Akaike’s Information Criterion 3598.0 Root Mean Square Error 1.04 Schwarz’s Bayesian Information Criterion 3610.1
Figure 1 − Plot of studentized residuals against predicted values of diameter at breast height for Model 3.
Figure 2 − Predicted dbh values against observed dbh for Model 3 with the confidence intervals for parameter shown in parenthesis.
σ2
u
σv2
results, which ranged from – 0.34 % to – 0.82 % for Absolute Bias and from - 0.79 % to – 1.58 % for RMSE (Table 6).
Discussion
In this study, certain linear and nonlinear regres-sion models, M1-M4, were developed to predict Diameter at Breast Height from the stump diameter. Among these four models, the nonlinear power model that accounted for 99 % of the total variance in DBH-stump diameter re-lationships in the stands studied showed the best predic-tive ability based on the statistics fit. In addition, the non-linear mixed effect modeling procedure was used and the power model was fitted by including simultaneously both fixed and random effects on the DBH model structure.
The best predictive and fitting performance with the nonlinear mixed effect model structure of power model (M3) could be obtained by using the inclusion of random effects to account for the hierarchical and nested variance structure as distinct from other traditional regression fit-ting techniques. The nonlinear mixed effect model exhib-ited the homogeneous error variance for DBH predictions. It may be the inclusion of random parameters in models using the nonlinear mixed effect and data structure which could be obtained from the stands studied. However, West-fall (2010) stated the heteroscedastic errors for the DBH-stump diameter relations, used different model structure and data origin to relate DBH-stump diameter.
We used the nonlinear mixed effect modeling procedure with the adaptive Gaussian quadrature to es-timate parameters of nonlinear mixed models. Yang and Huang (2011) compared linearization through a first-order Taylor series expansion around random effects using the first-order (FO) approximation of Sheiner and Beal (1980) and the first-order conditional expectation (FOCE) approximation of Lindstrom and Bates (1990) to
estimate dominant height-age relationships. These pre-diction techniques, FO and FOCE, for the parameters of the model may be a better choice especially, since it may be that more advanced and complicated modeling tech-nique accounting for DBH variations may be required for effective and more predictive DBH estimations.
The calibration response based on the selection of the four largest trees in the sample plots resulted in less biased predictions, the highest reduction percentage for bias and RMSE, about 5-6 %. The second best predictive performance for calibration response was obtained from the sampling scheme with the largest three subsample trees in plots. When the nonlinear mixed M2 model was calibrated in un-sampled stands located in differ-ent forest areas, the use of DBH and stump diameter of subsampled trees selected from the largest three or four trees in plots differed from other sampling alternatives for selecting subsampling trees.
Some attributes that have a fixed effect on sample plots did not give much more additional information and could not achieve successful predictive performance re-sults in calibration response (Castedo-Dorado et al., 2006). In the present study, the DBH and stump diam-eter of medium-size and the smallest subsampled trees showed the fixed effect between plots in forest areas and species studied. Thus, the prediction results for these tree characteristics were found to be much worse than the ones achieved by other tree attributes, e.g. DBH and stump diameter of the largest sub-sample trees having a mixed effect on the DBH-stump modeling.
The similar calibration response results for the non-linear mixed effect models were obtained by a number of studies, e.g. Krumland and Wensel (1988), and Calama and Montero (2004). However other studies, e.g. Castedo-Dora-do et. al. (2006), Crecente-Campo et al. (2010) and Paulo et. al. (2011), found that the best predictive consequences for calibration response were acquired by selecting the
small-Table 6 − Comparisons of nonlinear mixed effect on M3 model’s predictive performance for different sub-sample size alternatives in calibration response.
The sampling Alternatives Absolute
Bias
% Abs. Bias Reduction
Root Mean Square Error
% Root Mean Square Error Reduction
Fixed Effect Model 0.94961 --- 1.30338
---Mixed Effect Model with no calibration 0.94327 -0.67 1.28594 -1.34
est trees in the sample plots. The calibration responses for any mixed-effect model depend on the model structures and the characteristics of species growing in different re-gional and under local forest conditions. Thus, some sam-pling scenarios with different subsample selections, e.g. the largest or the smallest tree, can present more additive in-formation for calibration than other sampling alternatives. The decisive issues and crucial evaluation process for mixed-effect models are to judge some sampling al-ternatives, including the different selections of subsam-ple trees, so as to obtain the best predictive performance with these models. In this evaluation of the mixed-effect model, the most important issue is to decide on was the number of trees, e.g. three or four trees or other tree quantities, that should be chosen for subsampling.
Conclusions
The model developed for the DBH and stump di-ameter relationships are limited to different applications for stump height, because stump diameters were mea-sured at a stump height of 0.3 m. The nonlinear mixed effect modeling procedure improved predictive results in DBH-stump diameter relationships as compared with fixed effect models. Also, the local calibration including the prediction of random parameters that used the sub-sampled tree measurements obtained from any sample plots, can be recommended for obtaining more effective and predictive results.
Acknowledgment
This work was supported by the Karadeniz Technical University Project Department, Project No: 2005.113.001.3.
References
Bylin, C.V. 1982. Estimating Dbh from Stump Diameter for 15 southern Species. USDA-Forest Service. Washington, DC, USA. (Research Note 50-286).
Calama, R.; Montero, G. 2004. Interregional nonlinear height-diameter model with random coefficients for stone pine in Spain. Canadian Journal of Forest Research 34: 150-163. Castedo-Dorado, F.; Diéguez-Aranda, U.; Barrio, M.; Sánchez, M.;
Gadow, K. von. 2006. A generalized height-diameter model including random components for radiata pine plantations in
northeastern Spain. Forest Ecology and Management 229: 202- 213.
Crecente-Campo, F.; Tomé, M.; Soares, P.; Diéguez-Aranda, U. 2010. A generalized nonlinear mixed-effects height-diameter
model for Eucalyptus globulus L. in northwestern Spain. Forest
Ecology and Management 259: 943-952.
Corral-Rivas, J.J.; Barrio-Anta, M.; Agirre-Calderón, A.A.; Diéguez-Arandam, U. 2007. Use of stump diameter to estimate diameter at breast height and tree volume for major pine
species in El Salto Durango (Mexico). Forestry80: 29-40.
Gregoire, T.G. 1987. Generalized error structure for forestry yield
models. Forest Science33: 423-444.
Gregoire, T.G.; Schabenberger, O. 1996. A non-linear mixed-effects model to predict cumulative bole volume of standing trees. Journal of Applied Statistics 23: 257-271.
Hall, D.B.; Clutter, M. 2004. Multivariate multilevel nonlinear mixed effects models for timber yield predictions. Biometrics 60: 16–24. Judge, G.G.; Hill, R.C.; Griffiths, W.E.; Lütkepoho, H.; Lee, T.C.
1988. Introduction to the Theory and Practice of Econometrics. John Wiley, New York, NY, USA.
Krumland, B.E.; Wensel, L.C. 1988. A generalized height-diameter
equation for coastal California species. Western Journal of
Applied Forestry 3: 113–115.
Lappi, J.; Bailey, R.L. 1988. A height prediction model with random stand and tree parameters: an alternative to traditional
site index methods. Forest Science34: 907–927.
Lindstrom, M.J.; Bates, D.M. 1990. Nonlinear mixed effects models for repeated measures data. Biometrics 46: 673–687. Parresol, B.R. 1998. Prediction and error of baldcypress stem
volume from stump diameter. Southern Journal of Applied Forestry 22: 69-73.
Paulo, J.A; Tomé, J.; Tomé, M. 2011. Nonlinear fixed and random generalized height-diameter models for Portuguese cork oak
stands. Annals of Forest Science 68: 295-309.
Pinheiro, J.C.; Bates, D.M. 2000. Mixed Effects Models in S and S-Plus. Springer, New York, NY, USA.
Randall, B.H.; Golitz, M.; Dale, M.E. 1984. Predicting board-foot tree volume from stump diameter for eight hardwood species in Ohio. Ohio Journal of Science 84: 259-263.
Searle, S.R.; Casella, G.; McCulloch, C.E. 1992. Variance components. John Wiley, New York, NY, USA.
Sheiner, L.; Beal, S.L. 1980. Evaluation of methods for estimating population pharmacokinetic parameters. I.
Michaelis-Mentem model: routine clinical pharmacokinetic data. Journal
of Pharmacokinetics and Biopharmaceutics8: 553-571.
Temesgen, H.; Monleon, V.J.; Hann, D.W. 2008. Analysis and comparison of nonlinear tree height prediction strategies for
Douglas-fir forests. Canadian Journal of Forest Research 38: 553–565.
Vanclay, J.K. 1994. Modeling Forest Growth: Applications to Mixed Tropical Forests. CAB International, Wallingford, UK. Vonesh, E.F.; Chinchilli, V.M. 1997. Linear and Nonlinear Models
of the Analysis of Repeated Measurements. Marcel Dekker, New York, NY, USA.
West, P.W.; Ratkowsky, D.A.; Davis, A.W. 1984. Problems of hypothesis testing of regressions with multiple measurements
from individual sampling units. Forest Ecology and Management
7: 207–224.
Westfall, J.A. 2010. New models for predicting diameter at breast
height from stump dimensions. Northern Journal of Applied
Forestry 27: 21-27.
Wharton, E.H. 1984. Predicting Diameter at Breast Height from
Stump Diameters for Northeastern Tree Species.USDA-Forest
Service, Washington, DC, USA. (Note NE-322).
Yang Y.; Huang, S. 2011. Comparison of different methods for fitting nonlinear mixed forest models and for making
predictions. Canadian Journal of Forest Research 34 :1671–1686
Yang, Y.; Huang, S.; Trincado, G.; Meng, S.X. 2009. Nonlinear mixed effects modeling of variable-exponent taper equations
for lodgepole pine in Alberta Canada. European Journal of Forest