The Effects of Asset Management and Profitability on
Stock Returns: A Comparative Study between
Conventional and Islamic Stock Markets in Indonesia
Shelly Midesia1, Hasan Basri2, M. Shabri Abd. Majid3
1,2,3Faculty of Economics and Business, Syiah Kuala University, Indonesia, Jl. T Nyak
Arief Darussalam, Banda Aceh, Indonesia
2E-mail: [email protected] (Corresponding author)
Abstract This study aims at empirically examining whether there are differences in stock returns between conventional and Islamic stock returns In Indonesia for the period 2010-2013. This study also attempts to explore the effect of asset management and profitability both stock returns in Indonesia. Annual pooled data gathered from the annual financial reports of 100 conventional and Islamic stock returns, which were published by the Indonesian Stock Exchange from 2010 to 2013 were used and analyzed by using the independent t-test and panel multivariate regression analysis. The result shows that there was no difference in stock returns between the conventional and Islamic stock markets. Additionally, the study documents that only profitability, which is measured by market ratio, was found to have an influence on the conventional stock markets. Meanwhile, as for Islamic stock market, only management of assets was found to have a significant effect on the stock return. These findings imply that investors who are investing in both Islamic and conventional markets would gain similar returns. However, in predicting and stabilizing the stock markets, both investors and policy makers should focus on the profitability for the conventional and management of assets for the Islamic stock market.
Key words Asset management, profitability, stock return, Islamic Stock Market
JEL Codes: D53
1. Introduction
Investment in stock market has become a trend among all groups of people within the society, not only among those who understand investment in stock markets, but also among the layman who do not have knowledge on capital markets. Many people are still hesitating in their selection of investment instruments. Their doubt is not only resulted from the level of risk and returns trade-off issue, but it is also from
the issues of Shari’ah compliancy of investment, including issues of permissibility
(halal) and haram (prohibition) concerns (Jurnalis, 1999; Metwally, 1997; Karim et
al., 2010). As dominated by Muslim investors in Indonesia, these concerns have
provide a halal investment instruments and as part of market expansion efforts, the Indonesian Stock Exchange in collaboration with Danareksa Investment Management have launched the Islamic capital market, in which the issued stocks
are based on the Islamic principles, including the prohibition of riba (usury),
prohibition of transacting and investing in haram products, and emphasis on the
moral values in its operation, etc. In Indonesia, all Islamic stocks are listed in the
group of Indonesian Shari’ah Stock Index (ISSI). Every six-month the Shari’ah
Supervisory Council of Majelis Ulama of Indonesia regularly evaluates the Shari’ah
compliancy of the stock and if the operation of those listed stocks are no longer in harmony with the Islamic principles, then they will be excluded from the ISSI list. Investors who purchase conventional and Islamic stocks have the same expectation to gain highest returns. However, there are differences in the activities and operation of each market. Investors are allowed to speculate in the conventional stock market. For the stock issuers, the investment may be dominated by loan from financial institutions. Rules imposed by the conventional stock market are not based on the Islamic principles. In conventional market, the sustainability of issuers and returns for all parties are the main purpose. On the other hand, although it is oriented to provide higher capital gains and dividend for the stockholders, Islamic
stock market should be free from riba (interest), gharar (uncertainties) and maysir
(gambling) elements, including the source of fund and production process should be
in line with the tenets of Islam (Khan, 2005; Rahman et al., 2010).
Apart from its permissibility, Muslim investors also seek to gain diversification benefits by investing in Islamic stocks. Thus, predicting price changes of the stock is
highly important. Stock prices keep changes due firms’ characteristics and
macroeconomic factors. Stock prices reflect the performance and operation of the
stock’s issuers. High (low) stock price indicates good (bad) performance of the
companies, and it relates to the potential returns the investors might earn. In investing their money in stocks, investors made it based on their rational considerations using a range of necessary information affecting the fluctuation of stock prices. These wide ranges of useful information would be used as their prediction instruments on their investment returns in the stock market either based on the technical and fundamental analyses. Since this study is concerned with stock
returns predictability based on the firms’ characteristics, thus fundamental analysis is adopted to empirically examine the effects of firms’ activity, profitability, and market ratios on their stock returns.
activity ratio have insignificant effect on stock returns. This finding contradicted to earlier study by Nuryana (2013), who documented that the total assets of LQ45
group companies had affected significantly the companies’ stock returns. In their
studies, Herlambang and Rachmad (2003), Hermi and Ary (2011), Farkhan and Ika (2012) and Yuliantari (2014) documented that the market ratio has positively and significantly affected stock returns. This finding implied that the fundamental analysis could help investors to predict the future stock returns. However, the
finding’s of Kristina and Untung (2012) was not in parallel to the above-reviewed studies, where the market ratio of earning per share did not have any influence on the stock returns. This finding further confirms that in predicting stock returns, the investors cannot simply rely on fundamental analysis, but it also should rely on the technical analysis as the movements of stock returns follow the random walk hypothesis.
Comparing to the previous empirical studies investigating the financial ratios of conventional stock market, similar studies on Islamic stock returns in the country have been scarce. Considering the fast growing of the Islamic stock market in Indonesia, it is interesting to know whether the Islamic stocks is better at managing their capital to generate sales and returns, thus providing the highest profits to their investors. Thus, this study is indeed timely to empirically compare the returns of conventional stocks with the Islamic counterparts. This study also attempts at comparatively investigating the effects of selected financial ratios, i.e., ratios of activity, profitability, and market on each conventional and Islamic stock market, respectively. Unlike previous studies that focused only on stocks in the selected sectors, this study explores the entire stocks listed in the composite stock price index. The findings of the study are hoped to shed some lights for the investors to gain diversification benefits by investing the money in the markets. The findings of the study would also contribute to the policy makers in designing proper policies to regulate and promote the markets.
2. Data and empirical framework
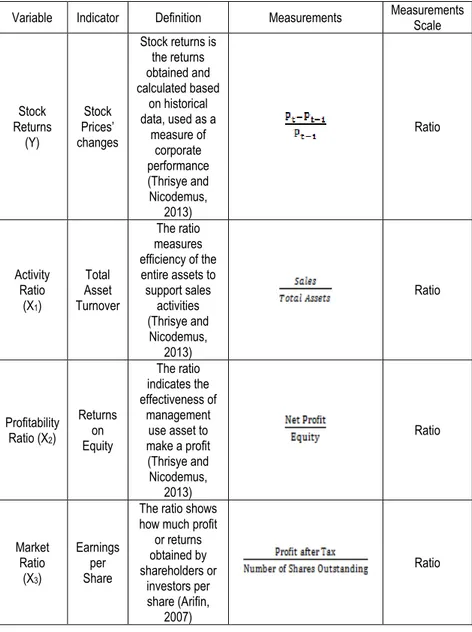
This study examines the effects of activity ratio, profitability ratio and market ratio on the both conventional and Islamic stock return in Indonesia. The unit of analysis in this study was 100 conventional stock and 100 Islamic stock companies. A balanced panel data from 2010 to 2013 were analyzed. Data was gathered from the
companies’ published financial reports and Bursa Efek Indonesia. (2010). Table 1
Table 1. Definition of Variables and their Measurements
Variable Indicator Definition Measurements Measurements
Scale Stock Returns (Y) Stock Prices’ changes
Stock returns is the returns obtained and calculated based
on historical data, used as a
measure of corporate performance (Thrisye and Nicodemus, 2013) Ratio Activity Ratio
(X1)
Total Asset Turnover
The ratio measures efficiency of the entire assets to support sales activities (Thrisye and Nicodemus, 2013) Ratio Profitability Ratio (X2)
Returns on Equity The ratio indicates the effectiveness of management use asset to make a profit (Thrisye and Nicodemus, 2013) Ratio Market Ratio
(X3)
Earnings per Share
The ratio shows how much profit
In this study, the data was then analyzed using two methods, heterogeneity test and panel data regression techniques which is a combination of time series data and cross section data of both conventional and Islamic stocks for the study period of 2010-2013. The first objective of the study, which is to compare between the returns of conventional and Islamic stocks, the independent sample t-test of mean deference, was utilized, analyzed using SPSS software. Meanwhile, the second objective of the study, which is to empirically examine the influences of the ratios of activity, profitability and market on both stock returns, the panel regression method, was adopted, analyzed using the Eviews software. In analyzing the panel data, three models of regression have been commonly used, namely (Juanda, 2012):
1. Common Effects Model
In this model, it is assumed that each individual unit (company) has a constant (intercept) and the same regression coefficient (slope) in different periods. In other words, the panel regression data generated would be applicable to each individual. Regression model is as follows:
yit= α + β'xit+ εit (1)
2. Fixed Effects Model
If the constant common models assumes that the constant (intercept) and regression coefficient (slope) are equal both over time and between individuals (companies), then the model is only constant (intercept) which is different for each individual. In this model, the constants in the regression can be distinguished among individuals because each individual is considered to have its own characteristics. Regression model is as follows:
yit= αi+ β'xit+ εit (2)
3. Random Effects Model
When the fixed effect model differences in the individual characteristics are accommodated in the intercept, the intercept changed between individuals, then the random effects model differences in the individual characteristics are accommodated in the error of the model. Regression model is as follows:
yit= α + β'xit + ui+ εit (3)
Where y is the dependent variable, α is a constant term, β is the regression
coefficients, i is an individual company, t is the time period, x is the independent
and cross section data. In order to select which model is the best to be adopted in analyzing the data in the study, three tests were performed, i.e., the Chow Test, Hausman Test and Lagrange Multiplier Test. The Chow Test is used to determine
whether to use common effect model or fixed effect model. While the decision to
use either fixed effect, model or random effect model is determined by the Hausman
Test. Finally, the decision to use either common effect model or random effect
model is determined by the Lagrange Multiplier Test.
3. Empirical findings and discussions
3.1.Finding from the Independent Sample t-Test
Before heterogeneity test (t-test) was performed, the homogeneity of variants was tested using F-test (Levene's Test). If the variances of the conventional and Islamic
stocks are the same, the t-test using Equal Variance is assumed, while if those
variances are different, then the t-test using Equal Variance is not assumed
(assuming different variants). The finding shows that the probability value (significance) with equal variance not assumed (assuming two different variants) is 0.008, which is lesser than 0.05, thus it can be concluded that the two different variances of conventional and Islamic stocks were different. Thus, the use of the t-test using equal variance was not assumed.
Table 2. Independent Sample t-Test for Stock Returns Levene’s Test for
Equality of Variances t-test for Equality of Means
F Sig. t df (2-tailed) Sig. Difference Mean Difference Std. Error
Equal variances
assumed 7.18 0.01 -1.51 738 0.13 -0.09 0.06
Equal variances
not assumed -1.51 567.68 0.13 -0.09 0.06
Table 2 shows that the results of t-test with equal variance variances assumedwas
at gaining the highest returns as possible in their investments, but they should also consider investing in the stocks, which are offered based on the Islamic principles.
3.2.Findings from Panel Data Regression
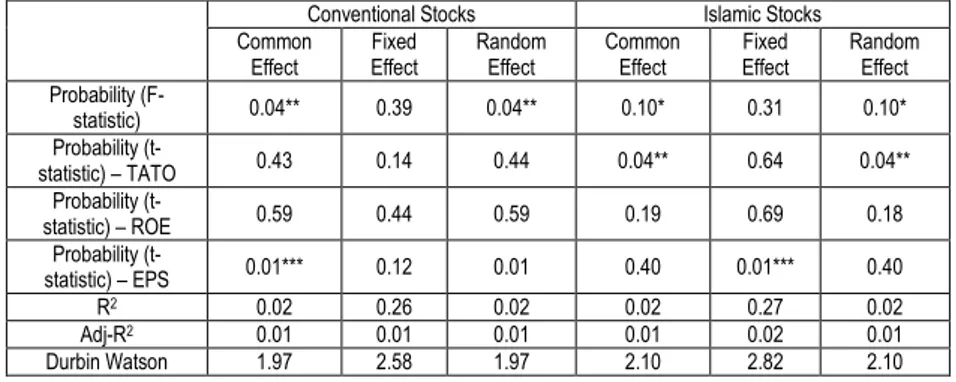
Table 3 provides the findings of the three panel data models, i.e., common effect, fixed effect, and random effects for both conventional and Islamic stock markets.
Table 3. Comparison Results of Panel Regression Models (Common Effect, Fixed Effect, and Random Effect)
Conventional Stocks Islamic Stocks
Common Effect
Fixed Effect
Random Effect
Common Effect
Fixed Effect
Random Effect Probability
(F-statistic) 0.04** 0.39 0.04** 0.10* 0.31 0.10*
Probability
(t-statistic) – TATO 0.43 0.14 0.44 0.04** 0.64 0.04**
Probability
(t-statistic) – ROE 0.59 0.44 0.59 0.19 0.69 0.18
Probability
(t-statistic) – EPS 0.01*** 0.12 0.01 0.40 0.01*** 0.40
R2 0.02 0.26 0.02 0.02 0.27 0.02
Adj-R2 0.01 0.01 0.01 0.01 0.02 0.01
Durbin Watson 1.97 2.58 1.97 2.10 2.82 2.10
Note: *, **, *** indicate the significance levels of 10%, 5%, and 1%, respectively.
To determine which model is properly to be adopted in this study, the Chow Test, Hausman Test, and Lagrange Multiplier Test were conducted, and the findings of these tests were reported in Table 4.3. Based on these tests, the random effect model was identified to be the most appropriate model to empirically examine the effect of activity ratios, profitability, and market on the stock returns of conventional and Islamic.
Table 4. Findings of the Chow Test, Hausman Test, and Lagrange Multiplier Test
Types of Test Probability Value
Conventional Stocks Islamic Stocks
Chow Test 0.157 0.079
Hausman Test 0.359 0.055
Lagrange Multiplier Test 0.001 0.019
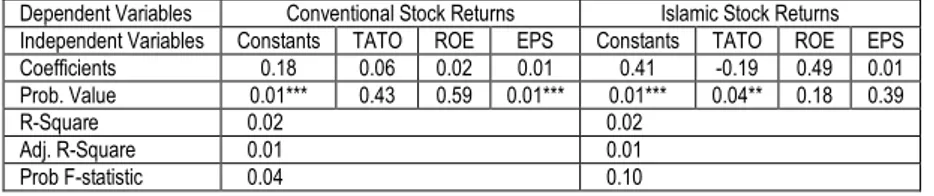
Having identified the random effect model to estimate the effects of ratios of activity, profitability, and market, thus Table 5 presents the findings of the model.
Table 5. Panel Regression Results Based on the Random Effect Model
Dependent Variables Conventional Stock Returns Islamic Stock Returns Independent Variables Constants TATO ROE EPS Constants TATO ROE EPS
Coefficients 0.18 0.06 0.02 0.01 0.41 -0.19 0.49 0.01
Prob. Value 0.01*** 0.43 0.59 0.01*** 0.01*** 0.04** 0.18 0.39
R-Square 0.02 0.02
Adj. R-Square 0.01 0.01
Prob F-statistic 0.04 0.10
Note: *, **, and *** indicate the significance levels of 10%, 5%, and 1%, respectively.
Referring to Table 5, the study documented that the activity ratio, profitability ratio and market ratio have simultaneous significant effects on the returns of both conventional and Islamic stock; showing by significance of F-statistics. R-adjusted of 0.02 for both stocks indicated that only 1 per cent variability in both conventional and Islamic stock returns could be explained by the investigated financial ratios. This indicates that the changes in returns of both stocks were explained 99 per cent
by many other variables, both companies’ specific characteristics and
macroeconomic determinants. In other words, it is not easy to predict the variability
of stocks’ movements. This further implies that to predict the stock returns
movements both technical analysis and fundamental analysis should be paralelly used. Furthermore, the study found that the probability values of the TATO for conventional and Islamic stock were 0.435 and 0.037, respectively. However, the activity ratio (TATO) was found to have no significant effect on the conventional stock returns, but it was found to be significant for Islamic stocks in an indirect manner in Indonesia. Specifically, the result showed that every 1% increases in TATO, resulted in a decrease of the Islamic stock returns by 19 per cent. The finding of conventional stocks supported the previous study by Thrisye and Nicodemus (2013).
4. Implications of the findings
Based on the Independent Sample t-Test, the study found that was insignificant difference between the conventional and Islamic stock returns in Indonesia. This implies that though the Islamic stocks operates on the basis of Islamic principles such as not allowing usury, speculation, gambling, trade in illicit goods and so on in their business activities, but the returns offered by the market is as much as the returns gained by investing in the conventional stocks. Although investing in the Islamic stocks provides similar returns as compared to the conventional stocks, but the Muslim investors should opt to invest in Islamic stocks. Islam does not prohibit the investors to gain as much as possible the returns, but their benefits should be
coming from the permissible investments activities, which are riba-, gharar- and
maysir-free.
The activity ratio which represented by the TATO has no significant effect on the conventional stock returns. Previous study conducted by Farkhan and Ika (2012) showed that the TATO has a negative effect on the stock returns. Since the activities of companies are sometimes low on a certain sales level, it might lead to the increase of the amount of surplus funds that are embedded in the non-productive assets. When the economy condition is bad, it subsequently lowers TATO and affects the stock returns. Unlike the companies offered the conventional stocks, the TATO affected the Islamic stock returns. Nuryana (2013) documented that the TATO has a significant effect on the Islamic stock returns. TATO is one of
measurement used to assess the efficiency of a company’s operation. A high value
of TATO indicates that the company management may use its entire assets to bring in sales (revenue) for the company and to provide benefits for the company. A high value of the TATO also indicates that the company is more efficient in utilizing its assets, particularly to generate greater sales; and subsequently brings a positive impact on the stock prices. Accordingly, investors would be attracted to continue investing in those companies.
Profitability ratio, which represented by the ROE was found to have no effect on both conventional and Islamic stock returns. In their study, Kristiana and Untung (2012) provided an indication that when the rate of investment returns received by investors was low, investors were not interested in buying those stocks. This would lead the stock market prices to decrease and it eventually influenced the stock returns. Therefore, to improve the ROE, the company must improve the capital utilization so that the profit would increase and the ROE would be higher.
EPS affected the stock returns as well as the investment decisions made by investors. However, in the case of Islamic stocks, the EPS did not affect the returns. Kristina and Untung (2012) documented that the EPS has no effect on the stock returns. This indicates that investors have been no longer assuming that the EPS
could be used as a predictor for the stock prices’ movements. 5. Conclusions
This study aims at empirically examining whether there are differences in stock returns between conventional and Islamic stock returns In Indonesia for the period 2010-2013. This study also attempts to explore the effect of asset management and profitability both stock returns in Indonesia. Annual pooled data gathered from the annual financial reports of 100 conventional and 100 Islamic stocks, which were published by the Indonesian Stock Exchange from 2010 to 2013 were used and analyzed by using the independent t-test and panel multivariate regression analysis. Using the independent sample t-test, the study documented that there was no difference in stock returns between the conventional and Islamic stock markets. Additionally, using the random effect model of multivariate panel regression, the study documented that only profitability, which is measured by market ratio, was found to have an influence on the conventional stock markets. Meanwhile, as for Islamic stock market, only management of assets was found to have a significant effect on the stock return. These findings imply that investors who are investing in both Islamic and conventional markets would gain similar returns. However, in predicting and stabilizing the stock markets in Indonesia, both investors and policy makers should focus on the profitability for the conventional and management of assets for the Islamic stock market.
References
Arifin (2007). Teori keuangan dan Pasar modal. Yogyakarta: Ekonisia.
Bursa E.I. (2010). Jakarta Islamic Index. Accessed from www.idx.co.id. [10 February
2015].
Farkhan and Ika (2012). Pengaruh Rasio Keuangan terhadap Return Saham
Perusahaan Manufaktur di Bursa Efek Indonesia. Value Added, 9(1), 1-18.
Herlambang and Rachmad, S. (2003). Pengaruh Earning Power, Return on Equity, Dividend Payout Ratio dan Tingkat Suku Bunga Deposito terhadap Return Saham
(Studi Kasus pada Perusahaan Otomotif di BEJ). Thesis, Master of Management.
Universitas Diponegoro, Semarang.
2008-2010. Jurnal Informasi, Perpajakan, Akuntansi, dan Keuangan Publik, 6(2), 83-95.
Juanda, B, and Junaidi (2012). Ekonometrika Deret Waktu: Teori dan Aplikasi.
Bogor: IPB Press.
Jurnalis (2009). Menyimak Portfolio Syariah. Accessed from www.economy.
okezone.com [19 March 2015].
Karim, B.A., NorAkila M.K. and Mohammad A.A. (2010). The Sub-prime Crisis and
Islamic Stock Markets Integration. International Journal of Islamic and Middle
Eastern Finance and Management, 3(4), 363-371.
Khan, M.Y. (2005). Stock Market in Islamic Framework. Paper presented at the 6th
Annual Conference of Islamic and Finance, Jeddah, KSA.
Kristiana, V.A., and Untung, S. (2012). Analisis Faktor-faktor yang Mempengaruhi Return Saham Investor pada Perusahaan Manufaktur di Bursa Efek Indonesia. Jurnal Ekonomi dan Kewirausahaan, 12(1), 1-11.
Metwally, M.M. (1997). Economic Consequences of Applying Islamic Principles in
Muslim Society, International Journal of Social Economics, 24(7/8/9): 941-957.
Nuryana, I. (2013). Pengaruh Rasio Keuangan terhadap Return Saham Perusahaan
LQ 45 di Bursa Efek Jakarta. Jurnal Akuntansi Aktual, 2(2), 57-66.
Rahman, A.A., Mohd A.Y., and Mohd H., Mohd N. (2010). Islamic Norms for Stock Screening. A Comparison between the Kuala Lumpur Stock Exchange Islamic Index
and the Dow Jones Islamic Market Index, International Journal of Islamic and Middle
Eastern Finance and Management, 3(3), 228-240.
Sufianti, Y. (2003). Analisa Kinerja Investasi Etis di Indonesia Periode 2001-2001 (Studi Kasus Perbandingan Kinerja Investasi Konvensional dengan Investasi
Syariah di Indonesia), Thesis, Master of Management, Universitas Indonesia.
Syafrida, I., Indianik A., and Bambang, W. (2014). Perbandingan Kinerja Instrumen Investasi Berbasis Syariah dengan Konvensional pada Pasar Modal di Indonesia. Al-Iqtishad, 6(2), 195-206.
Thrisye, R.Y., and Nicodemus, S. (2013). Analisis Pengaruh Rasio Keuangan
terhadap Return Saham BUMN Sektor Pertambangan Periode 2007-2010. Jurnal
Ilmiah Akuntansi & Bisnis, 8(2), 75-81.
Yuliantari, Ni N.A. and Ketut S.I. (2014). Pengaruh Financial Ratio, Firm Size, dan
Cash Flow Operating terhadap Return SharePerusahaan F&B. E-Jurnal Akuntansi