Cell cycle synchronization and BrdU
incorporation as a tool to study the
possible selective elimination of
ErbB1
gene in the micronuclei in A549 cells
C. Lauand*, E.L. Niero*, V.M. Dias* and G.M. Machado-Santelli
Departamento de Biologia Celular e do Desenvolvimento, Instituto de Cieˆncias Biome´dicas, Universidade de Sa˜o Paulo, Sa˜o Paulo, SP, Brasil
Abstract
Lung cancer often exhibits molecular changes, such as the overexpression of theErbB1gene that encodes epidermal growth factor receptor (EGFR).ErbB1amplification and mutation are associated with tumor aggressiveness and low response to therapy. The aim of the present study was to design a schedule to synchronize the cell cycle of A549 cell line (a non-small cell lung cancer) and to analyze the possible association between the micronuclei (MNs) and the extrusion ofErbB1gene extra-copies. After double blocking, by the process of fetal bovine serum deprivation and vincristine treatment, MNs formation was monitored with 5-bromo-2-deoxyuridine (BrdU) incorporation, which is an S-phase marker. Statistical analyses allowed us to infer that MNs may arise both in mitosis as well as in interphase. The MNs were able to replicate their DNA and this process seemed to be non-synchronous with the main cell nuclei. The presence of ErbB1 gene in the MNs was evaluated by fluorescentin situhybridization (FISH).ErbB1sequences were detected in the MNs, but a relation between the MNs formation and extrusion of amplifiedErbB1could not be established. The present study sought to elucidate the meaning of MNs formation and its association with the elimination of oncogenes or other amplified sequences from the tumor cells.
Key words: A549 cells; Cell cycle synchronization; BrdU incorporation;ErbB1; Micronucleus
Introduction
Gene amplification in a tumor has been associated with poor prognosis and chemotherapy resistance. Cytogenetically, gene amplification can be observed in two different structures, namely, double-minute (DM) and homogeneously staining region (HSR). DM is a small extrachromosomal structure that is paired, acentric, and atelomeric and can be formed by fragments of chromo-somes, chromatin particles, and oncogenes. HSR is a region in any chromosome that fails to display the typical banding patterns after trypsin-Giemsa staining (1,2). Oncogene and multi-drug resistance genes are often overexpressed due to their amplification (3). ErbB1
(encoding epidermal growth factor receptor [EGFR] pro-tein) gene amplification, for example, has been found predominantly in cases of lung cancer, as well as in cases of gliomas, breast, and ovarian cancers. Some features like proliferation, survival, induction of angiogenesis, invasion,
metastasis, and activation of transcription factors in the tumor cells are because of the amplifiedErbB1(4).
Amplified genes in DM have been detected inside micronuclei (MNs). One example includes the selective elimination of c-mycthrough MNs by HL-60 (promyelo-cytic leukemia) and COLO 320 (colon carcinoma) cell lines that leads to the reduction in tumorigenicity (5). HL-60 cells can also be differentiated by eliminating c-myc
amplification through MNs (6). Moreover, the neuroblas-toma cell lines spontaneously eliminated amplified c-myc
gene by MNs formation, leading to a loss of the malignant phenotype (7). Another example is the relationship between the selective elimination of cyclin-dependent kinase 4 (CDK4) sequences and liposarcoma differentia-tion (8). Micronucleus (MN) formadifferentia-tion can be induced by drugs that cause DNA damage, and these treatments usually affect the biology of cancer cells (9,10).
Correspondence: E.L. Niero:,[email protected]..
*These authors contributed equally to this study.
MN frequency has been extensively used as a biomarker of genomic instability and chromosomal damage. This structure usually contains whole chromo-somes or chromatin fragments. MN assay has been used in studies of population biomonitoring (11,12), evaluation of the genotoxic potential of the compounds (13,14), studies of the cancer chemopreventive agents (15), and evaluation of the biological effects in aquatic organisms exposed to chemical pollution (16).
A549, a non-small lung carcinoma cell line, after the treatment with vincristine and aphidicolin showed an increased rate of nuclear abnormalities, including MNs formation (17). A549 cells contain 3.4 copies of ErbB1
gene that encodes EGFR, which is a 170-kDa protein with an extracellular domain, a transmembrane domain, and an intracellular tyrosine kinase domain (18-20). EGFR is frequently overexpressed in many cancer types, including lung cancer, and has been directly associated with cancer progression (21-23).
Studies regarding the loss of amplified oncogenes by MN expulsion can contribute to elucidate the possible functions of MN formation in cancer cells. Thus, this study aimed to standardize a protocol for cell cycle synchroni-zation to further analyze the possible association of MN formation with the extrusion ofErbB1gene extra-copies in A549 cells.
Material and Methods
Cell culture
A549 cell line was obtained from the American Type Culture Collection (ATCC) and was maintained in Dulbecco’s modified Eagle’s minimum essential medium (DMEM, Sigma, USA). It was supplemented with 10% fetal calf serum (FCS; Cultilab, Brazil). Then, this cell line was cultured in a 376C humidified incubator in an atmosphere of 5% CO2.
Mitotic index
The cells were seeded on coverslips in 35-mm dishes at 3x10⁴ cells/dish. At different times (according to the assays specified in the Results section), the cells were fixed with 3.7% formaldehyde for 30 min. Then, the cells were washed with phosphate-buffered saline (PBS) and permeabilized with 0.5% Triton X-100 for 10 min, washed again and treated with ribonuclease (RNAse; 10 mg/mL) for 30 min. They were incubated with 1% bovine albumin (Sigma, USA) for 1 h. Then, anti-phospho-histone H3 (Upstate, USA) was added and the cells were incubated in a humidified chamber for 3 h. The samples were also incubated with secondary antibody fluorescein isothiocya-nate (FITC)-conjugated for 1.5 h. Nuclei were counter-stained with propidium iodide (PI) and 1000 cells/slide were counted using a fluorescence microscope (Nikon, EDF-3, Japan). The images were obtained using a confocal laser-scanning microscope (LSM 510, Zeiss, Germany).
Nuclear aberrations and lamin-B labeling
Cells were seeded on coverslips in 35-mm dishes at 3x10⁴ cells/dish. After the double blockade by gradual FCS removal followed by vincristine treatment (detailed in the results), the cells were fixed with 3.7% formaldehyde for 30 min, washed again with PBS and permeabilized with 0.5% Triton X-100 for 10 min. RNAse (10 mg/mL) was added for 30 min. In order to observe the nuclear envelope, the samples were incubated with anti-lamin B antibody (Santa Cruz, USA) for 15 h in a humidified chamber. We added secondary antibody (FITC-conju-gated) for 1.5 h. Nuclei were counterstained with PI and 1000 cells/slide were counted using a fluorescence microscope (Nikon, EDF-3). The images were obtained using a confocal laser-scanning microscope (LSM 510, Zeiss).
5-bromo-2-deoxyuridine (BrdU) incorporation
After BrdU incorporation (depending on the protocols as shown in the Results section), at different times, the cells were fixed with cold methanol for 30 min, followed by 3.7% formaldehyde for 10 min. The different time dura-tions of BrdU incorporation during synchronization is detailed in the Results section. The cells were permea-bilized with 0.5% Triton X-100 for 10 min and washed with PBS. RNAse was added for 30 min. We then added anti-BrdU antibody++nuclease (GE Healthcare, UK) for 40 min. The samples were washed with PBS and secondary antibody FITC-conjugated was added for 1 h. Nuclei were counterstained with PI and 1000 cells/slide were counted using a fluorescence microscope (Nikon, EDF-3). The images were obtained using a confocal laser-scanning microscope (LSM 510, Zeiss).
Characterization of the cell cycle in A549 cells
The times of each phase of the cell cycle of A549 cells was determined after making some modifications in the protocol as proposed by Uzbekov et al (24). Briefly, Gap 2 (G2) was evaluated through the frequencies of mitotic cells labeled with anti-BrdU after 1 h of BrdU pulse. The frequencies were determined by fixing cells in intervals of 30 min for 7 h. The first labeled mitotic cells were observed after 3 h. The minimum length of G2 is considered to be the summation of this time plus the time of the BrdU pulse (G2min=4 h). The maximum length of G2 is considered to be the summation of the time when the frequency of mitotic cells labeled with anti-BrdU is maximum and the period of the BrdU pulse after excluding a half of the mitotic time (see below). We found that G2max=7 h. Thus, according to Uzbekov et al. (25): G2 = (G2min+G2max/2) –– (time of BrdU incorporation). G2 = (4++7/2) ––1 = 4.5 h.
after 27 h (x=0.888). This time duration was considered to calculate the length of the cell cycle (Lcc), where Lcc–– S=27. The length of S phase (S) was calculated from the initial frequency of positively labeled BrdU cells, where S=0.367.
Thus, according to Uzbekov et al. (24): S/Lcc=0.367/ 0.888=0.413. So, S=0.413 Lcc. Once Lcc––S=27, we found that: Lcc=46 h and S=19 h.
The time of the mitosis (M) was calculated using the mean of the mitotic index (2.45% as per the our results of mitotic index). According to Uzbekov et al. (25), M is denoted by the mean of the mitotic index multiplied by the time of the whole cell cycle. Thus: M=0.0245646=1 h
7 min.
Finally, the duration of Gap1 (G1) phase=Lcc––S––G2–– M. So, G1=21.3 h.
Fluorescentin situhybridization (FISH)
According to the manufacturer’s instructions, FISH protocol, with some modifications, was performed using the kit ZytoVision SPEC EGFR/CEN 7 Dual Color probe (Germany) (26). At the end of the protocol, the samples were washed in PBS for 1 min and incubated with TO-PRO-3 for 20 min. The images were obtained using a confocal laser-scanning microscope (LSM 510, Zeiss).
Statistical analysis
The statistical analyses were performed using the test of equality of two proportions. It enabled us to evaluate if the proportion of responses of two variables and/or their levels were statistically significant. In order to further complement the descriptive analysis of the quantitative values, we applied the confidence interval to the mean.
Results
Cell cycle synchronization
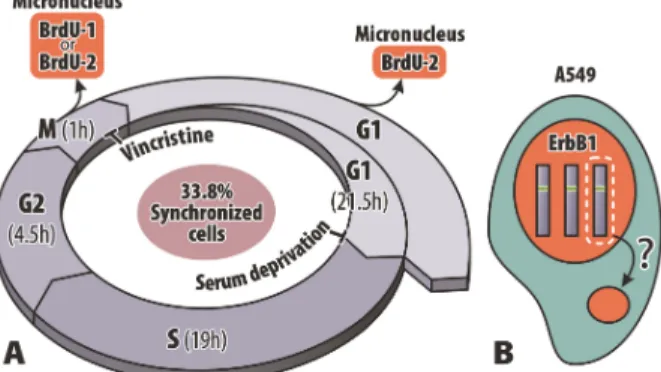
The A549 cell cycle was determined based on the labeled mitoses method using BrdU pulse, kinetics of BrdU incorporation, and mitotic indexes. Cell cycle phases were calculated according to Uzbekov et al. (24). The mean cell cycle lasted 46 h with G1 correspond-ing to 21.5 h, S phase to 19 h, G2 to 4.5 h, and mitosis to 1 h and 7 min, on average. Based on these data, a schedule was designed to attempt the synchronization of A549 cells (Figure 1).
The FCS was gradually removed every 24 h until it reached 0% in the culture medium. We anticipated that after 50 h of FCS privation, the majority of the cells would be arrested in G0/G1 phase. The medium was then supplemented with 10% FCS for 44 h so that the cells could progress in cell cycle. Vincristine (0.1mg/mL) was added to the medium for 6 h to block the serum-deprived synchronized cells in subsequent mitosis (Table 1). The time of vincristine treatment was determined based on the length of A549 cell cycle.
Other concentrations of the drug were tested (0.05 and 0.5mg/mL; Table 1). However, the concentration of 0.1mg/mL was chosen, because of the higher frequency of c-mitosis until T6, and the absence of c-mitosis in T18, T24, and T48, denoting the progression in cell cycle after drug removal. Vincristine at 0.5mg/mL also induced high frequency of nuclear abnormalities. We considered c-mitosis as c-mitosis blocked by vincristine. Morphological characteristics of c-mitosis are disorganized spindles and the condensed chromosomes are unorganized in the equatorial plate (Figure 2).
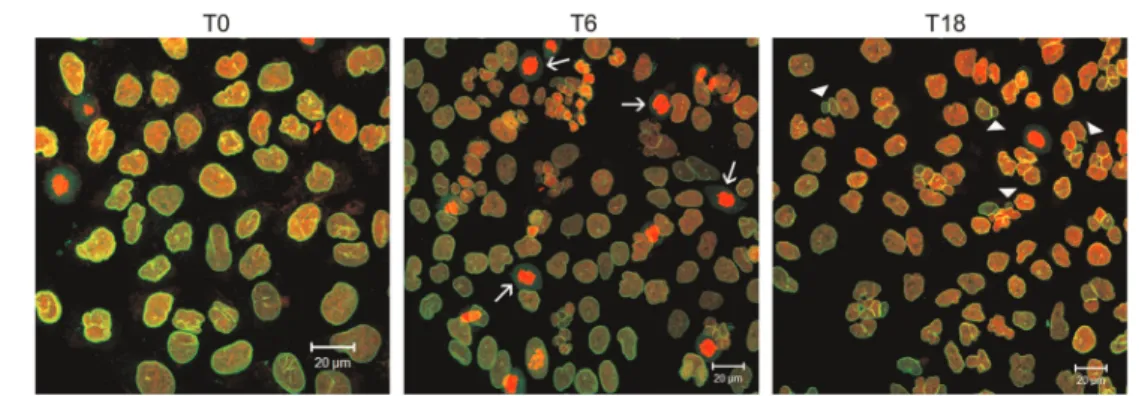
Micronucleated, binucleated, and multinucleated cells were counted at different recovery times, together with mitosis and c-mitosis (mitosis blocked by vincristine) (Table 1). The cells arrested in M phase after the treatment with vincristine were considered to be synchro-nized. We found 33.8% of c-mitosis in T6 compared to 18% in T0. The percentage achieved in T6 indicated the frequencies of synchronized cells. Figure 2 illustrates the persistence of vincristine activity on the microtubules of A549 cells 6 h after its removal from the culture medium. We observed multinucleated and binucleated cells in all groups and there was a gradual increase in frequen-cies of nuclear aberrations over the recovery times. The frequency of the micronucleated cells was higher in T18 (7.4%) compared to the non-synchronized cells (basal frequency of micronucleated A549 cells = 1.48%) and to the other recovery times (5.8% in T24 and 6.2% in T48). Examples of such alterations are shown in Figure 3. The labeling of the nuclear lamina led to confirmation of the micronuclei integrity.
Origin of micronuclei
As described above, we found MNs after recovery of vincristine treatment and, then, we tried to determine the origin of these MNs (mitotic or interphasic) by making use of the pulses of BrdU incorporation as a tool. Figure 4A shows the examples of cells with nuclei and micronuclei that incorporated BrdU (BrdU++). Two schedules of BrdU incorporation have been designed: BrdU-1, wherein the pulse of BrdU occurred when the synchronized cells were in the S phase; and BrdU-2, wherein the pulse of BrdU occurred 1 hour before withdrawal of vincristine (Figure 4B). The cells were fixed after 0, 6 and 18 h of recovery. We analyzed frequencies of interphase nuclei, c-mitoses, and MNs. The results are reported in Table 2.
and 43% of them were found to be positive to BrdU incorporation in T0. T6 and T18 showed 23% and 36% of positive MNs, respectively. These BrdU-labeled MNs in T18 were originated probably during mitosis. The MNs without BrdU labeling were originated from cells that were not in the S phase at the BrdU pulse and these cells were considered to be non-synchronized.
In the next set of experiments considering BrdU-2, it was anticipated that the synchronized cells would be arrested in mitosis, but we found such cells that incorporated BrdU and, therefore, these cells were non-synchronized. As expected, c-mitosis in T0 did not show BrdU labeling. The analysis of the cell population showed an increased frequency of BrdU++ MNs. T0, T6 and T18 showed 25%, 34% and 47% of BrdU labeling into MNs, respectively. The BrdU++ MNs observed in T0 and T6 couldn’t be induced by vincristine and they probably originated in interphase. Again, T18 also had enrichment
of interphasic MNs, although some of them were probably formed in mitosis. The results can be viewed in Table 2.
These experiments showed that MNs could originate in mitosis as well as in interphase. Then, we chose T18 for the later experiments because of the higher frequency of MNs achieved at this recovery time.
Characterization of micronuclei content
ErbB1 gene amplification in lung cancer cells is a very common observation. We evaluated if selective oncogene elimination was possible in the MNs shown in theErbB1gene. We also analyzed the cells submitted to synchronization protocol (T18 group) and compared them with the cells cultured in normal medium, supplemented with 10% FCS (control group).
Figure 5 shows cells with examples of MNs positive or negative toErbB1labeling (that is ErbB1++ and ErbB1––, respectively). We observed 21.11% and 14.44% of MNs Figure 1.Cell synchronization protocol by double blockade in the A549 cell line. The schedule shows the period of fetal calf serum (FCS) deprivation and vincristine exposure. It also shows the different times of recovery (T) after vincristine removal (6, 18, 24 and 48 h).
Table 1. Effects of double blockade (FCS deprivation ++ 0.05, 0.1 or 0.5mg/mL vincristine) on A549 cells.
Nuclear aberrations T0 T6 T18 T24 T48
0.05mg/mL vincristine
c-mitoses 21.1 10.1 0.4 0.2 0.1
Total mitoses 23.1 12.5 1.3 3.4 2.3
Micronucleated cells 0.9 1.0 8.1 4.4 4.7
Binucleated cells 1.2 1.1 7.3 5.8 5.9
Multinucleated cells 0.2 2.5 11.6 10.8 6.2
0.1mg/mL vincristine
c-mitoses 18.0 33.8 0.0 0.0 0.0
Total mitoses 19.7 35.0 1.2 1.1 1.8
Micronucleated cells 0.7 0.7 7.4 5.8 6.2
Binucleated cells 2.1 2.1 5.8 9.2 10.3
Multinucleated cells 0.2 2.7 13.2 16.1 14.6
0.5mg/mL vincristine
c-mitoses 14.4 31.5 1.0 1.8 0.4
Total mitoses 15.0 32.2 2.1 3.1 1.2
Micronucleated cells 0.6 0.3 10.8 15.4 23.7
Binucleated cells 1.4 1.2 7.0 6.8 8.0
Multinucleated cells 0.1 0.1 24.9 39.0 45.0
ErbB1++ in control cells and in the T18 group, respectively. But these differences were not statistically significant. The quantification of ErbB1++ MNs in control cells and in the T18 group indicated that there was no selective elimination of theErbB1gene in MNs of synchronized cells.
Discussion
BrdU incorporation for 1 h resulted in 36.75% of A549 cells BrdU++ and they represented the S phase frequency in the cell population. Chang et al. (27) studied the A549 cell cycle by cytometry and reported that the percentage of cells in the S phase was 32.1 after 1 day and 38.9% after 2 days in culture. They also showed that 54% of the cells were in G1 phase, indicating the longer duration of
this phase in A549 cells.
The drugs that block the cell cycle at specific points have been used to obtain synchronized cells. However, the methods should be standardized for each cell type taking into consideration the duration time of cycle phase and the cell behavior after treatment. Many drugs were used to cause cell cycle arrest: a) thymidine, aphidicolin, mimosine, hydroxyurea, and 5-fluorodeoxyuridine were used to cause cell cycle arrest in the S phase; b) N-acetyl-leucyl-leucyl-norleucinal (ALLN), nocodazole, colchicine and colcemide in mitosis; and c) lovastatin and Hoechst 768159 in G1 phase (methods reviewed by Uzbekov, (28)).
many drugs. One such example is the expression of genes responsible for the multidrug resistance (MDR) phenotype. Our group could not find efficient conditions of colchicine treatment to induce cell cycle arrest in A549 cell line (data not shown). Instead, vincristine was the alternative used to block the cell cycle in mitosis.
As observed at T6, with an increase in the frequency of c-mitosis, even after the removal of vincristine, it still continued to act in the cells. After 18 h of recovery, all the cells progressed in the cell cycle because there was no
evidence of c-mitosis. Keeping in mind that A549 cells could show mechanisms of drug resistance against vincristine and other drugs, which is common in cancer cell lines, 33.8% of synchronized cells could be consid-ered relevant for this study (29). This possible mechanism of drug resistance in A549 cells is supported by the negative results obtained with colchicine treatment. This rate of synchronized cells was supported by statistical analysis.
The data of synchronized cells allowed us to infer that Figure 3.Effects of double blockade in A549 cells. Nuclear morphology observed in A549 cells at different times of recovery after vincristine exposure: c-mitoses with condensed chromatin are observed immediately after vincristine removal (T0); in high frequency in T6 (arrows); the highest frequency of micronuclei observed in T18 (arrowheads). The lamin B labeling (green) allowed the evaluation of nuclear envelope integrity in both main nucleus and micronucleus. DNA was stained with propidium iodide (red). Images are projections of different slices obtained by laser scanning confocal microscopy. T: times of recovery after vincristine removal (0, 6, and 18 h).
many A549 cells evaded the mitotic checkpoint. In this case, despite the microtubules disassembly, the cells progressed in the mitosis, increasing the frequencies of micronucleated, binucleated, and multinucleated cells (30). The A549 mitotic checkpoint is considered to be functional. Weitzel and Vandre´ (31) and Masuda et al. (32) showed that the treatment of A549 cells with drugs that interfere with the spindle dynamic were responsible for causing the cell cycle arrest in mitosis.
The results showed that the synchronization was efficient in causing enrichment of micronucleated cell population in the cultures. This enrichment could be considered to be a useful tool in studying the expulsion of amplified genes by micronuclei formation. Nevertheless, micronuclei induced by vincristine shown in our results were not spontaneous micronuclei and thus it was not possible to determine if they originated during interphase or mitosis.
Micronuclei observed in T0 and T6 could not be generated in synchronized cells because these cells were supposed to be arrested in c-mitosis. As shown in Table 1, the cells that incorporated BrdU in the S phase probably evaded the cell synchronization according to the presented schedules.
BrdU incorporation allowed us to elucidate the origin of MNs observed in T18, in mitotic and interphasic cells. We observed cells with MN BrdU–– and nuclei BrdU++. The MNs were able to replicate their DNA content and this process seemed to be non-synchronic with the main cell nuclei. Okamoto et al. (33) also showed similar results and it was observed that the timing of replication in the MN and the nucleus sometimes were non-synchronic, depending on the MN content.
Some authors have proposed different mechanisms for MN formation (8,34-36). Many previous works have already demonstrated that there are amplified genes of extrachromosomal regions in the MNs of tumor cells. One example is the geneMYC, which was observed in DM, in the hydroxyurea-induced MNs in human colorectal carci-noma (37,38). Villa et al. (39) observedMYCin MNs of leukemia cells and Valent et al. (40) showed that this Figure 5.Fluorescentin situhybridization ofErbB1gene in A549
cells. A, Control cells (from non-synchronized cell culture) showing usually 3 copies of ErbB1 gene in each nucleus. B, Cells submitted to synchronization protocol after 18 h recovery. Note a micronuclei positive to ErbB1labeling (red arrow) and micronuclei negative to ErbB1 labeling (white arrow). Multinucleated cells showed a deviation of the usual number of copies of ErbB1. TheErbB1gene was labeled in green. Nuclei were counterstained with TO-PRO-3 (blue). Images were obtained by laser scanning confocal microscopy.
Table 2. BrdU incorporated by A549 cells 22 h after FCS deprivation (BrdU-1) and 1 h before vincristine removal (BrdU-2) to study the origin of MNs.
BrdU-1 BrdU-2
T0 T6 T18 T0 T6 T18
Nuclei BrdU++a 40.1 42.1 47.3 36.3 56.2 69.4
c-mitoses BrdU––a 3.3 11.59 1.6 11.8 18.19 0.2
c-mitoses BrdU++a 6.7 21.11 1.3 0 2.1 0.8
MNs BrdU––b 57 77 64 75 66 53
MNs BrdU++b 43 23 36 25 34 47
aResults are reported as percent of 1000 cells counted. bResults are reported as percent of 100
gene, as DM, was found in spontaneous MNs of neuroblastomain vivo. He´lias-Rodzewicz et al. (8) also associated the elimination of amplifiedCDK4sequences with differentiation in liposarcoma.
The frequency of micronuclei positive to BrdU in T18 (36%) showed the importance of this time of recovery in our analysis. This recovery time also showed the highest frequency of micronucleated cells (7.4%). ErbB1 was found to be amplified in many lung cancer cells, especially in A549 cells (about 3 copies/nucleus) (18,26). Thus, we investigated the relation betweenErbB1amplification and its presence in the micronucleated A549 cells.
We compared the frequency of MNs ErbB1++ in the control and T18 groups. Statistical analysis did not show any differences between these groups; thus, we con-cluded that there was no preferential extrusion ofErbB1
gene by synchronized cells. Shimizu et al. (38) further demonstrated that DM can originate aggregates that get delayed during the chromatid separation in anaphase, eventually leading to MN formation. ErbB1 was not found in the extrachromosomal regions of the A549 cell line in our culture conditions. This result could help explain the low frequency of MNs ErbB1++.
Figure 6 summarizes the results and shows the schedule of synchronization and the possibilities of MN formation in mitosis or interphase obtained by BrdU-1 and BrdU-2 assays in the T18 group. Due to the enrichment of MNs in the T18 group, this time was chosen for evaluat-ing the possible extrusion of extra copies of ErbB1. Nevertheless, our data suggested that there was no selective elimination of this gene in this system.
This research is an important piece of the puzzle that seeks to elucidate the meaning of MN formation and its association with the elimination of oncogenes or other amplified sequences from tumor cells. The synchronization
protocol was efficient to cause the enrichment of the MN population in A549 cells and it could be useful in studying MN formation in this cell line.
Acknowledgments
We would like to thank M.A. Roberto Cabado Modia for providing technical assistance with the confocal microscopy and for the help with the final art of Figure 6. We thank FAPESP (2011/19040-7), CNPq (471522/ 2010-4) and CAPES (PNPD 02486/09-1) for the financial support extended for this study.
References
1. Kuttler F, Mai S. Formation of non-random extrachromoso-mal elements during development, differentiation and oncogenesis. Semin Cancer Biol 2007; 17: 56-64, doi: 10.1016/j.semcancer.2006.10.007.
2. Reddy KS. Double minutes (dmin) and homogeneously staining regions (hsr) in myeloid disorders: a new case suggesting that dmin form hsrin vivo.Cytogenet Genome Res2007; 119: 53-59, doi: 10.1159/000109619.
3. Shimizu N. Extrachromosomal double minutes and chro-mosomal homogeneously staining regions as probes for chromosome research.Cytogenet Genome Res2009; 124: 312-326, doi: 10.1159/000218135.
4. Capdevila J, Elez E, Macarulla T, Ramos FJ, Ruiz-Echarri M, Tabernero J. Anti-epidermal growth factor receptor monoclonal antibodies in cancer treatment. Cancer Treat Rev2009; 35: 354-363, doi: 10.1016/j.ctrv.2009.02.001. 5. Von Hoff DD, McGill JR, Forseth BJ, Davidson KK, Bradley
TP, Van Devanter DR, et al. Elimination of extrachromoso-mally amplified MYC genes from human tumor cells reduces
their tumorigenicity.Proc Natl Acad Sci U S A1992; 89: 8165-8169, doi: 10.1073/pnas.89.17.8165.
6. Shimizu N, Nakamura H, Kadota T, Kitajima K, Oda T, Hirano T, et al. Loss of amplified c-myc genes in the spontaneously differentiated HL-60 cells.Cancer Res1994; 54: 3561-3567.
7. Ambros IM, Rumpler S, Luegmayr A, Hattinger CM, Strehl S, Kovar H, et al. Neuroblastoma cells can actively eliminate supernumerary MYCN gene copies by micronucleus forma-tion –– sign of tumour cell revertance?Eur J Cancer1997; 33: 2043-2049, doi: 10.1016/S0959-8049(97)00204-9. 8. He´lias-Rodzewicz Z, Pedeutour F, Coindre JM, Terrier P,
Aurias A. Selective elimination of amplified CDK4 sequences correlates with spontaneous adipocytic differ-entiation in liposarcoma. Genes Chromosomes Cancer
2009; 48: 943-952, doi: 10.1002/gcc.20696.
9. Narath R, Ambros IM, Kowalska A, Bozsaky E, Boukamp P, Ambros PF. Induction of senescence in MYCN amplified neuroblastoma cell lines by hydroxyurea. Genes
Chromosomes Cancer 2007; 46: 130-142, doi: 10.1002/ gcc.20393.
10. Yu L, Zhao Y, Quan C, Ji W, Zhu J, Huang Y, et al. Gemcitabine eliminates double minute chromosomes from human ovarian cancer cells. PLoS One2013; 8: e71988, doi: 10.1371/journal.pone.0071988.
11. Machado-Santelli GM, Cerqueira EM, Oliveira CT, Pereira CA. Biomonitoring of nurses handling antineoplastic drugs.
Mutat Res 1994; 322: 203-208, doi: 10.1016/0165-1218(94)90007-8.
12. Bolognesi C, Landini E, Perrone E, Roggieri P. Cytogenetic biomonitoring of a floriculturist population in Italy: micro-nucleus analysis by fluorescence in situ hybridization (FISH) with an all-chromosome centromeric probe. Mutat Res
2004; 557: 109-117, doi: 10.1016/j.mrgentox.2003.09.013. 13. Saito A, Sugisawa A, Umegaki K, Sunagawa H. Protective
effects of quercetin and its metabolites on H2O2-induced
chromosomal damage to WIL2-NS cells.Biosci Biotechnol Biochem2004; 68: 271-276, doi: 10.1271/bbb.68.271. 14. Niero EL, Machado-Santelli GM. Cinnamic acid induces
apoptotic cell death and cytoskeleton disruption in human melanoma cells.J Exp Clin Cancer Res2013; 32: 31, doi: 10.1186/1756-9966-32-31.
15. Roy M, Chakrabarty S, Sinha D, Bhattacharya RK, Siddiqi M. Anticlastogenic, antigenotoxic and apoptotic activity of epigallocatechin gallate: a green tea polyphenol.Mutat Res
2003; 523-524: 33-41, doi: 10.1016/S0027-5107(02)00319-6.
16. Nigro M, Falleni A, Barga ID, Scarcelli V, Lucchesi P, Regoli F, et al. Cellular biomarkers for monitoring estuarine environments: transplanted versus native mussels. Aquat Toxicol 2006; 77: 339-347, doi: 10.1016/j.aquatox.2005. 12.013.
17. Manelli-Oliveira R, Machado-Santelli GM. Cytoskeletal and nuclear alterations in human lung tumor cells: a confocal microscope study.Histochem Cell Biol2001; 115: 403-411. 18. Amann J, Kalyankrishna S, Massion PP, Ohm JE, Girard L, Shigematsu H, et al. Aberrant epidermal growth factor receptor signaling and enhanced sensitivity to EGFR inhibitors in lung cancer.Cancer Res2005; 65: 226-235. 19. Wang Y, Minoshima S, Shimizu N. Precise mapping of the
EGF receptor gene on the human chromosome 7p12 using an improved fish technique.Jpn J Hum Genet 1993; 38: 399-406, doi: 10.1007/BF01907986.
20. Jorissen RN, Walker F, Pouliot N, Garrett TP, Ward CW, Burgess AW. Epidermal growth factor receptor: mechan-isms of activation and signalling.Exp Cell Res2003; 284: 31-53, doi: 10.1016/S0014-4827(02)00098-8.
21. Eberhard DA, Giaccone G, Johnson BE. Biomarkers of response to epidermal growth factor receptor inhibitors in Non-Small-Cell Lung Cancer Working Group: standardiza-tion for use in the clinical trial setting.J Clin Oncol2008; 26: 983-994, doi: 10.1200/JCO.2007.12.9858.
22. Herbst RS, Shin DM. Monoclonal antibodies to target epidermal growth factor receptor-positive tumors: a new paradigm for cancer therapy.Cancer2002; 94: 1593-1611, doi: 10.1002/cncr.10372.
23. Brabender J, Danenberg KD, Metzger R, Schneider PM, Park J, Salonga D, et al. Epidermal growth factor receptor and HER2-neu mRNA expression in non-small cell lung cancer Is correlated with survival.Clin Cancer Res2001; 7:
1850-1855.
24. Uzbekov R, Chartrain I, Philippe M, Arlot-Bonnemains Y. Cell cycle analysis and synchronization of the Xenopus cell line XL2. Exp Cell Res 1998; 242: 60-68, doi: 10.1006/ excr.1998.4097.
25. Uzbekov R, Prigent C, Arlot-Bonnemains Y. Cell cycle analysis and synchronization of the Xenopus laevis XL2 cell line: study of the kinesin related protein XlEg5.Microsc Res Tech1999; 45: 31-42, doi: 10.1002/(SICI)1097-0029(199 90401)45:1,31::AID-JEMT3.3.0.CO;2-K.
26. Lauand C, Rezende-Teixeira P, Cortez BA, Niero EL, Machado-Santelli GM. Independent of ErbB1 gene copy number, EGF stimulates migration but is not associated with cell proliferation in non-small cell lung cancer.Cancer Cell Int2013; 13: 38, doi: 10.1186/1475-2867-13-38.
27. Chang GC, Hsu SL, Tsai JR, Liang FP, Lin SY, Sheu GT, et al. Molecular mechanisms of ZD1839-induced G1-cell cycle arrest and apoptosis in human lung adenocarcinoma A549 cells.Biochem Pharmacol2004; 68: 1453-1464, doi: 10.1016/j.bcp.2004.06.006.
28. Uzbekov RE. Analysis of the cell cycle and a method employing synchronized cells for study of protein expression at various stages of the cell cycle.Biochemistry2004; 69: 485-496.
29. Niero EL, Rocha-Sales B, Lauand C, Cortez BA, de Souza MM, Rezende-Teixeira P, et al. The multiple facets of drug resistance: one history, different approaches. J Exp Clin Cancer Res2014; 33: 37, doi: 10.1186/1756-9966-33-37. 30. Jordan MA, Wendell K, Gardiner S, Derry WB, Copp H,
Wilson L. Mitotic block induced in HeLa cells by low concentrations of paclitaxel (Taxol) results in abnormal mitotic exit and apoptotic cell death.Cancer Res1996; 56: 816-825.
31. Weitzel DH, Vandre´ DD. Differential spindle assembly checkpoint response in human lung adenocarcinoma cells.
Cell Tissue Res2000; 300: 57-65, doi: 10.1007/s004410 050047.
32. Masuda A, Maeno K, Nakagawa T, Saito H, Takahashi T. Association between mitotic spindle checkpoint impairment and susceptibility to the induction of apoptosis by anti-microtubule agents in human lung cancers.Am J Pathol
2003; 163: 1109-1116, doi: 10.1016/S0002-9440(10)63470-0.
33. Okamoto A, Utani K, Shimizu N. DNA replication occurs in all lamina positive micronuclei, but never in lamina negative micronuclei.Mutagenesis2012; 27: 323-327, doi: 10.1093/ mutage/ger082.
34. Wei Y, Multi S, Yang CR, Ma J, Zhang QH, Wang ZB, et al. Spindle assembly checkpoint regulates mitotic cell cycle progression during preimplantation embryo development.
PLoS One 2011; 6: e21557, doi: 10.1371/journal.pone. 0021557.
35. Rao X, Zhang Y, Yi Q, Hou H, Xu B, Chu L, et al. Multiple origins of spontaneously arising micronuclei in HeLa cells: direct evidence from long-term live cell imaging.Mutat Res
2008; 646: 41-49, doi: 10.1016/j.mrfmmm.2008.09.004. 36. Huang Y, Fenech M, Shi Q. Micronucleus formation
detected by live-cell imaging.Mutagenesis2011; 26: 133-138, doi: 10.1093/mutage/geq062.
extrusion of micronuclei.Mutat Res2000; 448: 81-90, doi: 10.1016/S0027-5107(00)00003-8.
38. Shimizu N, Misaka N, Utani K. Nonselective DNA damage induced by a replication inhibitor results in the selective elimination of extrachromosomal double minutes from human cancer cells. Genes Chromosomes Cancer 2007; 46: 865-874, doi: 10.1002/gcc.20473.
39. Villa O, Salido M, Perez-Vila ME, Ferrer A, Arenillas L, Pedro C, et al. Blast cells with nuclear extrusions in the form
of micronuclei are associated with MYC amplification in acute myeloid leukemia. Cancer Genet Cytogenet 2008; 185: 32-36, doi: 10.1016/j.cancergencyto.2008.04.014. 40. Valent A, Benard J, Clausse B, Barrois M, Valteau-Couanet