of Brazilian Isolates of
Cercospora kikuchii
Álvaro M. R. Almeida1, Fernanda F. Piuga5, Silvana R. R. Marin1, Eliseu Binneck1, Fábio Sartori2, Leila M. Costamilan3, Maria R. O. Teixeira4 & Marcelo Lopes6
1Embrapa Soja, Cx. Postal 231, CEP 86001-970, Londrina, PR, Brazil, e-mail: amra@cnpso.embrapa.br; 2Milenia Biotecnologia & Genética Ltda, Rua Pedro Antônio de Souza, 405, CEP 86031-610, Londrina,PR, Brazil, 3Embrapa
Trigo, Cx. Postal 451, CEP 99001-970, Passo Fundo, RS, Brazil, 4Embrapa Agropecuária Oeste, Cx. Postal 661, CEP 79804-970 Dourados, MS; 5UNOPAR, Av. Paris, 675, CEP 86041-140, Londrina, PR, Brazil; 6Departamento de
Ciências Agrárias, Universidade de Cruz Alta, UNICRUZ, CEP 98025-810, Cruz Alta, RS, Brazil
(Accepted for publication 05/10/2005)
Corresponding author: Álvaro M. R. Almeida
ALMEIDA, A.M.R., PIUGA, F.F., MARIN, S.R.R., BINNECK, E., SARTORI, F., COSTAMILAN, L.M., TEIXEIRA, M.R.O. & LOPES, M. Pathogenicity, molecular characterization, and cercosporin content of Brazilian isolates of Cercospora kikuchii. Fitopatologia Brasileira 30:594-602. 2005.
ABSTRACT
Cercospora kikuchii, involved with the defoliation of soybean (Glycine max) plants, is normally associated with Septoria glycines in late season. Seventy-two isolates from different regions in Brazil, obtained mainly from purple stained seeds, showed phenotypic variation. Cercosporin content and rate of colony growth was higly variable among isolates. A strong correlation between cercosporin content and virulence was identified. Genetic variation among and within populations was evaluated based on 86 RAPD loci. The RAPD analysis clustered all isolates into seven groups. No relationship was observed between RAPD groups and geographic origin or cercosporin content. The sequence of the internal spacer regions (ITS1-5.8S-ITS2) from 13 isolates chosen according to the previous RAPD and clustering analysis showed high similarity (97%-100%) to the GenBank sequences of C. kikuchii (AY266160, AY266161, AY152577 and AF291708). It is clear from this work that Brazilian isolates of C. kikuchii from different geographic regions, are variable in relation to virulence, RAPD profiles and cercosporin content. Cercosporin content could be a good parameter for choosing an adequate isolate for screening resistant or tolerant cultivars. Considering that this pathogen is easily seed-borne, findings are expected to show the same haplotypes in different regions. Migration could be favoured by infected seeds as demonstrated by RAPD analysis.
Additional keywords: genotypic diversity, PCR-RFLP, RAPD, ITS sequence, virulence.
RESUMO
Patogenicidade, caracterização molecular e teor de cercosporina de isolados brasileiros de Cercospora kikuchii
Cercospora kikuchii está envolvido na desfolha da soja (Glycine max), normalmente em associação com Septoria glycines, no final do ciclo da cultura. Setenta e dois isolados, obtidos principalmente de sementes com mancha púrpura e oriundas de diferentes regiões do Brasil, mostraram variabilidade fenotípica. O teor de cercosporina e a velocidade de crescimento de colônias foram bastante variáveis entre os isolados. Uma forte correlação foi identificada entre o teor de cercosporina e virulência. Diferenças genéticas, entre e dentro da população analisada, foram observadas por RAPD com a análise de 86 loci. As análises de RAPD permitiram agrupar os isolados em sete grupos. Nenhuma relação foi identificada entre os grupos de RAPD e a origem geográfica ou teor de cercosporina. A sequência da região espaçadora do DNA ribossomal (ITS1-5,8S-ITS2) foi determinada em 13 isolados escolhidos nos diferentes agrupamentos. A similaridade das sequências obtidas comparadas às sequências de C. kikuchii depositadas no GenBank (AY266160, AY266262, AY152577 e AF291708) variou de 97 a 100%. Este trabalho demonstrou que os isolados brasileiros de C. kikuchii de diferentes origens são variáveis quanto à virulência, aos padrões de RAPD e ao teor de cercosporina. O teor de cercosporina pode ser um bom parâmetro na escolha de um isolado adequado para seleção de cultivares tolerantes ou resistentes a esse patógeno. Considerando que ele é facilmente transmitido por sementes não é surpresa encontrar os mesmos haplotipos em diferentes regiões. A migração poderia ser favorecida por sementes infetadas como demonstrado na análise de RAPD.
Palavras-chave adicionais: diversidade genética, PCR-RFLP, RAPD, seqüência ITS, virulência.
INTRODUCTION
Cercospora leaf blight in soybean [Glycine max (L.)
Merril] is caused by Cercospora kikuchii (Matsumoto &
Tomoyasu) M.W. Garner. It was first described in Korea then
soybean plants caused by C. kikuchii and called the disease
Cercospora leaf blight. In the same report, he observed different reactions among soybean cultivars, reporting that cultivars such as Davis and Tracy were less affected than others. Currently C. kikuchii is associated with three symptoms on soybeans: purple seed stain, seedling death and leaf blight (Walters, 1978; Schuh, 1991).
The importance of this disease has increased in all countries where soybean is grown, especially in tropical areas (Wrather et al., 1997). In Brazil, C. kikuchii has been
associated with purple seed stain (Miyasaka, 1958) for a long time. A study published by Sediyama et al. (1971) did not
associate stained seeds with reduced germination; however, losses have been detected due to defoliation resulting from the development of large necrotic areas. This symptom is more prevalent in late season and is usually associated with brown spot, caused by Septoria glycines Hemmi (Almeida et al., 1997).
Although control of this disease may be achieved through genetic resistance, very little information is avaiable about the genetic variability of the pathogen. Ideally, newly bred soybean genotypes should be screened for Cercospora leaf blight prior to being released to the farmers, thus requiring that plant breeders understand the pathogen variability.
Evidence that variability occurs among isolates of C. kikuchii came from visual analysis of cultural and
morphological characteristics on potato-dextrose-agar (PDA). Colonies originating from different regions in Brazil showed considerable phenotypic variation. The color of the mycelium among isolates ranged from white to dark olive and black. Some isolates even showed dense mycelia with slow growth in contrast to others that exhibited faster development.
In this work, the variability among C. kikuchii isolates
from different areas in Brazil was analysed by RAPD, sequencing of the ITS regions of the rDNA, cercosporin content, virulence on soybean cultivars and cultural characteristics. A previous report has been published (Almeidaet al., 2004).
MATERIAL AND METHODS
Fungal cultures
Seventy-two isolates of C. kikuchii from different
regions of Brazil were obtained from either infected soybean seeds or leaves (Table 1). Purple stained seeds from different geographic areas were separated from soybean lots and surface sterilized in 1% sodium hypochloride for 1 min, followed by a sterile distilled H2O wash. Blotter testing was carried out according to Neergaard (1979) for two-four days at 25 ºC. A small piece of the tip of the mycelium was transferred to Petri dishes containing PDA plus 1% streptomycin sulphate and incubated at 25 ºC for ten days. From the border of each uniform colony a small piece of mycelium was transferred to a new PDA dish and incubated
as mentioned before. For DNA extraction, small plugs from the stock culture of each isolate were grown in 200 ml potato-dextrose broth at 26 ºC for two weeks under 18 h light.
Mycelial growth
One 8 mm diameter plug from each isolate was transferred to the center of Petri dishes with PDA, kept at 26 ºC with 18 h light. The colony diameter was measured after eight, 12 and 16 days. Three plates per isolate were used.
Cercosporin production assay
Cercosporin concentration was determined spectrophotometrically according to Jenns et al. (1989).
Isolates were grown on PDA and incubated at 25 ºC for six days under 18 h light. One mycelium plug (7 mm diameter) was cut from the border of the colonies, transferred to tubes containing 8 ml of 5 N KOH and kept in the dark for 4 h. Three tubes per isolate were used. After centrifugation at 10,000 rpm the samples were evaluated for cercosporin concentration in a spectrophotometer at A480 nm using a molar extinction coefficient of 23,300 (Jenns et al., 1989). The
average volume for one plug was 0.2 ml. The experiment was repeated twice.
Virulence analysis
Inoculation was performed according to Callahan et al. (1999) with modifications: 10 g of mycelium scraped from
a 14 day-old-colony was washed in sterilized water and homogenized in a blender with 100 ml of sterile 0.2% water agar for 40 sec. Mycelial suspension was sprayed onto both sides of leaves from 25 day-old plants using 4 Kgf/cm2 pressure. After inoculation the plants were covered with plastic bags for 48 h and kept at a greenhouse with temperature ranging from 28-33 ºC. The experiment was conducted in a completely randomized block design with 20 treatments consisting of five soybean cultivars (‘Davis’, ‘Conquista’, ‘Sambaíba’, ‘IAS-2’ and ‘Paraná)’ inoculated with four isolates (169, 179, 301 and 444). Each replication consisted of one pot with three plants per pot, and there were three replications per treatment. Plants were rated at two and three weeks after inoculation based on diagrammatic scale adapted from James (1971). The experiment was conducted twice. The same inoculum was used to inoculate pods of the same cultivars using a syringe with 25 x 7 needle.
DNA Extraction
Mycelia of each of the 72 isolates were washed and centrifuged at 3,000 x g for 10 min. The resulting pellets were washed in sterilized water, lightly squeezed in filter paper and stored at -80º C. DNA was extracted according to the method of Almeida et al. (2001b) and maintained at –80 ºC.
RAPD analysis
TABLE 1 - Soybean (Glycine max) isolates of Cercospora kikuchii obtained from purple stained seeds from different cultivars and origins in Brazil
*Isolated from infected leaves with typical symptoms of Cercospora leaf blight.
Isolate/Origin State Cultivar Isolate/Origin State Cultivar
1-Londrina PR Embrapa 25 3 7 -Anápolis GO Unknown
2-Londrina PR Embrapa 133 3 8-Anápolis GO Unknown
3-Londrina PR Embrap a 136 3 9-Anápolis GO Unknown
4- São Carlos do Ivaí PR BR-37 40-Bagé RS Unknown
5-São Carlos do Ivaí PR BR-37 41-Bagé RS Unknown
6-Terra -Boa PR Ft-Abyara 42-Bage RS Unknown
7-Terra -Boa PR BR-16 4 3-Passo -Fundo RS Unknown
8-Terra -Boa PR BR-16 4 4-Passo -Fundo RS Unknown
9-Santa Cecília do Pavão PR BR-37 4 5-Cruz-Alta RS Unknown 10-Santa Cecíclia do Pavão PR BR-37 4 6-Cruz-Alta RS Unknown 11 -Santa Cecília do Pavão PR BR-37 4 7-Cruz-Alta RS Unknown
12-NovaCantu PR Ft-Abyara 4 8-Ijuí RS Unknown
13-Nova Cantu PR Unknown 4 9-Ijuí RS Unknown
14-Nova Cantu PR BR-16 50-Londrina PR Clark
15-Peabiru PR BR-16 51-Londrina PR Clark
16-Rondonópolis MT Unknown 52-Londrina PR Clark
17-Rondonópolis MT Unknown 53-Londrina PR Cometa
18-Rondonópolis MT Unknown 54-Londrina PR Cometa
19-Chapadão do Céu MT Unknown 55-Londrina PR Cometa
20-Chapadão do Céu MT Unknown 56-Imperatiz MA
21-Chapadão do Céu MT Unknown 57-Imperatriz MA
22-Luiziana GO Unknown 58-Imperatriz MA
23-Luiziana GO Unknown 59-Imperat riz MA
24-Luiziana GO Unknown 60-Imperatriz MA
25-Mineiros GO Unknown 61-Imperatriz MA
26-Mineiros GO Unknown 62-Imperatriz MA
27-Mineiros GO Unknown 63-Imperatriz MA
28-Goiatuba GO Unknown 64-Imperatriz MA
29-Goiatuba GO Unknown 65-Francisco Beltrão PR FT-2000
30-Goiatuba GO Unknown 66-Francisco Beltrão PR FT-2000
31-Rio-Verde GO Unknown 67-Francisco Beltrão PR FT-2000
32-Rio-Verde GO Unknown 68-Laranjeira do Sul PR BR -16
33 -Rio-Verde GO Unknown 69-Barreiras BA Unknown*
34 -Senador Carneiro GO Unknown 70-Londrina PR Unknown*
35 -Senador Carneiro GO Unknown 71-Sta. Cruz -Bolivia Unknown 36 -Senador Carneiro GO Unknown 72-Sta. Cruz -Bolivia Unknown Tracajá Tracajá Tracajá Sambaíba
Sambaíba Sambaíba Seridó
Seridó Seridó
Reaction mixtures were prepared for a final volume of 25 µl of 10 mM Tris-HCl pH 8.3, 50 mM KCl, 2.5 mM MgCl2, 5% Triton-X100, 10 mM of each of the four deoxyribonucleotide triphosphates, 0.4 µM primer, 25 U/ml Taq polymerase and 20 ng of genomic DNA. Amplification was performed in a Perkin Elmer PCR system 9600 programmed for 45 cycles. Each cycle consisted of a denaturation step at 94 ºC for 1 min, a primer annealing step at 36 ºC for 1 min, and a primer extension step at 72 ºC for 2 min. Following amplification, the products were electrophoresed on 1% agarose gel in 0.5x Tris-borate-EDTA (TBE) buffer pH 8.0 for 15 V/cm, stained with ethidium bromide, and visualized by UV fluorescence.
ITS RFLP analysis and sequencing
The ITS region from 12 selected isolates, chosen according to a previous clustering analysis, was amplified with primers ITS1 (5'-TCCGTAGGTGAACCTGCGG-3')
and ITS4 (5'-TCCTCCGCTTATTGATATGC-3') (White et al. (1990). Amplification reactions were performed in 50 µl -volumes containing 10 mM Tris-HCl (pH 8.3), 50 mM KCl, 2.5 mM MgCl2, 200 µM each deoxynucleoside triphosphate, 0.5µM each primer, 10 ng of genomic DNA and 2.5 U Taq DNA polymerase. Temperature parameters were 94 ºC for DNA denaturation, 3 min for the first cycle and 1 min for the remaining cycles, 45 ºC for 1 min for primer annealing, and 72 ºC for 2 min for primer extension with a total of 35 cycles. Amplified products were analyzed by electrophoresis in 1.2% agarose gel and visualized after staining with ethidium bromide. A sample of 20 µl of each PCR product was digested with RsaI,Eco RV, Dra I, Eco RI,Hae III, Mse
I,Pst I, Taq I, according to the manufacturer’s instructions.
Digested DNA was run on 2% agarose gels. The gels were stained with ethidium bromide (0.5 µg/ml), and DNA was visualized under UV light.
method using the ABI Big Dye Terminator Cycle sequencing kit v 2.0 (Applied Biosystems Inc., Foster City, CA, USA) on an ABI PRISM model 3100 DNA sequencer.
Analysis of genetic similarity
The RAPD bands and restriction fragments were scored as present (1) or absent (0). Data were analyzed using the numerical taxonomy package NTSYSpc version 2.02.j. A similarity matrix was produced with the SIMQUAL program using the Nei & Li (1979) distance coefficient which measures the proportion of band mismatches between pairs of isolates. Cluster analysis was performed with the cluster program SAHN using the unweighted pair-group method with arithmetic averages (UPGMA). Principal coordinate analysis was obtained using the eigen values and eigen vectors for real symmetric matrices inside the ordination subroutine. Bootstrap analysis was obtained by 1000 replications with the program WINBOOT (Yap & Nelson, 1996).
Analysis of molecular variance
Analysis of molecular variance (AMOVA) was performed using WINAMOVA (Excoffier et al. 1992) on C. kikuchii isolates to partition the total variance into that
attributable to differences within and among populations components and among populations within groups (states). Isolates from one specific state constituted a population. For this analysis a total of 19 populations were considered (Londrina, São Carlos do Ivaí, Francisco Beltrão, Terra Boa, Santa Cecília do Pavão, Nova Cantú, Rondonópolis, Chapadão do Sul, Luiziana, Mineiros, Goiatuba, Rio Verde, Senador Carneiro, Anápolis, Bagé, Passo Fundo, Cruz Alta, Ijuí and Imperatriz) and together with 70 isolates from the states of PR, MT, GO, RS and MA.Two isolates from Bolivia were not included because of the low number. The variance among populations and the F statistic were tested by nonparametric randomization analysis. Estimation for gene flow (Nm) among populations and among states was performed using POPGENE, version 1.31; (http:// www.ualberta.ca/~fyeh/).
RESULTS
Cultural characteristics, cercosporin content and mycelial growth
Seventy-twoC. kikuchii isolates from the most diverse
soybean growing regions were observed for variation in the color of the mycelium and their morphology. Most colonies (51) had a purple tinge when observed from the underside of the Petri dish. Some colonies (21), however, were white to light gray or black. The mycelia on top varied greatly between white or dark gray to light violet. Since isolates exhibited different growth rates on PDA, seven randomly chosen isolates (1, 28, 31, 47, 63, 68 and, 75) were followed during a 16 day-period to estimate daily growth rate. Isolates 31 and 28 exhibited the fastest growth (0.71 cm/day) and slowest growth rate (0.29 cm/day), respectively.
The concentration of cercosporin was variable among isolates and among replications ranging from 0.3 to 41 nmol/ ml for isolates 37 and 47, respectively.
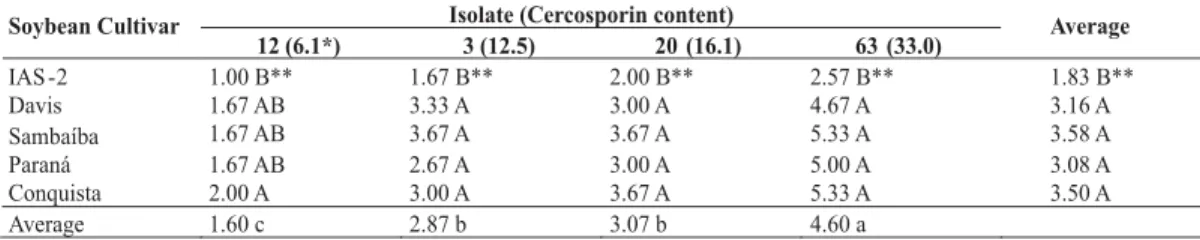
Virulence analysis
Virulence analysis performed with four isolates with different capacities for cercosporin synthesis showed that all isolates were able to infect soybean leaves, and that there was a correlation coefficient of 83% between cercosporin content and disease severity (Table 2). Isolates that showed purple to red halos in PDA media were also those that produced more cercosporin and were the most virulent. Lesions had a central necrotic area with a yellow halo visible one to two weeks after inoculation. Symptoms began to appear four to seven days after inoculation as irregular spots. Yellow halos developed three to seven days after the formation of the necrotic lesions. Isolates that produced low levels of cercosporin caused very small number of tiny necrotic foliar lesions. When inoculated into pods they were also able to induce purple seed stain (data not shown).
Analysis of genetic similarity
Of the 17 primers screened, 14 produced reproducible RAPD fragments in two trials. A total of 86 selected polymorphic amplicons were detected and generated a matrix of genetic distance. A dendrogram with seven clusters was obtained through the UPGMA (Figure 1). The matrix of similarities generated with all 72 isolates showed genetic distances ranging from 33% to 99%. The first cluster was comprised of 13 isolates with similarities ranging from 73% to 79%, with an average of 77%. The second cluster contained the majority of the isolates (51) for similarities ranging from 73% to 88%, for an average of 85%. The third cluster was formed by two isolates with similarities of 76%. The fourth cluster contained three isolates with similarities of 72% to 84% and an average of 79%. The fifth, sixth and seventh clusters contained only one isolate each. The geographic origin and virulence of the isolates did not correlate with RAPD groups. No marker was specific to an isolate’s ability to produce cercosporin.
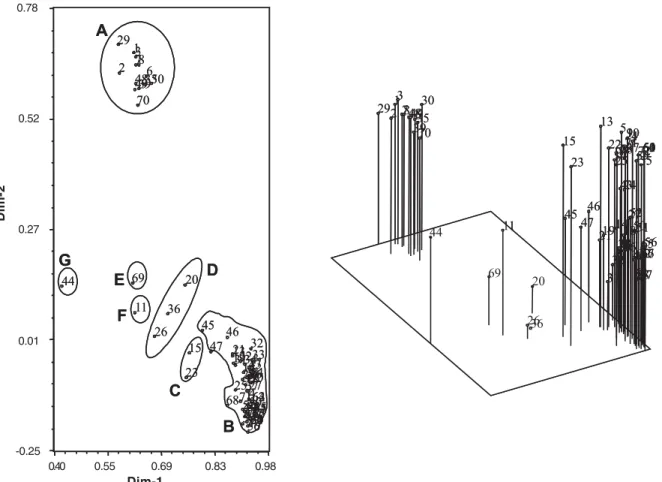
Bootstrap analysis of the 1,000 interactions showed values ranging from 53% to 100%. Principal coordinates analysis confirmed the clustering of isolates into seven groups with 79% of total variance explained by the two vectors used (Figure 2).
Analysis of molecular variance
TABLE 2 - Virulence analysis of Cercospora kikuchii isolates showing different cercosporin concentrations in soybean (Glycine max) cultivar
* Cercosporin content (nmol/ml) measured according to Jens et al., 1989.
**1= 0%-1% infected leaf area; 2=2%-5% infected leaf area; 3= 6%-10% infected leaf area; 4=11%-25% infected leaf area; 5= 26%-50% infected leaf area; 6=51% -75% infected leaf area; 7=>75% infected leaf area (adapted from James, 1971). Values followed by the same capital letter within a column and small letters in a line are not significantly different at P<0.05 according to Tukey’s test. No. of sampled leaves =8.
0.40 0.50 0.60 0.70 0.80 0.90 1.00
1 3 6 7 8 39 70 2 29 30 35 48 49 4 5 9 10 53 54 60 61 72 59 55 71 68 22 25 13 24 43 28 32 33 27 34 37 38 12 62 63 64 65 66 67 56 57 58 40 42 41 50 51 52 31 14 18 16 17 19 21 45 46 47 15 23 20 26 36 69 11 44
A
B
C
D
E
F
G
87
73
61
80
67
88
FIG. 1 - Genetic similarity among 72 Cercospora kikuchii isolates sampled from different regions in Brazil. Phenogram was estimated by clustering a distance matrix (Dice coefficient) of binary random amplified polymorphic DNA data using the unweighted pair group method of arithmetic means in the NTSYS program. Numbers at the major branches indicate the percentage occurrence of the cluster to the right of the branch in 1,000 bootstrapped data sets. Only branches occurring in 50% or more of the bootstrapped phenograms are labeled. A to G indicate the seven clusters of isolates found.
Isolate (Cercosporin content) Soybean Cultivar
12 (6.1*) 3 (12.5) 20 (16.1) 63 (33.0) Average
IAS -2 1.00 B** 1.67 B** 2.00 B** 2.57 B** 1.83 B**
Davis 1.67 AB 3.33 A 3.00 A 4.67 A 3.16 A
1.67 AB 3.67 A 3.67 A 5.33 A 3.58 A
1.67 AB 2.67 A 3.00 A 5.00 A 3.08 A
Conquista 2.00 A 3.00 A 3.67 A 5.33 A 3.50 A
Average 1.60 c 2.87 b 3.07 b 4.60 a
FIG. 2 - Two and three dimensional principal coordinate analysis of 72 Cercospora kikuchii isolates grouped in seven clusters (A through G). X and Y-axes account for 79% of total variation observed. X, Y and Z-axes account for 82.5% of total variance observed.
Source df Variance Total variance (%) statistic p
Among States 5 0.3066 2.64
W ithin populations 51 8.7133 75.09 0.249 0.001
Among populations and within States 14 2.5846 22.27
Ö
TABLE 3 - Analysis of molecular variance at three-levels for populations of Cercospora kikuchii, using random amplified polymorphic DNA phenotypes*
*Probability of having an equal or more extreme variance component statistic than the observed values by chance alone. Tested by nonparametric randomization analysis, using 1,000 repetitions.
A
B
C
D
E
F
G
72 71 70 69 68 67 66 65 64 63 62 61 60 59 5857 56 55 54 53 52 51 50 49 48 47 46 45 44 43 4241 40 39 3837 36 35 34 33 32 31 30 29 28 27 26 25 24 23 22 21 20 19 18 1716 15 14 13 12 11 10 9 8 7 6 5 4 3 2 1 1 2 3 4 5 6 78 9 10 11 12 13 14 15 16 17 18 19 20 2122 23 24 25 26 27 28 29 30 31 32 33 34 35 36 37 38 39 40 41 42 43 44 45 46 47 48 49 50 51 52 53 54 55 56 57 5859606162 63 64 65 66 67 68 69 70 71 72
0.40 0.55 0.69 0.83 0.98
0.78 0.27 0.52 0.01 -0.25 Dim-2 Dim-1
populations over all loci (0.45) was smaller than among States that showed Nm of 1.33.
ITS-RFLP and sequencing
PCR with primers ITS1 and ITS4 produced a DNA fragment of approximately 560 bp for the 12 isolates tested. No size variation was found among the amplified ITS regions. Of eight restriction enzymes used only three (Nde II, Hinf I
andAluI) cut the fragment. The observed band sizes were
310 and 200 bp for NdeII, 300 and 210 bp for HinfI and,
380 and 140 bp for Alu I. No polymorphism was detected
among the samples. Cercospora sojina Hara was used as an
out group and it exhibited a band of approximately 600 bp with the same number of restriction sites as C. kikuchii but
producing fragments of different sizes (for example 400 bp and 150 bp with Rs).
The PCR-amplified and cloned sequences of the 5.8 rDNA gene and its ITS flanking regions from all the 12 isolates were aligned. Sequences demonstrated identity of 97% to 100% with four sequences of C. kikuchii (GenBank
[1] [2] [3] [4] [5] [6] [7] [8] [9] [10] [11] [12] [13] [14] [15] [16] [17]
[1] AF291708
[2]AY152577 4
[3]AY266161 6 2
[4]AY266160 4 0 2
[5]AY266158 8 4 4 4 [6]AY6 33835 5 1 1 1 5 [7]AY633836 6 2 2 2 4 3
[8]AY633837 5 1 1 1 5 0 3
[9]AY633838 5 0 2 0 4 1 2 1
[10]AY633839 5 1 1 1 5 0 3 0 1
[11]AY633840 5 1 1 1 3 0 3 0 1 0
[12]AY633844 5 1 1 1 5 0 3 0 1 0 0
[13]AY633841 5 1 3 1 5 2 3 2 1 2 2 2
[14]AY633842 4 0 2 0 4 1 2 1 0 1 1 1 1
[15]AY739106 5 1 1 1 2 2 1 2 1 2 2 2 2 1
[16]AY633843 4 0 2 0 4 1 2 1 0 1 1 1 1 0 1
[17]AY739107 5 1 1 1 3 2 1 2 1 2 2 2 2 1 0 1 1
TABLE 4 - Pair-wise comparison between number of nucleotide differences of internal transcribed spacer regions of the ribosomal genes from Brazilian Cercospora kikuchii isolates (6 through 17) and C. sojina (AY266158) and C. kikuchii (AY266160, AY266161, AY152577 and AF291708) from GenBank
these four C. kikuchii sequences from the GenBank showed
the values ranging from 0 to 6 nts differences. The overall mean number of differences among Brazilian isolates was 1.2 nts over all 12 pair-wise comparisons. Most of the differences were inside the ITS2. The numbers of transitions within each of the 12 sequences from Brazilian isolates ranged from 0 to 3 while no transversions were observed. In another comparison, using the same 12 sequences with an isolate of C. sojina (GenBank AY266158) the values ranged
from 2 to 5 nts (Table 4).
DISCUSSION
The objective of this work was to investigate phenotypic and genotypic variation among isolates of C. kikuchii in order to provide information for the soybean
breeding program at Embrapa Soja. Data from this study revealed a considerable degree of variation in the population of C. kikuchii confirming previous results obtained by
Almeidaet al. (2001a) who had observed differences in morphological types and levels of pigmentation of the media where the isolates were grown.
Red pigmentation around colonies was caused by cercosporin, a non-host-specific phytotoxin isolated in 1957 (Kuyama & Tamura, 1957) from C. kikuchii. The role of
cercosporin in the pathogenicity of C. kikuchii was first
demonstrated by Upchurch et al. (1991) who considered it
crucial for the infection of soybean plants. They observed that spontaneous and UV-induced mutants that did not produce cercosporin were not able to cause infection when inoculated on soybean leaves. In our study the differences in virulence among the isolates were associated with cercosporin content, and constitute unprecedented information for this pathosystem. Cercosporin when excited by light produces
hydroxyl radicals and singlet oxygen. Singlet oxygen catalyses peroxidation of lipid membrane, disrupting cellular integrity, inducing leakage of cytoplasmic contents and causing cell death (Daub & Ehrenshaft, 2000).
The observation of red color around the colony appeared valueless in predicting virulence, since several isolates with no reddish color were virulent. However, all isolates with pigmented colonies were the most virulent. Isolates that produced more cercosporin were also more virulent.
It was not clear in our studies if the lack of color in the extract for colorimetric assay observed in some isolates could be due to the sensitivity of the method used since isolates with very low amounts of cercosporin were also able to cause lesions when inoculated on soybean leaves or purple stained seeds when inoculated into pods. Cercosporin content varied considerably among replications from the same colony and from different colonies.
The RAPD has been successfully used to assess the genetic variability of Cercospora species (Inglis et al., 2001; Weiland et al., 2001). The genetic diversity observed among
isolates through RAPD analysis was also an important result from this work. Seven RAPD groups were present among 72 isolates studied; however, the groups could not be correlated with cercosporin content, virulence or geographic origin of the isolates.
Similarly to other studies (Goodwin et al., 2001;
Almeidaet al., 2001b) molecular techniques such as RAPD
clustered together with low cercosporin producers. For example, isolates 3 (12.5 nmol/ml) and 63 (33.0 nmol/ml) were high producers of cercosporin and were separated in clusters A and B, respectively. Isolates 27 (11.4 nmol/ml) and 37 (0.3 nmol/ml) were clustered together but cercosporin content was significantly higher in isolate 27.
The effect of plant genotype on the genetic diversity of the isolates used was not consistent, probably due to the low number of isolates from each cultivar. This theory is currently under investigation. Most of the isolates, despite being isolated from different soybean genotypes, clustered together.
The occurrence of different haplotypes (RAPD profiles) in the same region suggests that the pathogen populations are not genetically uniform across the area, and this work may indicate how rapidly this pathogen evolved in different environments, since isolates collected from seeds were produced in both tropical and sub-tropical Brazilian regions.
Isolates that formed a single cluster (E, F and G) as well as other isolates from clusters A and B were selected for ITS sequence analysis. The results showed high similarity (97%-100%) with published sequences of C. kikuchii
(GenBank AY266160, AY266161, AY152577 and AF291708). The number of nucleotide differences of ITS of the rDNA among all 12 sequences observed in this work ranged from 0 to 3, with an average of 1.2 nts. However, Goodwinet al. (2001), in a previous publication, mentioned
that the mean number of nucleotide differences between three isolates of C. kikuchii ranged from 2 to 7 with an average of
4.7. These differences may be due to different sets of sequences (TREEBASE) used by Goodwin et al. (2001) for
comparing their isolates.
An additional comparison of Brazilian isolates (12) with an isolate of C. sojina (GenBank AY266158) showed
values ranging from 2 to 5 nts, different from the values of Goodwinet al. (2001) that found larger values ranging from
4 to 9 nts.
The variability found in this work was confirmed through additional statistical analysis. The estimator Östis highly different from zero (P > 0.001), indicating large genetic differentiation among populations from different regions (Hartl & Clark, 1997). The majority part of genetic variance was found within populations. The AMOVA analysis showed that the smallest fraction of variance was observed among populations within states that demonstrated substantial gene flow among states. When all isolates were analysed without clustering into states, a low estimated of genetic flow (Nm=0.45) was observed, suggesting that the variability among states is smaller than among collecting sites. This fact could be explained by the flux of seeds from traditional areas in the South to new areas in the Central and northern regions of Brazil. Traditional areas where soybean was cultivated for more than 30 years could have induced more diversity than new areas especially because of the genetic background of cultivars used over the years.
Populations of C. kikuchii are pathogenically,
genotypically and geographically variable. Considering that this pathogen is easily transmitted by seeds it is not surprising to find the same haplotypes in different regions. Migration could be favoured by infected seeds as demonstrated by the clustering analysis.
In Brazil, there has been a rapid increase in soybean producing area since 1970; therefore, the traffic of seeds from traditional areas to new areas could be responsible for the geographical variability since C. kikuchii is a seed borne
pathogen. However, this fact alone cannot explain all the genetic diversity observed. To what extent the soybean genotype may favor the development of new genetically distinct isolates is unknown. Unfortunately, an isufficient number of isolates was obtained from each area to permit the evaluation of gene flow among populations more precisely.
For a pathogen without known sexual reproduction, the observed diversity can be explained by single mutations and chromosomal aberrations like deletions, transpositions and chromosomal losses (Kistler & Miao, 1992). According to Kempken & Kuck (1998) transposons may increase variability in fungi. Also, fusion between vegetative cells of fungi may form heterokaryons (Carlile, 1986).
Control of Cercospora leaf blight may be possible through resistant cultivars although no resistant gene has been identified so far. However, different levels of susceptibility as observed by Walters (1978) were found in this study. These differences occurred with all isolates tested. Identification of a resistant gene against C. kikuchii would
be a great contribution for breeding programs. However, the pathogen’s variability must be considered in order to avoid drawbacks with the release of new cultivars. For countries with large soybean areas like Brazil it is very important to know in advance the variability of the pathogen, in order to avoid resistant released cultivars becoming susceptible when sown in different areas. The level of variability among isolates as identified in this work may help to define the breeding method for effective resistance.
ACKNOWLEDGMENTS
We thank Dr. E.S. Calvo and Dr. A.L. Nepomuceno for providing conditions for sequencing; L.C. Benato, M.C. Pinto and N. Valentin for helping in several steps of this work; M. Meyer and M.F. Gastal for providing infected seeds and, Dr. John Rupe (Univ. of Arkansas, USA), Dr. Marisa A. S. V. Ferreira (UnB), Dr. M. C. Bassoi and J.F. Ferraz de Toledo for discussions and suggestions on the manuscript.
Approved by the Head of Research and Development of Embrapa Soja as manuscript 141/2003.
LITERATURE CITED
M. Pathogenicity, molecular analysis and cercosporin content of Brazilian isolates of Cercospora kikuchii. Abstracts of the VII World Soybean Research Conference, Foz do Iguaçu. 2004. pp.69-70. ALMEIDA, A.M.R., SARTORI, F., CALVO, E.S., MARIN, S.R.R. & FUKUJI, T.S. Diferenciação morfo-bio-molecular de isolados deCercospora kikuchii obtidos de sementes de soja, no Brasil. Fitopatologia Brasileira 26:328. 2001a.
ALMEIDA, A.M.R., ABDELNOOR, R.V., CALVO, E.S., TESSMAN, D. & YORINORI, J.T. Genotypic diversity among brazilian isolates of Sclerotium rolfsii. Journal of Phytopathology 149:493-502. 2001b.
ALMEIDA, A.M.R., FERREIRA, L.P., HENNING, A.A., VELOSO, J.F.S. & YORINORI, J.T. Doenças da Soja. In: Kimati, H., Amorin, L., Bergamin Filho, A. Camargo, L.E.A. & Rezende, J.A.M. (Eds.). Manual de Fitopatologia. São Paulo. Ceres. 1997. pp.642-664.
CALLAHAN, T.M., ROSE, M.S., MEADE, M.J., EHRENSHAFT, M. & UPCHURCH, G.G. CFP, the putative cercosporin transporter ofCercospora kikuchii, is required for wild type cercosporin production, resistance, and virulence on soybean. Molecular Plant-Microbe Interactions 12:901-910. 1999.
CARLILE, M.J. Genetic Exchange and Gene Flow:Their Promotion and Prevention. In: Rayner, A.D.M. & Moore, D. (Eds.). Evolutionary Biological of the Fungi. Cambridge. Cambridge University Press. 1986. pp.203-214.
DAUB, M.E. & EHRENSHAFT, M. The photoactivated Cercospora toxin cercosporin:contribution to plant diseases and fundamental biology. Annual Review of Phytopathology 38:461-490. 2000.
EXCOFFIER, L., SMOUSE, P.E. & QUATTRO, J.M. Analysis of molecular variance inferred from metric distances among DNA haplotypes: application to human mitochondrial DNA restriction data. Genetics 131:479-491. 1992.
GARDNER, M.W. Indiana plant diseases. Proceedings of the Indiana Academy of Science. 35:237-257. 1925.
GOODWIN, S.B., DUNKLE, L.D. & ZISMANN, V.L. Phylogenetic analysis of Cercospora and Mycosphaerella based on the internal transcribed spacer region of ribosomal DNA. Phytopathology 91:648-658. 2001.
HARTL, D.L. & CLARK, A.G. Principles of Population Genetics. 3.ed. Sunderland (MA):Sinauer Associates. 1997. pp.111-122. INGLIS, P.W., TEIXEIRA, E.A., RIBEIRO, D.M., VALADARES-INGLIS, M.C., TIGANO, M.S. & MELLO, S.C.M. Molecular markers for the characterization of brazilian Cercospora caricis isolates. Current Microbiology 42:194-198. 2001.
JAMES, W.C. A manual of disease assessment keys for plant diseases. Canadian Department of Agriculture. Publication No. 1458. 1971.
JENNS, A.E., DAUB, M.E. & UPCHURCH, R.G. Regulation of cercosporin accumulation in culture by medium and temperature
04073 manipulation. Phytopathology 79:213-219. 1989.
KEMPKEN, F. & KUCK, U. Transposons in filamentous fungi: facts and perspectives. BioEssays 20:652-659. 1998.
KISTLER, H.C. & MIAO, V.P.W. New modes of genetic change in filamentous fungi. Annual Review of Phytopathology 30:131-152. 1992.
KUYAMA, S. & TAMURA, I. Cercosporin. A pigment of Cercospora kikuchii Matsumoto et Tomoyasu.II. Cultivation of fungus, isolation and purification of pigment. Journal of the American Chemistry Society 79:5725-5726. 1957.
LEHMAN, S.G. Purple stain of soybean seeds. North Carolina Agriculture Experimental Station Bulletin 369:1-11. 1950. MIYASAKA, S. Contribuição para o Melhoramento da Soja no Estado de São Paulo. (Tese de mestrado) Piracicaba, ESALQ. 1958.
NEEGAARD, P. Seed Pathology. London. MacMillan.1979. NEI, M. & LI, H. Mathematical model for studying genetic variation in terms of restriction endonucleases. Proceedings National Academy of Science USA 76:5269-5273. 1979. SCHUH, W. Influence of temperature and leaf wetness period on conidial germination in vitro and infection of Cercospora kikuchii on soybean. Phytopathology 81:1315-1318. 1991.
SEDIYAMA, T., CARDOSO, A.A. & ALMEIDA, A.M.R. Estudo do comportamento de variedades e linhagens de soja. Seiva 31:257-266. 1971.
UPCHURCH, R.G., WALKER, J.A., ROLLINS, J.A., EHRENSHAFT, M. & DAUB, M.E. Mutants of Cercospora kikuchii altered in cercosporin synthesis and pathogenicity. Applied and Environmental Microbiology 57:2940-2945. 1991.
WALTERS, H.J. Cercospora leaf blight of soybeans. Phytopathology News 12:165-166. 1978.
WEILAND, J., EIDE, J., RIVERA-VARAS, V. & SECOR, G. Genetic diversity of Cercospora beticola in the U.S. and association of molecular markers with tolerance to the fungicide triphentylin hydroxide. Phytopathology 91:S94. 2001. (Abstract) WHITE, T.J., BRUNS, T., LEE, S. & TAYLOR, J. Amplification and Direct Sequencing of Fungal Ribosomal RNA Genes for Phylogenetics. In: Innis, M.A., Gelfand, D.H. Sninsky, White, T.J. (Eds.). PCR Protocol, a guide to methods and applications. San Diego, CA. Academic Press. 1990. pp.315-322.
WRATHER, J.A., ANDERSON, T.R., ARSYAD, D.M., GAI, J., PLOPER, L.D., PORTA-PUGLIA, A. & RAM, H.H. Soybean disease loss estimates for the top 10 soybean producing countries in 1994. Plant Disease 81:107-110. 1997.