GROWTH, DEVELOPMENT, AND FERTILIZER-
15N
RECOVERY BY THE COFFEE PLANT
Tatiele Anete Bergamo Fenilli1; Klaus Reichardt2*; Durval Dourado-Neto3; Paulo César Ocheuze Trivelin4; José Laercio Favarin3; Flávio Murilo Pereira da Costa5; Osny Oliveira Santos Bacchi2
1
Fundação Universidade Regional de Blumenau (FURB) - Depto. de Engenharia Florestal, Campus II, R. São Paulo, 3250 - Itoupava Seca, 89030-000 - Blumenau, SC - Brasil.
2
USP/CENA - Lab. Física do Solo, C.P. 96 - 13400-970 - Piracicaba, SP - Brasil
3
USP/ESALQ - Depto de Produção Vegetal, C.P. 09 - 13418-970 - Piracicaba, SP - Brasil.
4
USP/CENA - Lab. Isótopos Estáveis.
5
IICA-Agrometeorologista/SEAF, Ministério do Desenvolvimento Agrário - SBN-Q1 Ed. Palácio do Desenvolvimento-Sala 604, 70057-900 - Brasília, DF - Brasil.
*Corresponding author<[email protected]>
ABSTRACT: The relationship between growth and fertilizer nitrogen recovery by perenial crops such as coffee is poorly understood and improved understanding of such relations is important for the establishment of rational crop management practices. In order to characterize the growth of a typical coffee crop in Brazil and quantify the recovery of 15
N labeled ammonium sulfate, and improve information for fertilizer management practices this study presents results for two consecutive cropping years, fertilized with 280 and 350 kg ha-1
of N, respectively, applied in four splittings, using five replicates. Shoot dry matter accumulation was evaluated every 60 days, separating plants into branches, leaves and fruits. Labeled sub-plots were used to evaluate N-total and 15N abundance by mass spectrometry.
During the first year the aerial part reached a recovery of 71% of the fertilizer N applied up to February, but this value was reduced to 34% at harvest and 19% at the beginning of the next flowering period due to leaf fall and fruit export. For the second year the aerial part absorbed 36% of the fertilizer N up to March, 47% up to harvest and 19% up to the beginning of the next flowering period. The splitting into four applications of the used fertilizer rates was adequate for the requirements of the crop at these growth stages of the coffee crop.
Key words: Coffea arabica L., stable isotope, nitrogen, dry matter accumulation, 15N
CRESCIMENTO, DESENVOLVIMENTO E RECUPERAÇÃO DO
15
N DO FERTILIZANTE EM CAFEEIRO
RESUMO: A relação entre o crescimento e a recuperação do N do fertilizante aplicado a culturas perenes como a do café não é bem conhecida e é um passo chave para o estabelecimento de práticas culturais racionais. Para caracterizar o crescimento de uma cultura típica de café do Brasil, quantificar a recuperação do sulfato de amônio marcado com 15
N e contribuir para a melhoria das práticas de manejo de fertilizantes, este estudo apresenta dados para dois anos agrícolas consecutivos, com fertilização de 280 e 350 kg ha-1 de N, respectivamente, aplicados em quatro vezes, utilizando cinco
repetições. O acúmulo de matéria seca pela parte aérea foi medido a cada 60 dias separando as diferentes partes da planta em ramos, folhas e frutos. Subparcelas marcadas com 15N foram utilizadas
para determinar as concentrações de 15N e N-total por espectrometria de massa. A parte aérea da
planta durante o 1º ano chegou a absorver 71% do N do adubo aplicado até fevereiro, mas esta porcentagem se reduziu até 34% na época da colheita e até 19% no início da nova floração. No 2º ano a parte aérea chegou a absorver 36% do N do adubo até março, 47% na colheita e 19% no início da próxima floração. As doses aplicadas (280 kg ha-1
de N no 1º ano e 350 kg ha-1
no 2º ano, ambos parcelados em quatro vezes) foram adequadas neste estágio de crescimento da cultura.
Palavras-chave: Coffea arabica L, isótopo estável, nitrogênio, acumulação de matéria seca, 15N
INTRODUCTION
Coffee (Coffea arabica L.) is one of the most
important crops of Brazilian agribusiness and despite the fact that its management practices are at a well
and is second (after Potassium) in amounts translo-cated to fruits, therefore being the most exported one (Catani & Moraes, 1958; Malavolta, 1993). The lack of N mostly limits its growth and productivity, there-fore the application of N as fertilizer represents a great share in the total production cost (Vaast et al., 1998). High rates of 450 kg ha-1 of N or more have been rec-ommended per agricultural year to be applied during the rainy season (Raij et al., 1996).
The best use of fertilizer by the coffee plant, mainly nitrogen, is related to the appropriate choice of rates and splittings (Martins, 1981; Viana, 1980) and, mainly, timing (Küpper, 1976; Moraes & Catani, 1964; Viana, 1980; Malavolta, 1986). A positive effect of NPK fertilization (Viana et al., 1987; Raij et al., 1996; Sanzonowics et al., 2001)is found in several reports, however, other demonstrate little or no response to the application of these nutrients (Gallo et al., 1999; Garcia, 1999).
The use of stable isotopes in the form of 15N labeled fertilizer is an excellent tool for such investiga-tion (Reichardt & Bacchi, 2004). Several studies have been carried out on Citrus using the 15N as a tracer to understand the plant demand on N during different phe-nologic stages, as well as its distribution within the plant (Wallace et al., 1954; Legaz et al., 1982; 1995; Feigenbaum et al., 1987; Lea-Cox et al., 2001). In Bra-zil, in relation to perenial crops, of special interest are the reports of Boaretto et al. (1999a; 1999b) and Fenilli et al. (2004). For the coffee crop there is little refer-ence to 15N studies (Bustamante et al., 1997; Snoeck & Domenach, 1999; Snoeck et al., 1998). Recently, Lima Filho & Malavolta (2003) studied the remobilization of N e K in normal and deficient coffee plants.
Using the 15N technology, the present study in-tends to clarify several points related to the behavior of the nitrogen in coffee crops and the improvement of fertilizer management practices.
MATERIAL AND METHODS
Field studies were conducted from 2003 to 2005 in Piracicaba, SP, Brazil (22°42’ S, 47°38’ W, 580 m) on a Typic Rhodudalfs (USDA, 1975), named Nitossolo Vermelho Eutroférrico, according to Brazil-ian classification system (Embrapa, 2006). The area presents an average slope of 9.2 ± 0.3% and average initial soil test levels performed during August 2003 for the 0-0.2 m surface layer were: 5.3 pH in water, 21.2 g kg-1 organic matter, 5.5 g kg-1 available P, 2.9, 19.9, 13.7, 20.5 mmolc kg-1 exchangeable K, Ca, Mg and (H + Al), respectively (Raij et al., 2001), 64% base saturation, 255; 309 and 436 g kg-1 of sand, silt and clay, respectively, and 1460 kg m-3 bulk density.
The climate is of the type “tropical highland” (Cwa) according to Köppen´s classification (Köppen, 1931), very adequate for coffee cultivation under plain sunshine conditions. Long term annual averages of air temperature, rainfall and relative humidity are: 21.1° C; 1,257 mm, and 74%, respectively. The rainy son extends from October to March and the dry sea-son from July to September. More details on water balance components that prevailed during the experi-mental period can be found elsewhere (Silva et al., 2006)
Coffee seedlings of the variety “Catuaí vermelho IAC-44” were planted in rows along con-tour lines in May 2001 with a row spacing of 1.75 m and 0.75 m between plants, with a population of 7,620 plants per ha. Coffee is a perennial crop which starts producing beans in the third year. In the region in ques-tion, the coffee is grown mainly under full sunshine, and each crop cycle begins with flowering at the end of the cold and dry season, as a consequence of the first significant rain, which occurs in the Piracicaba region during August-September. Fruit setting, grain filling and maturation take 9-10 months so that har-vest is made between May and June. Therefore our fertilizer trial started on September 1st, 2003 when plants were 1.2 m tall, and continued during two years, until August 30, 2005.
For total shoot dry matter DM (extensive vari-able) one whole plant per replicate was harvested (sacrified) outside each isotope sub-plot, chosen as being as similar as possible in shape and size in rela-tion to the isotopic plant. They were dissecated into parts as follows: central stem or orthotropic branch (OB); productive plagiotropic branches (PB); leaves of productive branches (LPB); vegetative plagiotropic branches (VB); leaves of vegetative branches (LVB); and fruits (FR) (beans). The growth and development of these parts were followed every 60 days during the whole experimental period (Pereira da Costa, 2006). This partitioning of the plant was made due to the dif-ferences in total-N content (CN) and 15N abundance (AN) of plant parts. The beginning of the evaluations started at 8:00 am of September 1, 2003 and dates after this are numbered as days after beginning (DAB), so that each experimental day starts at 8:00 am and ends the day after at 8:00 am.
In order to follow continuously the total DM of the plants as a function of time (DAB), data were adjusted to the four parameter sigmoidal model repre-sented by the equation:
⎟ ⎠ ⎞ ⎜ ⎝ ⎛ − − + + = d c t e b a DM 1 (1)
Dry matter (DM), nitrogen concentration in dry matter (CN), and isotopic abundance (AN) data of the different parts and of the whole shoot allowed the calculation at any DAB of:
1) total accumulated nitrogen (NA) (g per plant or kg ha-1):
100 N
C DM
NA= × (2)
2) the N derived from the applied fertilizer (Ndff) (%):
100 × ⎟ ⎟ ⎠ ⎞ ⎜ ⎜ ⎝ ⎛ − − = c N f N c N N A A A A
Ndff (3)
where ANc is the natural isotopic 15N abundance of the plant (0.367) and ANf the enriched abundance of the fertilizer;
3) the quantity of N derived from fertilizer (QNdff) (g per plant or kg ha-1):
NA Ndff
QNdff ⎟ ×
⎠ ⎞ ⎜ ⎝ ⎛ =
100 (4)
4) the fertilizer recovery by the plant (R):
100 × ⎟ ⎟ ⎠ ⎞ ⎜ ⎜ ⎝ ⎛ = f N Q QNdff
R (5)
where QNf is the amount of applied fertilizer.
Data were analysed using descriptive statisti-cal concepts: averages of five replicates, with respec-tive standard errors in brackets.
RESULTS AND DISCUSSION
Dry matter of the total shoot accumulation as a function of time (Table 1), shows that during the first year, starting from the beginning of flowering (0 DAB) up to the first harvest (243 DAB), dry matter increased continuously. After harvest a decrease in DM was observed due to fruit export and fallen leafs at harvest and cold winter (366 DAB). Some leaf fall also occurred before harvest due to carbohydrate redistri-bution from them to fruits. The absorbed N during fall
B A
D DM NA QNdff R
-t n a l p r e p g -- % 3
6 690(±77.40) 17.87(±1.59) 4.06(±0.46) 44.1(±5.05)
6 2
1 1,105(±116.33) 30.20 (±2.66) 13.00(±0.88) 47.2(±3.17) 2
8
1 1,659 (±140.32) 49.66(±3.07) 26.20 (±1.08) 71.3(±2.92) 3
4
2 2,222(±180.79) 58.34 (±5.95) 15.77(±2.78) 42.9(±7.57) 6
6
3 1,392 (±100.91) 20.76 (±2.20) 7.60(±1.23) 20.7(±3.34)
0 3
4 1,767 (±122.68) 33.55 (±2.37) 14.82(±1.69) 31.7(±3.51) 1
9
4 2,162 (±115.71) 42.22(±3.08) 20.27 (±2.42) 28.5(±3.40) 8
4
5 3,014(±251.76) 55.82 (±4.65) 29.82 (±3.69) 36.1(±4.47)
6 3
6 3,944(±272.60) 77.31(±5.29) 38.48 (±3.61) 46.54(±4.37) Table 1 - Averages and standard error of total dry matter (DM); accumulated N (NA); quantity of N derived from the fertilizer
and winter stays accummulated in the plant until spring when it is redistributed, being partially used for flow-ering and fruit development (Malavolta, 1993). When the vegetative growth is reassumed, the N content of the leaves tends to decrease, presumably due to its transfer to branches, new leaves, flower buds and fruits.
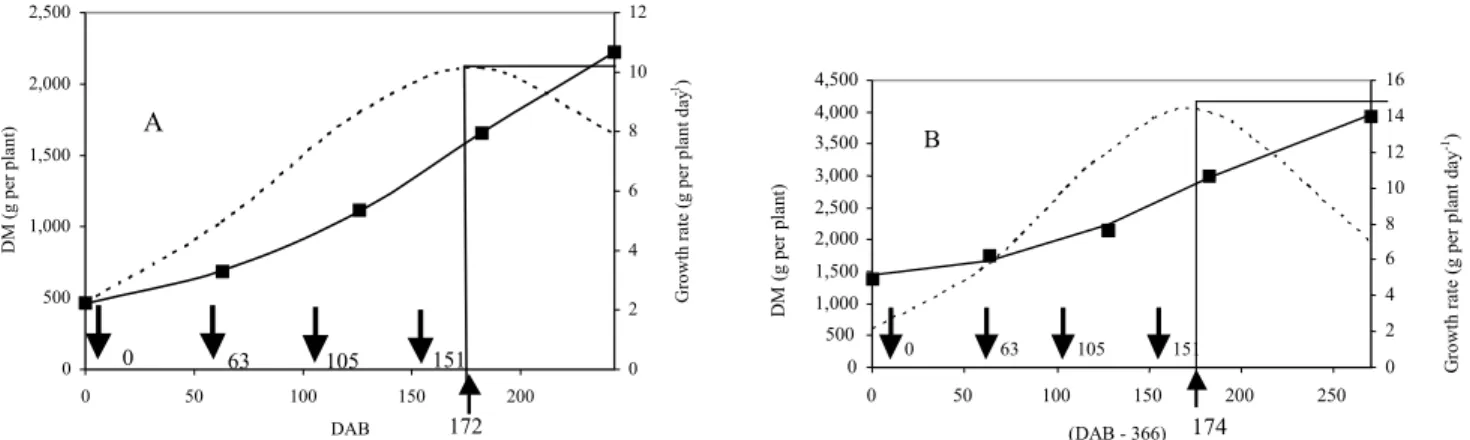
The total shoot DM accumulation from 0 to 243 DAB presented a sigmoidal behavior like annual crops, characterized by greater growth rates in the pe-riod of leaf production and fruit formation, with a slowing down towards fruit maturation and harvest. This fact can better be appraised by the excellent ad-justment of Table 1 DM data to equation (1), shown in Figure 1 (A). During the same growth period of the second year (flowering to harvest, 366 to 548 DAB), the crop presented the same behavior, and Figure 1 (B) shows how well equation (1) also fitted to the ex-perimental data of the aerial part of the coffee plant. The fittings were made through the Table Curve pro-gram, with the four parameters shown in Table (2), with R2 coefficients of 0.9999 and 0.9954 for both years, respectively, indicating a practically perfect ad-justment of the experimental data to the model. The fact that the same model (eq. 1) fitted to data of both agricultural years lead to a generalization in which both years data were jointly used to fit eq. 1 with relative values Y = [(DM - DMf) / (DMmax - DMf)], where DMf
is the dry matter at flowering (0 DAB) and DMmax at harvest; and relative time X = t/tmax, where tmax is the time at harvest (DAB). A very good adjustment (R2 = 0.9895) was also here obtained, with parameters pre-sented in Table 2.
Equation 1 also permitted the estimation of the coffee growth rates through their derivatives d(DM)/ dt, also presented in Figure 1. During the first year the growth rate was positive from 0 to 172 DAB, when a maximum of 10.5 g per plant day-1 was reached. This corresponds to 2.39 kg ha-1 day-1 of total-N and 1.20 kg ha-1 day-1 of fertilizer-N. Under average conditions, with a constant absorption rate of 0.72 kg ha-1 day-1 of fertilizer-N, measured in this experiment, the crop would take up 194 kg ha-1 of fertilizer N during 9 months, which is the main growth period of the crop. This shows that the 280 kg ha-1 of N applied the first year were more than average plant uptake.
Despite that this soil contains about 3,082 kg ha-1 of N in the 0-1.0 m layer, which represents 96% in relation to the applied fertilizer N, the fertilizer-N rep-resenting only 4% of this N, is readily available reach-ing a recovery of 71.3% at 182 DAB, not takreach-ing into account root fertilizer N. This stresses the importance of the N fertilization for coffee. An analysis of the growth rate evolution in Figure 1A indicates that the four fertilizer splittings (0, 63, 105 e 151 DAB) were applied during the phase of increasing growth rates,
Table 2 - Parameters for equation (1) for coffee dry matter accumulation as a function of time (DAB = days after beginning) for both years and for non-dimensional data.
r e t e m a r a
P 1styear (0- 243 DAB) 2ndyear(366- 636DAB) 1stand2ndyears (non-dimensional)
a 313.2 1326.4 - 0.0597
b 2604.5 3062.5 1.3454
c 178.0 173.8 0.6872
d 64.1 53.7 0.2385
before the maximum was reached. The choice of four splittings spaced 60, 105 and 150 days after flower-ing was coherent with plant needs. The most indicated phase for fertilizer application to coffee (Silva et al., 1984 and Matiello et al., 1983) should be after bloom, but before fruit filling, from October to February split-ting it two to three times, since applications before blooming in September or in the grain filling stage (end of March) are less effective on productivity gain, prob-ably due to N losses in September (low rainfall period) and March, a late period from the plant need point of view. After the last application was made (151 DAB) the growth rate started decreasing, however maintaining relatively high values up to harvest time.
The growth rate of the second year increased from 366 DAB (corresponding to 0 DAB in Figure 1B) to 540 DAB (174 DAB in Figure 1B), when it reached a maximum of 14.25 g per plant day-1 or 2.01 kg ha-1 day-1 of total-N and 1.05 kg ha-1 day-1 of fertilizer-N, thereafter decreasing until harvest 636 DAB. Again, four application times fell inside the period of increas-ing growth rates.
In relation to QNdff present in the plant (Table 1), at 63 DAB the aerial part absorbed 4.06 of the 9.19 g per plant applied at 0 DAB (1st fertilizer application), which corresponds to 44.1%. At 126 DAB the crop had already received three applications of fertilizer, that is, 27.57 g per plant, and had absorbed 13.00 g per plant or 47.2%. At 182 DAB when QNdff passed through a maximum, the four applications had already been made and the aerial part absorbed 26.2 g per plant, that is, 71.3% which is a very high proportion of the applied amount. If the QNdff of roots (5.2 g pl-1) is added to this value, which is presented in more detail elsewhere (Fenilli, 2006), the plant recovery efficiency reaches 85.5%. The QNdff balance presented in Fenilli (2006) justifies this high fertilizer-N recovery show-ing that the other fates of the fertilizer-N, includshow-ing losses, were very small. However, just before harvest (243 DAB) the QNdff was reduced to 15.77 g per plant. This reduction can be explained by transloca-tion of N from shoot to root, losses of plant parts like leaves and fruits and N losses from the plant to the atmosphere in the form of ammonia as suggested by Trivelin et al. (2002) and Holtan-Hartwig & Bockman (1994). The remobilization of certain nutrients is an important metabolic feature during plant development, in cases of seed germination, during stress conditions within the period of vegetative growth, and during the reproductive stage as well and, in the case of peren-nials, before leaf fall (Marschner, 1995).
At 366 DAB the plant had recovered 7.60 g per plant from the applied 36.76 g during the first year, corresponding only to 20.7% (Table 1). This result
masks the real value of 71.3% obtained for the previ-ous sampling (243 DAB) and shows the importance of sampling times in studies of fertilizer-N accumula-tion in perenial crops. Samplings should be performed as many times as possible, in order not to miss im-portant intermediate information. Other compartments of the whole soil-plant-atmosphere system, reported elsewhere (Fenilli, 2006), give a better overview of the pool sizes and processes involved in the fate of the fertilizer-N. In other situations, reports show lower recoveries, e.g. Bustamante et al. (1997) who found that coffee absorbed 35 to 46% of the fertilizer-N de-pending on the kind of fertilizer used as a source of N. It is important to mention that these authors con-sidered only the aerial part of the plant, which in our case would be 42.9% in the first year.
At 430 DAB the first application of the sec-ond year had already been made (36.76 + 11.48 g per plant of fertilizer-N), and the plant presented a recov-ery of 31.70% of fertilizer-N. At 491 DAB, with three fertilizer applications of the second year, plant absorp-tion was 20.27 g per plant or 28.5%. At 548 DAB, when all fertilizer splittings had already been per-formed, the shoot had absorbed 29.82 g per plant or 36.1%, and at harvest these numbers changed to 38.48 g per plant and 46.5%, respectively. These fertilizer-N recoveries evaluated during the second year, follow the same trend of those of the first year and the same comments made for the first year are valid for the sec-ond year.
reached 85.5% including roots. This very high fertil-izer-N recovery could even suggest the application of more than 280 kg ha-1 of N.
At 366 DAB the 1st application of the fertil-izer of the second year was performed, using the same fertilizer with the same enrichment and, there-fore, calculations of N recovery were made in a cu-mulative way, including the amount applied the first year. During the second year (Table 1) both total-N and fertilizer-N increased continuously. Detailed data on QNdff (Table 3) show that from 366 to 636 DAB, exception made to LPB all parts presented increases in fertilizer-N. Leaves from vegetative branches and fruits presented the highest N concentration, 27.1% and 49.9%, respectively, of the total aerial part. Since the second year was one of high productivity, trans-location of fertilizer-N from all parts to fruits was expressive, explaining the bianuality of the yield of coffee crops. The high fertilizer-N in leaves from veg-etative branches indicates the importance of fertili-zation in the preparation of the crop for next year’s production, since the next flowers will bear on these branches.
CONCLUSION
The growth of the coffee plant in terms of aboveground dry matter accumulation was sigmoidal for two consecutive years, between flowering (August/ September) and harvest (May/June) and could be ad-justed to a four parameter sigmoidal equation using non-dimensional variables.
During the first agricultural year the aerial part of the coffee plant recovered 71% of the applied fer-tilizer, and this value was reduced to 34% at harvest,
and to 19% at the beginning of the new flowering period. During the second year, considering the fer-tilizer applied since the first year, the aerial part re-covered 36% of fertilizer-N up to March, 47 at har-vest and 19% at the beginning of the next flowering period.
ACKNOWLEGMENTS
To FAPESP and CNPq for financial support.
REFERENCES
BARRIE, A.; PROSSER, S.J. Automated analysis of light-element stable isotope ratio mass spectrometry. In: BOUTTON, T.W.; YAMASAKI, S. (Ed.). Mass spectrometry of soils. New York: Marcel Dekker, 1996. p.1-46.
BOARETTO, A.E.; SCHIAVINATTO NETO, P.; MURAOKA, T.; TRIVELIN, P.C.O.; BISSANI, C.A. Eficiência da aplicação de 15N-uréia no solo e nas folhas de laranjeiras jovens. Laranja, v.20, p.477-498, 1999a.
BOARETTO, A.E.; SHIAVINATTO-NETO, P.; MURAOKA, T.; OLIVEIRA, M.W.; TRIVELIN, P.C.O. Fertilização foliar de nitrogênio para laranjeira em estágio de formação. Scientia
Agricola, v.56, p.621–626, 1999b.
BUSTAMANTE, C.; OCHOA, M.; RODRIGUEZ, M.I. Balance of three nitrogen 15N fertilizers in a Cuban Oxisol cultivated with Coffea arabica L. Tropicultura, v.15, p.169-172, 1997. CATANI, R.A.; MORAES, F.R.P. A composição química do cafeeiro.
Revista de Agricultura, v.1, p.45-57, 1958.
EMPRESA BRASILEIRA DE PESQUISA AGROPECUÁRIA.
Sistema brasileiro de classificação de solos. Rio de Janeiro:
Embrapa Solos, 2006. 306p.
ESTADOS UNIDOS. United States Department of Agriculture. Soil
taxonomy. A basic system of soil classification for making and
interpreting soil survey. Washington, 1975. 754p. (Agriculture Handbook, 436).
FEIGENBAUM, S.; BIELORAI, H. ERNER, Y.; DASBERG, S. The fate of 15N labeled nitrogen applied to mature citrus trees. Plant
and Soil, v.97, p.179-187, 1987.
FENILLI, T.A.B. The fate of fertilizer nitrogen (15N) in a coffee crop. Piracicaba: USP/CENA, 2006. 100p. (PhD – Thesis). r a e y . t l u c i r g
A DAB QNdff
B
O PB LPB VB LVB FR
-t n a l p r e p g
-1st
3
6 0.49(±0.06) 0.15(±0.03) 0.51(±0.18) 0.33(±0.09) 2.55(±0.24) 0.03(±0.01)
6 2
1 1.67(±0.12) 0.64(±0.07) 2.05(±0.47) 0.71(±0.09) 7.41(±0.60) 0.52(±0.28) 2
8
1 2.68(±0.17) 1.90(±0.09) 6.88(±0.68) 1.28(±0.05) 10.96(±0.87) 2.50(±0.71) 3
4
2 1.64(±0.54) 0.97(±0.27) 2.29(±0.48) 1.14(±0.55) 8.46(±3.24) 1.27(±0.81)
2nd
6 6
3 2.34(±0.34) 1.19(±0.26) 0.45(±0.14) 0.73(±0.10) 2.46(±0.42) 0.43(±0.10)
0 3
4 3.43(±0.31) 2.79(±0.44) 1.16 (±0.29) 0.71(±0.08) 5.32(±0.53) 1.41(±0.31) 1
9
4 3.55(±0.52) 1.89(±0.26) 0.46(±0.06) 0.51(±0.11) 6.29(±0.56) 7.56(±1.05) 8
4
5 4.16(±0.78) 1.94(±0.32) 0.38(±0.08) 1.19(±0.16) 12.35(±1.96) 9.81(±1.50) 6
3
6 4.99(±0.66) 2.37(±0.25) 0.25(±0.06) 1.21(±0.20) 10.44(±1.15) 19.22(±3.53) Table 3 - Averages and standard error of quantity of fertilizer-N (QNdff) as a function of time (DAB = days after beginning)
for the different aerial parts of the coffee plant.
FENILLI, T.A.B.; BOARETTO, A.E.; BENDASSOLLI, J.A.; TRIVELIN, P.C.O.; MURAOKA, T. Dinâmica do nitrogênio em laranjeiras jovens cultivadas em solução nutritiva. Laranja, v.25, p.461-472, 2004.
GALLO, P.B.; Van RAIJ, B.; GUAGGIO, J.A.; PEREIRA, L.C.E. Resposta de cafeeiros adensados à adubação NPK. Bragantia, v.58, p.341-351, 1999.
GARCIA, A.W.R. Determinação da saturação de potássio ideal para a cultura do cafeeiro (Coffea arábica L.) em solos com diferentes valores para a capacidade de troca catiônica. In: CONGRESSO BRASILEIRO DE PESQUISAS CAFEEIRAS, 25., Franca, 1999.
Anais. Rio de Janeiro: IBC, 1999. p.329-330.
HOLTAN-HARTWIG, L.; BOCKMAN, O.C. Ammonia exchange between crops and air. Norwegian Journal of Agricultural
Sciences, v.14, p.1-41, 1994. Supplement.
KÖPPEN, W. Grundriss der Klimakunde. Berlin: Walter D E Guyter & Co, 1931. 390p.
KÜPPER, A. Consumo mensal de nitrogênio pelo cafeeiro: quantidade época e modo de adubação nitrogenada. In: CONGRESSO BRASILEIRO DE PESQUISAS CAFEEIRAS, 4., Caxambu, 1976. Resumos. Caxambu: IBC, GERCA, 1976. p.215-217.
LEA-COX, J.D.; SYVERTSEN, J.P.; GRAETZ, D.A. Springtime 15nitrogen uptake, partitioning, and leaching losses from young bearing citrus trees of differing nitrogen status. Journal of the
American Society of Horticultural Science, v.126,
p.242-251, 2001.
LEGAZ, F.; PRIMO-MILLO, E.; PRIMO-YUFERA, E.; GIL, C.; RUBIO, J.L. Nitrogen fertilization in citrus. I. Absorption and distribution of nitrogen in calamondin trees (Citrus mitis Bl.)
during flowering, fruit set and initial fruit development periods.
Plant and Soil, v.66, p.339-351, 1982.
LEGAZ, F.; SERNA, M.D.; PRIMO-MILLO, E. Mobilization of the reserve N in citrus. Plant and Soil, v.173, p.205-210, 1995.
LIMA FILHO, O.F.; MALAVOLTA, E. Studies on mineral nutrition of the coffee plant (Coffea arábica L. cv. Catuaí Vermelho). LXIV. Remobilization and re-utilization of nitrogen and potassium by normal and deficient plants. Brazilian Journal
of Biology, v.63, p.481-490, 2003.
MALAVOLTA, E. Nutrição mineral e adubação do cafeeiro: colheitas econômicas e máximas. São Paulo: Agronômica Ceres, 1993. 210p.
MALAVOLTA, E. Nutrição, adubação e calagem para o cafeeiro. In: RENA, A.B.; MALAVOLTA, E.; ROCHA, M.; YAMADA, E. (Ed.). Cultura do cafeeiro: fatores que afetam a produtividade. Piracicaba: Instituto da Potassa & Fosfato, 1986. p.165-274.
MARSCHNER, H. Mineral nutrition of higher plants. New York: Academic Press, 1995. 887p.
MARTINS, M. Doses e parcelamento de adubação nitrogenada e potássica na formação do cafeeiro em solos de cerrado. In: CONGRESSO BRASILEIRO DE PESQUISAS CAFEEIRAS. 9., São Lourenço, 1981. Resumos. Rio de Janeiro: IBC, GERCA, 1981. p.378-381.
MATIELLO, J.B.; FIGUEIREDO, J.P.; SANTINATO, R.; BARROS, U.V. Parcelamento da adubação NPK pós-colheita. In: CONGRESSO BRASILEIRO DE PESQUISAS CAFEEIRAS. 10., Poços de Caldas, 1983. Resumos. Rio de Janeiro: IBC, GERCA, 1983. p.23-24.
MORAES, F.R.P.; CATANI, R.A. Absorção de elementos minerais pelo fruto do cafeeiro durante formação. Bragantia, v.23, p.331-336, 1964.
MULVANEY, R.L. Mass spectrometry. In: KNOWLES, R.; BLACKBURN, T.H. Nitrogen isotope techniques. San Diego: Academic Press, 1993. p.11-57.
PEREIRA DA COSTA, F.M. Growth and development of the coffee plant related to nitrogen fertilization. Piracicaba: USP/ESALQ, 2006. 80p. (PhD - Thesis).
RAIJ, B. van; CANTARELLA, H.; QUAGGIO, J.A.; FURLANI, A.M.C. Recomendações de adubação e calagem para o
Estado de São Paulo. 2.ed. Campinas: IAC; Fundação IAC,
1996. 285p.
RAIJ, B. van; ANDRADE, J.C.; CANTARELLA, H.; QUAGGIO, J.A. (Ed.). Análise química para avaliação da fertilidade
de solos. Campinas: Instituto Agronômico, 2001. 285p.
REICHARDT, K.; BACCHI, O.O.S. Isotopes in soil and plant investigations. In: Encyclopedia of soils and the
environment. Amsterdam: Elsevier, 2004. v.1, p.280-284.
SANZONOWICZ, C.; SAMPAIO, F.B.R.; NAZARENO, R.B.; TOLEDO, P.M.R.; SILVA, D.T.M. Fonte, doses e modos de aplicação de nitrogênio na produção do cafeeiro em solo de cerrado. In: SIMPÓSIO DE PESQUISA DOS CAFÉS DO BRASIL, 2., Vitória, 2001. Anais. Brasília: Embrapa Café, 2001. p.169-170.
SILVA, A.L.; ROVERATTI, R.; REICHARDT, K.; BACCHI, O.O.S.; TIMM, L.C.; BRUNO, I.P.; OLIVEIRA, J.C.M.;DOURADO-NETO, D. Variability of water balance components in a coffee crop grown in Brazil. Scientia Agrícola, v.63, p.105-114, 2006.
SILVA, O.A.; SANTINATO, R.; FIGUEIREDO, J.P.; BARROS, U.V. Parcelamento fracionado do nitrogênio na adubação do cafeeiro. In: CONGRESSO BRASILEIRO DE PESQUISAS CAFEEIRAS, 11., Londrina, 1984. Resumos. Rio de Janeiro: Ministério da Indústria e Comércio, 1984. p.287-289.
SNOECK, D.; DOMENACH, A.M. Demonstrating nitrogen transfer from legumes to coffee using isotope techniques. In: DIX-HUITIEME COLLOQUE SCIENTIFIQUE INTERNATIONAL SUR LE CAFÉ, Helsinki, Finland, 1999. Paris: ASIC, 1999. p.430-437.
SNOECK, D.; GANRY, F.; JADIN, P.; BEUNARD, P.; DOMENACH, A.M.; MPEPEREKI, S.M.; MAKONESE, F.T. Study of nitrogen fixing capacities of leguminous plants in coffee plantations in Burundi and their transfer possibilities. In: INTERNATIONAL CONFERENCE OF THE AFRICAN ASSOCIATION FOR BIOLOGICAL NITROGEN FIXATION, 6., Harare, Zimbabwe, 1998. Zimbabwe: University of Zimbabwe, 1998. p.232-239. TRIVELIN, P.C.O.; OLIVEIRA, M.W.; VITTI, A.C.; GAVA, G.J.
de C.; BENDASSOLLI, J.A. Perdas do nitrogênio da uréia no sistema solo-planta em dois ciclos de cana-de-açúcar. Pesquisa
Agropecuária Brasileira, v.37, p.193-201, 2002.
VAAST, P.; ZASOSKI, R.J.; BLEDSOE, C.S. Effects of solution pH, temperature, nitrate/ammonium rates and inhibitors on ammonium and nitrate uptake by Arabica coffee in short term solution culture. Journal of Plant Nutrition, v.21, p.1551-1564, 1998.
VIANA, A.S. Estudo de doses e parcelamentos de N e K na formação do cafeeiro em Led e Ter. In: CONGRESSO BRASILEIRO DE PESQUISAS CAFEEIRAS. 8., Campos do Jordão, 1980.
Resumos. Rio de Janeiro: IBC, GERCA, 1980. p.205-211.
VIANA, A.S.; MIGUEL, A.E.; LACERDA, M.P. Doses e parcelamento de adubação nitrogenada e potássica para formação e produção do cafeeiro em solos do cerrado II. In: CONGRESSO BRASILEIRO DE PESQUISAS CAFEEIRAS, 14., CONGRESSO LATINOAMERICANO DE TECNOLOGIA CAFEEIRA, 1., Campinas, 1987. Resumos. Rio de Janeiro: Ministério da Indústria e Comércio; IBC, 1987. p.249-252.
WALLACE, A.; ZIDAN, Z.I.; MUELLER, R.T.; NORTH, C.P. Translocation of nitrogen in citrus trees. Proceedings of the
American Society for Horticultural Science, v.64,
p.87-104, 1954.