Braz. J. Biol., 2015, vol. 75, no. 3 (suppl.), p. S112-S124 112
112
http://dx.doi.org/10.1590/1519-6984.01914BM Original Article
Population and biological parameters of selected fish species
from the middle Xingu River, Amazon Basin
Camargo, M.
a*, Giarrizzo, T.
band Isaac, VJ.
baInstituto Federal de Educação Ciência e Tecnologia da Paraíba – IFPB, Rua Santa Rita de Cássia, s/n, Jardim Camboinha, CEP 58103-772, Cabedelo, PB, Brazil
bLaboratório de Biologia Pesqueira e Manejo de Recursos Aquáticos, Universidade Federal do Pará – UFPA, Av. Perimetral, 2651, CEP 666100-425, Belém, PA, Brazil
*e-mail: [email protected]
Received: April 29, 2014 – Accepted: November 26, 2014 – Distributed: August 31, 2015 (With 2 figures)
Abstract
This study estimates the main biological parameters, including growth rates, asymptotic length, mortality, consumption by biomass, biological yield, and biomass, for the most abundant fish species found on the middle Xingu River, prior to the construction of the Belo Monte Dam. The specimens collected in experimental catches were analysed with empirical equations and length-based FISAT methods. For the 63 fish species studied, high growth rates (K) and high natural mortality (M) were related to early sexual maturation and low longevity. The predominance of species with short life cycles and a reduced number of age classes, determines high rates of stock turnover, which indicates high productivity for fisheries, and a low risk of overfishing.
Keywords: amazon fishes, population dynamics, life history strategies, Belo Monte dam.
Parâmetros biológicos e populacionais de peixes do meio Rio Xingu, Bacia
Amazônica
Resumo
Este estudo estima os parâmetros biológicos tais como taxas de crescimento corporal, comprimento assintótico, mortalidade, consumo por biomassa, produção biológica e biomassa, para 63 espécies no médio rio Xingu, antes da construção da hidrelétrica de Belo Monte. Os espécimes foram coletados por capturas experimentais e foram analisados com equações empíricas através do programa FISAT com base nos comprimentos corporais. Altas taxas de crescimento (K) e altas mortalidades naturais (M) foram relacionadas com uma maturação sexual precoce e baixa longevidade. O predomino de espécies com ciclos de vida curta e um reduzido número de classes etárias determinou altas taxas de renovação dos estoques, que indica alta produtividade para as pescarias e baixos riscos de sobrepesca.
Palavras-chave: peixes amazônicos, dinâmica populacional, estratégias de vida, hidrelétrica de Belo Monte.
1. Introduction
Dams represent one of the most profound human interventions in the hydrological cycle of rivers, causing fundamental impacts through the disruption of physical-chemical and biological processes. These impacts may benefit the populations of some fish species, but have an adverse effect on the majority of native species, given that few fishes are adapted to both lotic and lentic habitats (McCartney, 2009).
In order to mediate the potential effects of damming on natural fish populations, the systematic assessment of existing stocks provides a database for decision-making by the authorities responsible for the management and development of local fisheries (Gulland, 1983). In this context, population parameters provide essential data and
can be considered important indicators of the viability and sustainability of stocks, and their susceptibility to fishery activities (Froese and Binohlan, 2000).
Braz. J. Biol., 2015, vol. 75, no. 3 (suppl.), p. S112-S124 113 Biological parameters of fish species of the Xingu River
113 strategy, and in what way the population parameters of
these stocks indicate the physiological conditioning of the species to the new conditions created by the Belo Monte dam. This can be done by comparing the characteristics of present-day stocks with those found in the future reservoir.
The present study is the first to estimate growth rates, asymptotic length, mortality, consumption by biomass, biological yield, and the biomass of the principal fish species found in the middle Xingu River, prior to the construction of the Belo Monte dam, using length-weight data and length frequency analyses. This database on fish community structure and population dynamics will provide an important diagnostic tool for the management of local fishery resources, as well as of effective policies for regional development, through the evaluation and prediction of potential impacts on the Xingu ecosystem caused by the construction of the Belo Monte dam.
2. Material and Methods
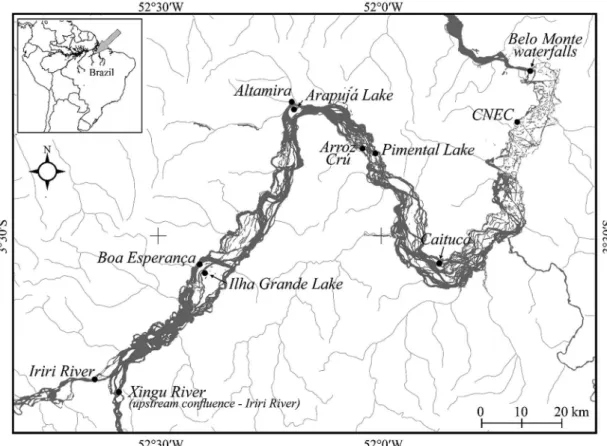
2.1. Study areaThe Middle Xingu River extends for 203 km from its confluence with the Irirí River to the Belo Monte waterfalls, winding sinuously through a relatively steep and rocky terrain (Figure 1). This portion of the lower Amazon basin is characterised by a relatively uniform profile with strongly dissected units, and numerous rapids and waterfalls carved
by the river into the faults of gigantic blocks of granite and gneisses of crystalline rocks and semi-consolidated Cenozoic sediments (Camargo et al., 2004, 2012).
The river’s hydrological regime is characterised by two main seasons, a flood period, between March and May, when mean discharge reaches approximately 15,000 m3.s-1, and a low water period, between August and October, when mean discharge declines to around 2000 m3.s-1.
This stretch of the river is home to many rare endemic species found only upstream from the Belo Monte waterfalls, which isolate this sector from the influence of the waters of the Amazon River. The “Big Bend” downstream from the town of Altamira has been identified as a priority area for conservation (Camargo et al., 2004), but it also corresponds to the area to be most impacted by the construction of the Belo Monte dam. The harvesting of ornamental fishes (plecos) and important food species represents an important source of income for local riverside populations (Camargo et al., 2012), with a total annual catch of approximately 3,000 tons (Camargo et al., 2009). 2.2. Collection of samples and data analysis
Samples were collected every two months between December, 2001, and November, 2002, at 11 localities along the middle Xingu, including the main channel, island lakes, and small inlets, using gillnets with eight different mesh sizes (20, 40, 70, 100, 120, 150, 180, and 210 mm). The nets were 54 m long and 2.5 m in height, and were set
Braz. J. Biol., 2015, vol. 75, no. 3 (suppl.), p. S112-S124 114
Camargo, M., Giarrizzo, T. and Isaac, VJ.
114
over a standard sample period of 24 hours, with a total of 116 samples conducted and 25,493 specimens collected. Samples representing the rainy season were collected in December, February, and May, and those for the dry season in July, August, October, and November.
The total length (cm) and individual weight (g) of all the specimens were measured. The asymptotic length was calculated according to Pauly (1984), which is based on the maximum length (Lmax) recorded for a given species. The average length of first sexual maturation (Lm) was calculated based on the empirical equation proposed by Froese and Binohlan (2000).
The annual food consumption/biomass ratio (Q/B) was estimated using the empirical model of Palomares and Pauly (1998). In the Q/B equation, h and d represent the feeding type: (h = 1 and d = 0 for herbivores; h = 0 and d = 1 for detritivores; h = 0 and d = 0 for carnivores). To determine the mean Aspect Ratio (AR) for each species, the height (cm) and the area of the caudal fin (cm2) of 1,779 individuals of 55 species were measured with Scion Image 4.02 software. W∞ is the asymptotic wet weight in grams of the population, calculated according to Pauly (1984).
The frequency of different body length classes was analysed using the ELEFAN I routine of FISAT package (Gayanilo Junior et al., 1996) to estimate von Bertalanffy’s growth equation parameters, determining mean length L in relation to fish age, t (Brey and Pauly, 1986). Once the von Bertalanffy growth parameters were obtained, total mortality Z was estimated by the length-converted catch curve method in ELEFAN II. The linearised length-converted catch curve (Pauly, 1984) was constructed using the Equation 1:
= + ∆ i i i N
Ln a bt
t (1)
where Ni is the number of individuals in length class i, Δt is the time needed for the fish to grow through length class i, t is the relative age (computed with t0 = 0) corresponding to the mid-length of class i. The slope (b) of the curve with the sign inverted gives the value of Z.
Assuming the existence of an exponential decrease model, the total mortality Z is considered to be equivalent to the production and biomass ratio of the population (P/B) (Allen, 1971).
The natural mortality (M) for each species was estimated by the empirical formula of Pauly (1980), using the previously estimated growth parameters and 28.6 °C as the annual average temperature of the water surface, measured over the year.
As the length parameters (Lmax and L∞) are influenced by genetic, environmental (availability of resources), and demographic (density) factors, whereas growth rates (k) are determined genetically and/or physiologically (Beverton and Holt, 1957; Sparre and Venema, 1992), a matrix of Pearson correlation coefficients was constructed in order to understand the relationship between these biological parameters.
Based on the information obtained on growth, mortality and reproduction, the species were grouped according to their life strategy classification (Winemiller and Taphorn, 1989).
Since there are no historical data on fishery catches in the study area, mean fish biomass was estimated through three indirect approaches. The first estimate was obtained by extrapolation from the mean fish biomass estimated for an equivalent stretch of the neighboring Tocantins River (Merona, 1990), which is similar to the Xingu in size and most physical features, such as its topography and its drainage of part of the Brazilian Shield, a crystalline pre-Cambrian formation (Klammer, 1984). This accounts for the relatively nutrient-poor waters and soils of the region (Fittkau, 1971; Furch, 1984). Using GIS, the area drained by a 1-km stretch of the Tocantins was estimated and multiplied by the estimate of biomass to obtain an estimate of the mean biomass per unit area for the Xingu.
From an estimated 10.63 t of fish per kilometer (Merona, 1990) for the Tocantins prior to the construction of the Tucuruí dam, a mean total biomass of 15.66 t/km2 was estimated. This estimate was extrapolated to the study area on the Xingu. The fish biomass obtained for the Xingu in kilograms per hectare was divided proportionally in relation to the relative abundance of each species obtained from the landing volumes of fishing vessels for the dry and rainy seasons.
A second estimate of average biomass was obtained using Cadima’s formula (Sparre and Venema, 1992). This approach is used for the assessment of exploited fishing stocks for which limited data are available. In this case, the yield (Y) of 632 randomly-selected catches landed at the ports of Altamira between 1999 and 2002 were used to estimate biomass.
The total number of fishermen in the region was estimated based on information provided by local fishery authorities in interviews as 803 working between the confluence with the Iriri and Belo Monte village, and a total of one thousand who dedicate some or all of their time to the harvesting of ornamental fishes (Camargo et al., 2009). Based on the records available from the local fishing colonies, a total of 1,500 fishermen were estimated to operate in the study area (Norte Energia, 2013).
Braz. J. Biol., 2015, vol. 75, no. 3 (suppl.), p. S112-S124 115 Biological parameters of fish species of the Xingu River
115 species in terms of abundance and their commercial value
on the same stretch of river. Equation 2,
0.5 * *
=
MSY Z B (2)
B= average biomass per annum (kg.ha-1) Z = total mortality
The third biomass estimate was based on a modification of Cadima’s actual sustainable yield, Equation 3, which is also applicable to fishing data with sampling limitations (Kolding, 1994a):
Where,
=
SY TAC (Total acquired catch)=xB Zc c (3) SY: actual sustainable yield
x: actual yield ratio that may be captured through fishing Bc: actual biomass
Zc: total mortality per annum.
Thus, under balanced conditions and assuming that half of the total yield of the stock can be divided between the fish and predators, it can be supposed according Equation 4,
( + ) c≈0.5 c
x F M B P (4)
where:
F = mortality by fisheries M = natural mortality Pc: total yield per annum.
Where reliable data are lacking, a conservative factor of x = 0.5 is typically applied to the top predators, and x = 0.25 to each subsequent lower level for maximizing sustainable output without causing profound structural imbalances to the community (Kolding, 1994b).
Considering that the fishery yield is a function of the available biomass and of actual mortality by fishing, Bc was estimated (Equation 5):
= c
c c Y B
F (5)
where,
Fc: actual mortality by fishing Yc: actual yield per annum.
Thus, with a gross estimate of the actual annual yield for the system through landings and the number of fishermen known to work in the study area, it is possible to predict the actual yield per annum (Yc). Knowing fisheries mortality and natural mortality, the actual biomass was estimated in order to obtain the actual yield (Pc), Equation 6:
0.5
≈ c
c xZB
P (6)
The estimate of the total yield per annum was based on Backiel’s method (see Backiel and Welcomme, 1980), which is derived from the catch and natural or total mortality estimate ratio (Equation 7):
+
=Bc Bm
P
K (7)
where,
Bc: annual catch (or yield)
Bm: biomass removed by natural mortality K: P/B ratio
When insufficient data are available for reliable calculations of natural mortality, Backiel and Welcomme (1980) recommended the assumption that the catch and the biomass removed by natural mortality are of the same order of magnitude, resulting in a population in equilibrium, with little variation in P/B. It can thus be assumed that Bc and Bm are of the same order of magnitude (Bc+Bm) = 2Bc, with mortality being offset by recruitment and growth.
3. Results
The population parameters calculated for the 63 species analysed in this study are presented in Table 1. Forty-one species (65%) were characiforms, 13 (21%) were siluriforms, eight (12%) perciforms and one (2%) was a clupeiform.
A negative correlation was found between the asymptotic length (L∞) and the growth constant K. Similarly, L∞ presented a strong negative correlation with total mortality Z and, therefore, with P/B. Another negative correlation was observed between L∞ and the population consumption rate by biomass, Q/B (see Table 2).
Braz. J. Biol., 2015, vol. 75, no. 3 (suppl.), p. S1
12-S124
11
6
Camar
go, M., Giarrizzo,
T
. and Isaac,
VJ.
11
6 Table 1. Biological parameters for 63 selected fish species of the lower Xingu River, Amazon, Brazil.
Taxa AR
(n1)*
Q/B (year-1)
(n1)
L∞ (cm)
(n2)
Lm (cm)
K (year-1)
(n2)
P/B B1
(Kg/ha) (Kg/ha)B(Cadima) (1/year)M age
(years) n1 n2
Known Migration Characiformes/
Acestrorhynchidae
Acestrorhynchus falcatus - - 34.0 21.9 0.58 2.73 - - 1.25 3.6 730 1
Acestrorhynchus falcirostris - - 36.0 23.1 0.39 1.81 - - 0.93 4 462
Acestrorhynchus microlepis 2.15 15.55 32.6 21.1 0.60 3.61 - - 1.28 2.5 10 248
Anostomidae
Laemolyta proxima - - 27.4 18.1 0.53 1.27 0.089 - 1.25 4 1
Laemolyta petite - - 27.4 18.1 0.56 1.66 0.044 - 1.29 3.8 176 1
Laemolyta fernandezi 1.26 40.94 27.4 18.1 0.58 1.57 0.089 - 1.32 3.9 19 1
Leporinus sp. “verde” 1.86 18.86 37.9 24.2 0.41 2.07 0.222 0.060 - 0.700 0.96 3.5 42 380
Leporinus tigrinus 1.19 33.00 16.8 11.6 - - - - 23
Characidae
Agoniates halecinus 1.41 12.91 28.0 18.4 0.69 2.79 - - 1.47 3 45 544
Brycon pesu 1.78 18.95 18.9 12.9 - - - - 24 1
Brycon falcatus 2.03 19.50 45.2 28.3 - - 0.130 - 10
Bryconamericus orinocoense 1.97 65.19 14.7 10.3 - - - - 16 1
Chalceus epakros 1.08 16.00 16.8 11.6 - - - - 24
Moenkhausia intermedia - 12.60 13.7 9.7 0.95 2.53 - - 2.22 2.5 1168 1
Myleus setiger 3.02 35.14 25.2 16.8 0.60 1.73 0.012 - 1.38 3 19 176 1
Myleus rubripinnis 3.09 40.99 35.7 22.9 0.63 1.87 0.489 - 0.646 - 1.30 3 19 102 1
Myleus schomburgki 3.01 45.33 31.6 20.5 0.51 2.89 0.014 0.030 1.17 2.5 43 125 1
Myleus rhomboidalis - - 56.8 34.8 0.56 1.51 1.223 - 1.641 0.180 1.05 4 109 1
Myleus torquatus 2.97 32.92 42.0 26.5 0.43 1.71 0.734 - 0.968 4.700 - 6.100 0.97 6 64 399
Roeboides sp. 1.17 12.99 11.6 8.4 - - - - 17
Serrasalmus rhombeus - - 46.2 28.9 0.64 1.25 0.007 0.026 1.22/1.18 3.5 325
Serrasalmus serrulatus - - 48.4 30.1 0.49 2.04 0.003 - 1.01 4.5 229
Tometes sp. “xingu” 2.88 38.49 45.0 28.2 0.58 1.16 0.082 - 1.15/0.98 3.5 31 121
Triportheus rotundatus 1.32 30.99 30.5 19.9 0.76 2.44 - - 1.53 3 638 659
Chilodontidae
Caenotropus labyrinthicus 1.53 39.20 21.5 14.5 0.84 3.43 - - 1.80 2.5 37 979
Braz. J. Biol., 2015, vol. 75, no. 3 (suppl.), p. S1
12-S124
11
7
Biological parameters of fish species of the Xingu River
11
7
Table 1. Continued...
Taxa AR
(n1)*
Q/B (year-1)
(n1)
L∞ (cm)
(n2)
Lm (cm)
K (year-1)
(n2)
P/B B1
(Kg/ha) (Kg/ha)B(Cadima) (1/year)M age
(years) n1 n2
Known Migration
Ctenolucidae
Boulengerella cuvieri 1.97 9.13 78.0 46.2 0.36 1.4 0.029 0.084 46 635
Boulengerella maculata 1.38 11.32 30.5 19.9 - - 0.007 - 14 14
Curimatidae
Curimata inornata 1.24 20.43 21.1 14.3 0.93 4.73 - - 1.94 2.6 16 1330
Curimata ocellata 2.76 47.16 23.2 15.5 - - - - 9 9
Curimatella immaculata 1.49 41.84 19.0 13.0 0.90 3.2 - - 1.95 2.5 17 1828
Cyphocharax gouldingi 2.75 23.15 16.8 11.6 0.95 2.31 - - 2.09 39 329
Cynodontidae
Hydrolycus armatus 2.73 7.84 94.7 55.0 0.15 0.58 0.028 0.156 0.39 11 35 217 1
Rhaphiodon vulpinus 2.56 10.76 74.7 44.5 0.31 0.81 - - 0.66 5.5 14 97 1
Erythrinidae
Hoplias malabaricus 1.19 7.76 41.0 26.0 - - 0.303 - 10 10
Hemiodontidae Argonectes robertsi
2.44 28.89 43.1 27.1 0.45 1.18 0.0001 -
0.012 0.001 - 0.033 0.99 4 15 275 1
Bivibranchia fowleri 2.99 52.60 21.0 14.2 - - -
-Hemiodus argenteus 1.79 30.09 27.3 18.0 0.58 2.87 0.003 - 1.32 2.9 65 580
Hemiodus unimaculatus 1.64 35.03 26.3 17.4 0.65 3.25 0.017 0.0004 -
0.029 1.44 2.9 43 5143
Hemiodus vonderwinkleri 1.59 35.69 23.1 15.5 0.63 2.72 0.001 - 2.60 1.56 33 1479
Prochilodontidae
Prochilodus nigricans 2.37 26.88 42.1 26.6 0.39 1.03 0.256 - 1.561 0.810 - 4.950 0.77 6 26 244 1
Semaprochilodus brama 2.39 22.79 67.4 40.6 0.33 1.57 0.071 - 0.303 0.150 - 0.630 0.71 5 48 148 1
Clupeiformes / Clupeidae
Ilisha amazonica - - 25.2 16.8 0.64 2.96 - - 1.44 2.5 161 1
Perciformes / Cichlidae
Cichla melaniae 1.17 10.05 53.0 32.7 0.48 2.08 4.53 - 4.75 7.100 - 7.460 0.97 3.2 20 98
Geophagus gr. altifrons 1.10 29.41 26.3 17.4 0.82 1.91 0.202 0.347 1.68 2.3 17 845
Geophagus proximus 1.09 27.76 25.0 16.6 - - - - 67 67
Braz. J. Biol., 2015, vol. 75, no. 3 (suppl.), p. S1
12-S124
11
8
Camar
go, M., Giarrizzo,
T
. and Isaac,
VJ.
11
8 Table 1. Continued...
Taxa AR
(n1)*
Q/B (year-1)
(n1)
L∞ (cm)
(n2)
Lm (cm)
K (year-1)
(n2)
P/B B1
(Kg/ha) (Kg/ha)B(Cadima) (1/year)M age
(years) n1 n2
Known Migration
Geophagus argyrostictus 0.89 31.60 22.1 14.9 - - - - 22 22
Sciaenidae
Pachyurus junkii 1.01 10.72 38.0 24.2 0.67 1.5 0.191 0.416 1.33 32 69
Petilipinnis grunnniens 1.27 11.61 18.9 12.9 0.84 3.67 - - 1.87 2.7 26 544
Plagioscion magdalenae - - 62.1 37.7 0.41 1.31 3.38 - 5.06 8.430 -
12.640 0.84 5 59 439
Plagioscion squamosissimus 1.02 8.27 63.1 38.2 - - - - 82 82
Siluriformes Auchenipteridae
Ageneiosus ucayalensis - - 32.6 21.1 0.54 3.45 - - 1.18 3 480 1
Ageneiosus inermis 2.36 - 73.7 43.9 0.25 1.61 0.078 - 1.163 0.158 - 2.360 0.57 553 1
Auchenipterichthys
longimanus 1.19 18.86 25.2 16.8 - - - - 34 34
Auchenipterus nuchalis - - 25.3 16.8 0.83 2.51 - - 1.71 3 405
Centromochlus schultzi 2.65 24.14 14.7 10.3 - - - - 21 93
Centromochlus heckelii - - 18.0 12.4 0.80 2.11 - - 1.84 2.5 318
Tocantinsia piresi 1.29 18.24 61.0 37.1 0.34 1.99 - - 0.75 489
Doradidae
Hassar orestis 1.49 18.83 24.0 16.0 0.88 1.87 0.012 0.021 1.80 1.8 30 538
Loricariidae
Baryancistrus niveatus - - 40.0 25.4 0.46 1.36 - - 1.02 219
Loricaria cataphracta 1.45 34.05 39.0 24.8 0.49 1.98 - - 1.07 3.5 11 728
Pimelodidae
Pseudoplatystoma punctifer 1.75 6.90 130.0 73.1 - - 0.036 - 0.590 - 10 10 1
Phractocephalus hemilioterus - 5.70 140.0 78.2 0.30 0.85 0.004 0.010 15 15 1
Brachyplatystoma
filamentosum - - 190.0 102.8 - - 0.154 - 0.51 14 1
Braz. J. Biol., 2015, vol. 75, no. 3 (suppl.), p. S112-S124 119 Biological parameters of fish species of the Xingu River
119 Even assuming that mesh size may have a selective
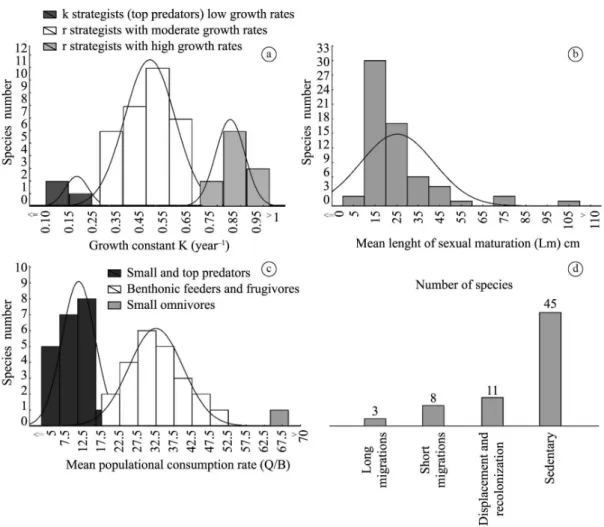
effect on the capture of specimens of different sizes, mean length at first sexual maturation (Lm) ranged from 5 cm to 105 cm. Species with shorter body lengths tended to
initiate sexual maturation at body lengths of between 15 cm and 25 cm, including Acestrorhynchus microlepis, Acestrorhynchus falcatus, Laemolyta proxima, Leporinus sp. “green”, Agoniates halecinus Müller & Troschel 1845,
Figure 2. (a) Life strategies classification, based on the growth constant for Middle Xingu River fish species. (b) Frequency of
fish species based on class of length of first sexual maturation - Lm. (c) Frequency of fish species based on Food consumption
by biomass - Q/B. (d) Migratory behaviour for fish species of the Middle Xingu River.
Table 2. Populational variables correlations for 63 selected fish species in the Xingu River.
Variável AR Q/B L∞
(cm)
Lm
(cm) K (ano
-1) P/B B1
(Kg.ha-1)
B(2)
(Kg.ha-1) M Age
AR 1.00
Q/B 0.34 1.00
L∞ (cm) 0.39 -0.62 1.00
Lm (cm) 0.39 -0.61 1.00 1.00
K (ano-1) -0.65 0.30 -0.83 -0.84 1.00
P/B -0.28 0.56 -0.66 -0.66 0.52 1.00
B1 (Kg.ha-1) -0.38 -0.42 0.12 0.13 -0.08 0.03 1.00
B2 (Kg.ha-1) -0.09 -0.24 0.09 0.11 -0.16 -0.07 0.87 1.00
M -0.60 0.36 -0.85 -0.86 0.99 0.59 -0.15 -0.22 1.00
Age 0.55 -0.43 0.87 0.86 -0.81 -0.72 -0.08 0.07 -0.82 1.00
Significative correlations in bold (p < 0,05). AR: Aspect ratio; Q/B: Food consumption by biomass; L∞: asymptotic length; Lm: mean length of first sexual maturation; K: growth constant; P/B: Production by biomass; B1: biomass estimates based on Merona
Braz. J. Biol., 2015, vol. 75, no. 3 (suppl.), p. S112-S124 120
Camargo, M., Giarrizzo, T. and Isaac, VJ.
120
Myleus setiger, Myleus schomburgki, Myloplus gr. asterias, Boulengerella maculata (Valenciennes, 1850), Hemiodus unimaculatus (Bloch, 1794), Hemiodus vorderwinkleri (Géry, 1964), Geophagus gr. altifrons Heckel, 1840, Auchenipterichthys longimanus (Günther, 1864), and Hassar orestis (Steindachner, 1875) (see Figure 2b).
The values of the average population consumption rate (Q/B) varied between 5 and 69. Grouping the species by feeding habits, it was possible to identify three principal groups. In the first group, there are large and small predators, with low average consumption rates (mean =12.5), including: Acestrorhynchus microlepis, Agoniates halecinus, Roeboides sp, Boulengerella maculata, Hydrolycus armatus, Rhaphiodon vulpinus, Hoplias malabaricus (Bloch, 1794), Cichla melaniae, Pachyurus junki Soares & Casatti, 2000, and Plagioscion squamosissimus (Heckel, 1840). The species in the second group feed on large-bodied benthonic organisms and/or fruit, and present Q/B values varying from 22 to 52 (mean = 35). These species include Laemolyta fernandezi Myers, 1950, Leporinus tigrinus Borodin, 1929, Myleus setiger, Myloplus rubripinnis (Müller & Troschel, 1844), Myleus schomburgki, Tometes sp. Xingu,
Argonectes robertsi, Bivibranchia velox (Eigenmann & Myers, 1927), Hemiodus tocantinensis Langeani, 1999, Hemiodus unimaculatus, Geophagus gr. altifrons, and Geophagus argyrostictus Kullander, 1991. The third group included small-sized fishes, such as Bryconamericus orinocoense Román-Valencia, 2003, and Bivibranchia fowleri (Steindachner, 1908), which present high rates of consumption by biomass (see Figure 2c). The most common forms were the small predators, bottom-feeders, and the fishes that feed on allochtonous material, such as seeds and fruits. In relation to migratory (short or long) or displacement and recolonisation behaviour, 22 species (30%) were recorded (see Figure 2d).
Total fish biomass estimated for the study area on the middle Xingu River was 1,206 tons. Based on this estimate and taking into account the species composition of the commercial fishery catch for the dry season, a mean biomass of 18.7 kg.ha-1 was obtained. The average biomass, calculated based on Merona’s approach (1990) or Cadima’s formula, was 18.9 kg.ha-1 and 22.2-35.4 kg.ha-1 respectively (see Table 3).
Table 3. Mean biomass and by species (kg.ha-1), based on Merona (1990) and on Cadima equation during the dry and wet season.
Species
Biomass (kg.ha-1)
(wet / dry)
MERONA (CADIMAwet / dry)
Ageneiosus inermis 0.078 / 1.163 0.158 / 2.364
Argonectes robertsi 0.000 / 0.012 0.001 / 0.033
Boulengerella cuvieri / 0.036 / 0.084
Brachyplatystoma filamentosum / 0.154
Brycon falcatus / 0.130
Cichla melaniae 4.746 / 4.530 7.466 / 7.126
Different minor species 4.866 / 0.205
Geophagus altifrons / 0.202 / 0.347
Hassar orestis / 0.012 / 0.021
Hemiodus unimaculatus 0.000 / 0.021 0.000 / 0.021
Hoplias macrophthalmus 0.128 / 0.303
Hoplias malabaricus / 0.094
Hydrolycus armatus / 0.028 / 0.156
Leporinus sp. “verde” 0.040 / 0.445 0.064 / 0.703
Lithodoras dorsalis / 0.005
Myleus rhomboidalis / 0.082 / 0.178
Myleus schomburgki / 0.026 / 0.030
Myleus torquatus 2.447 / 3.228 4.700 / 6.142
Pachyurus junki / 0.191 / 0.416
Phractocephalus hemiliopterus / 0.004
Pinirampus pirinampu 0.000 / 0.005
Plagioscion squamosissimus 3.377 / 5.061 8.430 / 12.64
Prochilodus nigricans 0.256 / 1.561 0.813 / 4.958
Semaprochilodus brama 0.303 / 0.071 0.630 / 0.148
Serrasalmus manueli / 0.010 / 0.026
Sorubim lima 0.036 / 0.590
Braz. J. Biol., 2015, vol. 75, no. 3 (suppl.), p. S112-S124 121 Biological parameters of fish species of the Xingu River
121 According to the records obtained from four ports in
Altamira, the mean total daily catch landed was 467.71 kg. Extrapolating from this value, average fishing yield (Y) would be 681.02 t.year-1, with a maximum sustainable yield (MSY) of 1,021.5 t.year-1. Overall, then, a total yield of 2,043 t.year-1 and a fish biomass of 21.69 kg.ha-1 would be expected for the study area.
Applying Kolding’s (1994b) equation, an actual fishing biomass value (Bc) of 39.5 kg.ha-1 and an actual yield of 1,051.1 t.year-1 were calculated (see Table 4). Finally, using Backel’s method (1971) yield was calculated as 1,317.3 t.year-1. Based on the mean of these different estimates, total average biomass within the study area would be of the order of 27.53±9.2 kg.ha-1, with a total yield of 26.02 kg.ha-1.year-1
4. Discussion
Knowledge of fish life histories, especially growth patterns and sexual maturation, is an essential tool for the sustainable management of harvested populations (Froese and Pauly, 1999). Based on the biological parameters estimated for the fishes of the study area on the middle Xingu, there was a clear predominance of r strategist species, characterised by high growth rates (K) and high natural mortality (M), closely associated with early sexual maturation and reduced longevity. These attributes of the populations of the study species favor the rapid replacement of generations (Lowe-McConnell, 1979; Payne, 1986). As the natural mortality (M) of fishes in tropical regions is much higher than those of temperate waters, their
fecundity and recruitment rates must increase in order to compensate for these losses (Longhurst and Pauly, 1987).
A second pattern recorded in the present study was a predominance of fishes with low to intermediate consumption by biomass (Q/B), which is a characteristic of predators or generalists, in particular opportunistic bottom feeders that supplement their diet with foods available in the flooded forest. This confirms the importance of benthic invertebrates in the food web of the middle Xingu, where they provide the principal source of nutrients for many fish species (Camargo, 2009).
The r strategy includes a short life cycle and high feeding plasticity, and can be interpreted as an adaptation to the considerable seasonal fluctuations in the number and quality of resources in the fluvial environment. This strategy (MacArthur and Wilson, 1967; Pianka, 1970) permits the rapid recolonisation of habitats in a continuously changing environment. The predominance of fast-growing species (K year-1), identified in the present study, is typical of the river systems of the lower Amazon basin (Ruffino and Isaac, 1995).
The mean size at first sexual maturation (Lm) of the species recorded in the present study tended to be relatively small (20-25 cm). This upholds Pauly’s (1994) theory, which predicts that fishes in warmer tropical environments tend to be relatively small, with high metabolic rates, consuming more food per unit of biomass. It is also important to note the influence of the aquatic habitat on the trophic structure of the fish communities of the study area, which appears comparable to that of the smaller watercourses in other
Table 4. Estimates of actual biomass (Bc) based on the annual yield and fish mortality of commercial importance fish, using
the Kolding equation (Kolding, 1994b).
Species Z M F Yield
(ton. year-1)
Bc Total
(ton. ha-1)
Bc
(ton. ha-1)
Ageneiosus inermis 1.61 0.57 1.04 65.09 62.59 0
Argonectes robertsi 1.18 0.99 0.19 18.2 95.79 0
Brachyplatystoma filamentosum 1.02 0.51 0.51 55.33 108.49 0
Cichla melaniae 2.08 0.97 1.11 207.22 186.68 0
Geophagus altifrons 1.91 1.68 0.23 30.68 133.37 0
Hemiodus unimaculatus 3.25 1.44 1.81 25.27 13.96 0
Hydrolycus armatus 0.58 0.39 0.19 11.72 61.69 0
Myleus setiger 1.73 1.38 0.35 112.81 322.3 0
Myleus rhomboidalis 1.51 1.05 0.46 35.06 76.23 0
Myleus schomburgki 2.89 1.17 1.72 8.37 4.87 0
Myleus torquatus 1.71 0.97 0.74 53.43 72.2 0
Pachyurus junki 1.5 1.33 0.17 21.15 124.4 0
Phractocephalus hemiliopterus 0.85 0.43 0.42 13.72 32.67 0
Plagioscion squamosissimus 1.31 0.84 0.47 150.36 319.91 0
Prochilodus nigricans 1.03 0.77 0.26 55.65 214.04 0
Semaprochilodus brama 1.57 0.71 0.86 101.56 118.1 0
Serrasalmus manueli 1.25 1.18 0.07 14.56 208 0
Tometes sp. “Xingu” 1.16 0.98 0.18 70.98 394.33 0.01
Total 1051.15 0.039
Braz. J. Biol., 2015, vol. 75, no. 3 (suppl.), p. S112-S124 122
Camargo, M., Giarrizzo, T. and Isaac, VJ.
122
parts of the Amazon basin, in which the majority of the biomass is made up of generalist species (Knöppel, 1970; Saul, 1975). The fact that the Xingu is a wide, but relatively shallow river implies that it encompasses a reduced number of feeding niches (Angermeier and Karr, 1983), which supports the hypothesis of Camargo (2009), who concluded that the middle Xingu is an unstable environment, with highly dynamic food webs.
Overall, r strategists were more common than K strategists in the middle Xingu River. This predominance of r strategists implies that the resident populations are relatively resilient, potentially being able to respond more effectively to modifications in the aquatic environment (Camargo, 2009).
A review of population parameters such as the biomass, production, and yield of the fish populations of a number of different tropical river systems, indicates variations in these factors in response to those of the physical characteristics of the system or fluctuations in the natural mortality of the species (see Table 4). The ease of dispersal in lotic systems hampers the collection of reliable estimates of demographic parameters and consistent comparisons with the results of studies conducted in out in lakes or flooded areas where the animals are partially confined (Lowe-McConnell, 1984). A more accurate estimate of biomass may have been obtained on the Niger River (Nigeria), when a 18 ha area of the river was confined between two dams. In this case, 80 fish species were recorded, with a total biomass of 1,069 kg or 60 kg.ha-1 (Motwani and Kanwai apud Lowe McConnell, 1987).
In the specific case of the Xingu River, of the methodological approaches applied to the calculation of the system biomass and yield, greater variation was found in the estimates obtained using Cadima’s equation. These analyses provided the first estimates of mean biomass and annual yields for a clear-water Amazonian river.
Based on the conservative value of fishing potential presented by Welcomme (1993) for black water rivers (11-19 kg.ha-1.year-1), a potential fishing yield of 1,564 to 2,702 t.year-1 of fish can be estimated for the study area. Based on catches landed in the region, Camargo et al. (2009) estimated that a total of approximately 3,006 t of fish is produced annually, around 10% higher than the estimated in the present study. It thus seems likely that this yield would be reduced considerably by the flooding of the Belo Monte dam.
A simulation of the possible alterations to the natural hydrological regime of the river indicates major impacts on the vegetation associated with the rocky outcrops and the areas of fluvial forest. The reduction in these habitats, which are dependent on the annual flood pulse, would likely result in a drastic reduction in the abundance of commercially-important frugivores, such as pacus (Serrasalmidae), and large-body detritivores like the curimatã and ariduia (Prochilodontidae), leading to major changes in the composition of local catches (Camargo et al., 2009).
The main change recorded in the fish fauna of the Tocantins River following the flooding of the Tucuruí reservoir was a proliferation of medium-sized predators, such as serrasalmids and cichlids, in particular the peacock bass, Cichla sp. (Merona et al., 2010).
Based on the annual catches recorded in eight rivers in the Brazilian state of Amazonas, Petrere (1985) concluded that the production of Amazonian rivers is not homogeneous, and cannot necessarily be predicted by their water chemistry. In particular, nutrient-poor environments surrounded by relatively productive habitats, such as igapó swamps may have increased biological yield (Irmler, 1978).
The mean biomass observed in the present study is lower than that recorded by Welcomme (1985) for the Magdalena River and by Bayley (1983) for the Amazon.
The most obvious effect of dam construction on the fish fauna of a river is the extinction of local populations, both within the reservoir itself and downstream from it. Data from the Tucuruí reservoir indicate an overall loss of approximately 25% of the original complement of species due to the interruption of migration routes (Merona et al., 2010). Other examples include the Brokopondo reservoir on the Suriname River, where only 41 of the original 172 species survived the damming of the river (Mol et al., 2007), and the Sinnamary reservoir in French Guiana, where the pattern was similar to that recorded at Tucuruí (Mérona, 2002; Mérona et al., 2005). Of 67 fish species studied for the middle Xingu river 22 (33%) were categorised as migratory or perform movements of displacement and recolonisation of habitat. The results from these studies indicate that the Belo Monte dam will affect primarily the biomass of frugivores and migrant species in the middle Xingu (Camargo, 2009).
Overall, then, the results of the present study indicated a predominance of r strategist species in the fish stocks of the middle Xingu River, which are adapted to the continual changes in river conditions occurring over the course of the annual flood pulse. The values recorded for the Q/B relationships of the fish species also indicated a predominance of small-bodied generalist-predators, typically associated with relatively shallow, clear water rivers, subject to continual seasonal fluctuations. It seems likely that the flooding of the Belo Monte reservoir will result in the extinction of some fish species from the main channel of the Xingu River, while the stocks of other species better adapted to calm water environments, such as serrasalmids and cichlids (e.g., Cichla sp.), will increase.
Acknowledgements
Braz. J. Biol., 2015, vol. 75, no. 3 (suppl.), p. S112-S124 123 Biological parameters of fish species of the Xingu River
123
References
ALLEN, KR., 1971. Relation between production and biomass. Canadian Journal of Fisheries and Aquatic Sciences, vol. 28, p. 1573-1581.
ANGERMEIER, P. and KARR, J., 1983. Fish communities along environmental gradients in a system of tropical streams. environmental. Environmental Biology of Fishes, vol. 9, no. 2, p. 117-135. http://dx.doi.org/10.1007/BF00690857.
BACKIEL, T. and WELCOMME, RL., 1980. Guidelines for sampling fish in inland waters. Rome: EIFAC/FAO. 176 p. EIFAC 1980 Technical Papers, no. 33.
BARTHEM, RB., RIBEIRO, M. and PETRERE, M., 1991. Life strategies of some long-distance migratory catfish in relation to hydroelectric dams in the Amazon basin. Biological Conservation, vol. 55, no. 3, p. 339-345. http://dx.doi.org/10.1016/0006-3207(91)90037-A.
BAYLEY, PB., 1983. Central Amazon fish populations: biomass, production and some dynamics characteristics. Halifax: Dalhousie University. 193 p. Doctoral thesis.
BAYLEY, PB., 1988. Factor affecting growth rates of young tropical floodplain fishes: seasonality and density-dependence. Environmental Biology of Fishes, vol. 21, no. 2, p. 127-142. http://dx.doi.org/10.1007/BF00004848.
BEVERTON, RJH. and HOLT, SJ., 1957. A review of the lifespans and mortality rates of fish in nature, and their relation to growth and other physiological characteristics. In WOHSTENHOLME, GE. and O’CONNER, M. (Eds.). The lifespan of animals. London: Churcill. vol. 5, p. 142-180.
BREY, T. and PAULY, D., 1986. Electronic length frequency analysis: a revised and expanded user’s guide to ELEFAN O, 1, and 2. Manila: International Center for Living Aquatic Resources Management. 49 p. ICLARM Contribution, no. 261.
CAMARGO, M. and LIMA JUNIOR, WA., 2005. Aspectos da biologia reprodutiva de seis espécies de peixes de importância comercial do médio Rio Xingu: bases para seu manejo. Revista Uakari, vol. 3, p. 64-77.
CAMARGO, M., GIARRIZZO, T. and ISAAC, V., 2004. Review of the Geographic distribution of fish fauna of the Xingu River basin, Brazil. Ecotropica, vol. 10, p. 123-147.
CAMARGO, M., GIMÊNES JÚNIOR, H. and RAPP PY-DANIEL, L., 2012. Acaris Ornamentais do Médio Rio Xingu. Belém: FAPESPA. 177 p.
CAMARGO, M., GONÇALVES, AP., CARNEIRO, CC. and CASTRO, GTN., 2009. Pesca de consumo. In CAMARGO, M., and GHILARDI JUNIOR, R. (Eds.). Entre a Terra, as águas e os pescadores do Médio rio Xingu: uma abordagem ecológica. Belém: Mauricio Camargo. p. 265-282.
CAMARGO, M., 2009. Teias alimentares e fluxos de energia. In CAMARGO, M. and GHILARDI JUNIOR, R. (Eds.). Entre a Terra, as águas e os pescadores do Médio rio Xingu: uma abordagem ecológica. Belém: Mauricio Camargo. p. 297-329.
FERREIRA, EJG., 1993. Composição, distribuição e aspectos ecológicos da ictiofauna de um trecho do rio Trombetas, na área de influência da futura UHE Cachoeira Porteira, Estado do Pará, Brasil. Acta Amazonica, vol. 23, p. 1-89.
FITTKAU, EJ., 1971. Ökologische Gliederung des Amazonasgebietes auf geochemischer Grundlage. Münster Forsh Geologische Paläontologische, vol. 20-21, p. 35-50.
FROESE, R. and BINOHLAN, C., 2000. Empirical relationships to estimate asymptotic length, length at first maturity and length at maximum yield per recruit in fishes, with a simple method to evaluate length frequency data. Journal of Fish Biology, vol. 56, no. 4, p. 758-773. http://dx.doi.org/10.1111/j.1095-8649.2000. tb00870.x.
FROESE, R. and PAULY, D., 1999. Fishbase 99: conceptos, estructura y fuentes de datos. Manila: ICLARM. 125 p.
FURCH, K., 1984. Water chemistry of the Amazon Basin: the distribution of chemical elements among freshwaters. In SIOLI, H. (Ed.). The Amazon Limnology and landscape ecologyof a mighty tropical river and its basin. Dordrecht: Dr. W. Junk Publishers. p. 167-169.
GAYANILO JUNIOR, FC., SPARRE, P. and PAULY, D., 1996. FAO-ICLARM Fish Stock Assessment (FiSAT) User’s Guide. Rome: FAO. p. 126-129. FAO Computerized Information Series (Fisheries), no. 7.
GULLAND, JA., 1983. Stock assessment: why? Rome: FAO. 18 p. FAO Fisheries Circular, no. 759.
International Sustainability Unit – ISU, 2012. Towards Global Sustainable Fisheries the opportunity for transition. London: The Prince’s Charities’ International Sustainability Unit. 45 p. Available from: <http://www.pcfisu.org/wp-content/uploads/2012/01/ ISUMarineprogramme-towards-global-sustainable-fisheries. pdf>. Access in: 5 May 2014.
IRMLER, U., 1978. Matas de inundação da Amazônia central em comparação entre águas brancas e pretas. Ciencia e Cultura, vol. 30, p. 813-821.
KLAMMER, G., 1984. The relief of the extra-Andean Amazon basin. In SIOLI, H. (Ed.). The Amazon Limnology and landscape ecology of a mighty tropical river and its basin. Dordrecht: Dr. W. Junk Publishers. p. 47-84.
KNÖPPEL, H., 1970. Food of central amazonian fishes: contribution to the nutrient-ecology of Amazonian rain-forest streams. Amazoniana, vol. 2, p. 257-352.
KOLDING, J., 1994a. On the ecology and exploitation of fish in fluctuating tropical freshwater systems. In KOLDING, J. Plus ça change, plus c’est la même chose. Bergen: Kolding University of Bergen. 191 p.
KOLDING, J., 1994b. Population ecology and simple potential yield estimators in fisheries: a review and a proposal. In KOLDING, J. Plus ça change, plus c’est la même chose. Bergen: Kolding University of Bergen. 191 p.
LONGHURST, A. and PAULY, D., 1987. Ecology of tropical oceans. London: Academic Press. 407 p.
LOWE-MCCONNELL, RH., 1979. Ecological aspects of seasonality in fishes of tropical waters. Symposia of the Zoological Society of London, vol. 44, p. 219-241.
LOWE-MCCONNELL, RH., 1984. The status of studies on South American freshwater food fishes. In ZARET, TM. (Ed.). Evolutionary ecology of neotropical freshwater fishes. Dordrecht: Springer Netherlands. p. 139-156.
Braz. J. Biol., 2015, vol. 75, no. 3 (suppl.), p. S112-S124 124
Camargo, M., Giarrizzo, T. and Isaac, VJ.
124
MACARTHUR, RH. and WILSON, E., 1967. The theory of island biogeography. Princeton: University Press. 224 p.
MCCARTNEY, M., 2009. Living with dams: managing the environmental impacts. Water Policy, vol. 11, supplement 1, p. 121-139.
MERONA, B., 1990. Amazon fisheries: general characteristics based on two case-studies. Interciencia, vol. 15, p. 461-468.
MÉRONA, B., 2002. Dynamique des peuplements de poissons dans le réservoir de Petit-Saut (Fleuve Sinnamary, Guyane française). Bulletin Francais de la Peche et de la Pisciculture, vol. 364, no. 364, p. 5-22. http://dx.doi.org/10.1051/kmae:2002001.
MÉRONA, B., JURAS, A., SANTOS, G. and CINTRA, I., 2010. Os peixes e a pesca no baixo Rio Tocantins: vinte anos depois da UHE Tucuruí. Brasília: Electrobras Eletronorte. 208 p. MÉRONA, B., VIGOUROUX, R. and TEJERINA-GARRO, F., 2005. Alteration of fish diversity downstream from petit-Saut dam in French Guiana. Implication of ecological strategies of fish species. Hydrobiologia, vol. 551, no. 1, p. 33-47. http://dx.doi. org/10.1007/s10750-005-4448-z.
MOL, JH., MÉRONA, B., OUBOTER, PE. and SAHDEW, S., 2007. The fish fauna of Brokopondo reservoir, Suriname, during 40 years of impoundment. Neotropical Ichthyology, vol. 5, no. 3, p. 351-368. http://dx.doi.org/10.1590/S1679-62252007000300015.
Norte Energia, 2013. Licenciamento da Hidrelétrica de Belo Monte; Plano de conservação dos ecossistemas aquáticos; Programa de conservação da ictiofauna. Brasília. Available from: <http://licenciamento.ibama.gov.br/Hidreletricas/Belo%20Monte/ Relatorios%20Semestrais/6º%20RC%20310714%20-%20PDF/ CAPÍTULO%202/13/13.3/13.3.5/CAP%202%20-%2013.3.5%20 -%206º%20RC.pdf>. Access in: 19 Oct. 2014.
PALOMARES, D. and PAULY, D., 1998. Predicting food consumption of fish populations as functions of mortality, food type, morphometrics, temperature and salinity. Marine & Freshwater Research, vol. 49, no. 5, p. 1-7. http://dx.doi.org/10.1071/MF98015. PAULY, D., 1980. A selection of simple methods for the assessment of tropical fish stocks. Rome: FAO. p. 1-54. FAO Fisheries Circular, no. 729.
PAULY, D., 1984. Fish populations dynamics in tropical waters: a manual for use with programmable calculators. Manila: ICLARM. 325 p. ICLARM Studies and Reviews, no. 8.
PAULY, D., 1994. On the sex of fish and the gender of scientists: a collection of essays in fisheries science. London: Chapman and Hall. 250 p.
PAYNE, A., 1986. The ecology of tropical lakes and rivers. Chichester: John Wiley Sons. 126 p.
PETRERE, M. and ABUABARA, MA., 1996. A simple deterministic model for calculating the total mortality (Z) of fish populations in floodplain lakes without any information about growth parameters. Fisheries Management and Ecology, vol. 3, no. 1, p. 93-95. http:// dx.doi.org/10.1111/j.1365-2400.1996.tb00132.x.
PETRERE, M., 1983. Yield per recruit of the tambaqui Colossoma macropomum Cuvier, in the Amazon State, Brazil. Journal of Fish Biology, vol. 22, no. 2, p. 133-144. http://dx.doi. org/10.1111/j.1095-8649.1983.tb04733.x.
PETRERE, M., 1985. A pesca comercial no Rio Solimões – Amazonas e seus afluentes: análise dos informes do pescado desembarcado no Mercado Municipal de Manaus (1976-1978). Ciencia e Cultura, vol. 37, p. 1987-1999.
PIANKA, ER., 1970. On r and k selection. American Naturalist, vol. 106, no. 651, p. 592-597. http://dx.doi.org/10.1086/282697.
RUFFINO, ML. and ISAAC, V., 1995. Life cycle and biological parameters of several Brazilian Amazon fish species. Naga, vol. 18, p. 41-45.
RUFFINO, ML. and ISAAC, V., 2000. A pesca artesanal no Médio Amazonas. Brasília: IBAMA. p. 317-348. Coleção Meio Ambiente. Série Estudos Pesca, no. 22.
SAUL, G., 1975. An ecological study of fishes at a site in upper Amazonian Ecuador. Proceedings. Academy of Natural Sciences of Philadelphia, vol. 127, p. 93-134.
SPARRE, P. and VENEMA, SC., 1992. Introduction to tropical fish stock assessment, Parte 1. Introduction to tropical fish stock assessment. Rome: FAO. 376 p. FAO Fisheries Technical Paper.
WELCOMME, R., 1985. River fisheries. Rome: FAO. 333 p. FAO Fisheries Technical Paper, no. 262.
WELCOMME, R., 1993. A history of international introductions on inland aquatic species. Rome: FAO. 318 p. FAO Fisheries Technical Paper, no. 294.