ISSN 2179-8087 (online)
Original Article
Silviculture
Creative Commons License. All the contents of this journal, except where otherwise noted, is licensed under a Creative Commons Attribution License.
Efficiency of Biological Utilization of Micronutrients by Forests
Species in Hypoxerophytic Caatinga
Alcienia Silva Albuquerque
1
, Fernando José Freire
1
,
Mozart Duarte Barbosa
2
, Luiz Carlos Marangon
1
,
Ana Licia Patriota Feliciano
1
1Universidade Federal Rural de Pernambuco – UFRPE, Recife/PE, Brasil 2Autarquia de Ensino superior de Arcoverde – AESA, Arcoverde/PE, Brasil
ABSTRACT
The study aimed to estimate the concentrations and efficiency of biological utilization of Cu, Fe, Zn, and Mn and the leaf biomass of ten species in a hypoxerophytic Caatinga fragment, aiming to contribute to a more adequate choice of species for reforestation programs in the Brazilian Caatinga. The leaves of three trees of each species were sampled and the concentration of micronutrients was determined, estimating their content and efficiency of biological utilization. The efficiency of biological utilization followed the decreasing order: Mn > Cu > Zn > Fe.
Jatropha mollissima and Spondias tuberosa were less efficient in the use of Fe and Senegalia paniculata and Croton blanchetianus, in the use of Zn. However, Piptadenia stipulacea and Mimosa ophthalmocentra were very efficient in using Fe and Mn. The nutritional efficiency of the species can serve as a criterion for choice of species in forest restoration programs.
1. INTRODUCTION
The relationships between vegetation and soil in hypoxerophytic Caatinga are more dynamic due to the addition of residues from the livestock activity to the environment and due to greater water availability from small intermittent streams (Deusdará et al., 2017). Seasonal dry and humid periods in these environments are typical and often responsible for variations in soil attributes and plant nutrition. Forest nutrition, for example, is intensified in the winter and restrained in the summer due to the greater and lesser water availability, respectively, and due to the contribution of organic matter from grazing. Thus, the winter season allows a higher N cycling and promotes the growth of exuberant vegetation with high biomass production. Such vegetation requires a greater amount of nutrients from the soil.
The soils of hypoxerophytic Caatinga are deeper and more fertile due to the higher humidity of the environment. However, they are low acid, neutral or alkaline soils, because of a low removal of basic cations such as Ca, Mg and K. Nutrient availability is influenced mainly by soil pH, and the cationic micronutrients Cu, Fe, Zn, and Mn have their availability particularly reduced when the soil is low acid, tending to neutral or alkaline (Biondi et al., 2011). This low availability of micronutrients in the soil can limit the development of plant species and, consequently, interfere in the biomass production and even in the natural regeneration of species in the Caatinga.
Studies on plant nutrition in the Caatinga are still very scarce, and works specifically involving micronutrients are practically non-existent, especially when the objective is to quantify the content and nutritional efficiency of these nutrients in a biome. However, these micronutrients may be responsible for a considerable part of the performance of the species, especially in hypoxerophytic Caatinga areas used for semi-intensive livestock farming.
Nutrient concentrations in leaves are used to diagnose the plant nutritional status because of their correlation with plant growth (Fontes et al., 2013). These correlations provide information about threshold concentrations which are “critical levels” that separate the appropriate from the toxic levels of the nutrients in the plants (Fontes, 2014).
Determining the nutritional concentration is important to diagnose the surrounding natural environment, to serve as a reference parameter for the management of plants of the same species with nutritional deficiencies, to act as a subsidy for recovery of degraded areas through soil correction, as well as for the adoption of reforestation programs with native forest species (Medeiros et al., 2008).
Biological utilization efficiency is a coefficient that indicates the amount of dry matter of a vegetative part of a plant produced per unit of nutrient accumulated in that component (Bündchen et al., 2013). Biological utilization efficiency is a measure of nutritional efficiency of a plant in the use of the absorbed and accumulated nutrient (Fontes et al., 2013).
The nutritional efficiency of tree species is conceptualized in several ways in the literature; however, the most common components of efficiency are absorption and utilization of nutrients (Santos et al., 2008). Fontes et al. (2013) affirmed that an efficient species, from the nutritional point of view, is the one capable of synthesizing the maximum biomass per unit of absorbed nutrient. The amount of nutrients contained in the plant, in turn, can predict the capacity of the species to store nutrients, defining their contribution to the equilibrium of the ecosystem (Espig et al., 2008).
This study aimed to determine the concentrations of Cu, Fe, Zn, and Mn, estimate the leaf biomass, and calculate the efficiency of use of the nutrients in ten species of great importance value in a hypoxerophytic Caatinga fragment, aiming to contribute to a more adequate choice of species in reforestation programs in the Caatinga in Brazil.
2. MATERIAL AND METHODS
out is formed by subdeciduous and deciduous forests, typical of the Agreste zone of Brazil (Beltrão et al., 2005). The study area presents a climate of the Bshs type according to Köppen’s classification (Alvares et al., 2013). It is a dry area with low latitude steppe, autumn-winter rains, and average temperatures varying from minimum of 12 °C to a maximum of 25 °C, and average annual rainfall of 1,000 mm (Beltrão et al., 2005). During this study, the rainfall was of 1,037.5 mm, with a monthly average of 86.46 mm in winter.
The studied fragment has hypoxerophytic Caatinga vegetation whose last deforestation occurred in 1949. It is currently intended for cattle grazing in a semi-extensive regime as the majority of the Caatinga forest fragments of the region (Barbosa et al., 2012). The soil of the fragment is classified as Red Yellow Argisol (Santos et al., 2013), corresponding to Ultisol (Soil Survey Staff, 2014).
Phytosociological studies usually survey horizontal and vertical structures, but only the horizontal structure was used in the present work, defining the ten species of greatest importance value (IV). A systematic sampling was made using the fixed plot method, where plots were placed in parallel transects; the transects were10 m apart from each other, and the sample units in the same transect were 25 m apart from each other. The phytosociological study was conducted in an area of 1.0 ha distributed in 40 plots of 10 x 25 m (Barbosa et al., 2012), considering an edge effect of 20 m.
The ten species with highest IV in the fragment were determined (Table 1), and their leaf biomass was estimated using allometric equations, considering the diameter at breast height (DBH) as dependent variable,
according to Silva & Sampaio (2008). The following Equation 1 was used to estimate leaf biomass (kg plant-1)
of the tree species:
Ŷ = 0.0681 x DBH 1.5829 (1)
Where Ŷ is the leaf biomass (kg); 0.0681 is a model parameter; DBH is the diameter at breast height at 1.30 m from the ground (cm); and 1.5829 is a model parameter.
The following Equation 2 was used for the shrub species:
Ŷ = 0. 1900 x DBH 2.0515 (2)
Where Ŷ is the leaf biomass (kg); 0.1900 is a model parameter; DBH is the diameter at breast height at 1.30 m from the ground (cm); and 2.0515 is a model parameter.
The average leaf biomass of each species (kg plant-1)
was estimated using the mean DBH. The DBH of all individuals of each species were summed and divided by the number of individuals of the species to obtain the mean DBH per species. The biomass was multiplied by the number of individuals of the species to estimate the biomass of each species per unit of area (kg ha-1).
The total leaf biomass of the area was estimated through the sum of the biomass of all species with highest IV (Espig et al., 2008).
Leaves were sampled in the rainy season. Newly mature leaves were collected from the medium third of the crown of the ten species with highest IV in the fragment (Table 2). Twenty-five leaves were randomly collected per species, at the four cardinal points of each plant. Three specimens of each species were sampled in the
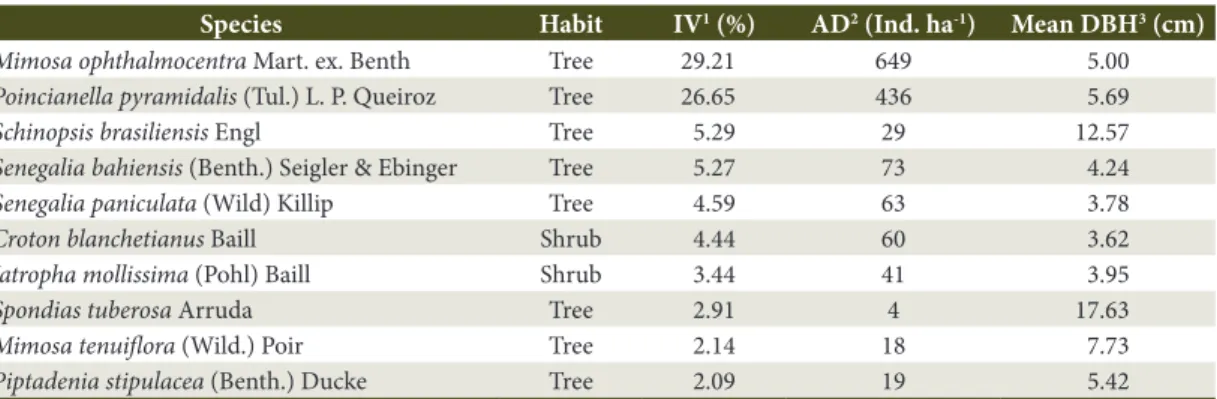
Table 1. Species of greatest importance value (IV) in a hypoxerophytic Caatinga fragment.
Species Habit IV1 (%) AD2 (Ind. ha-1) Mean DBH3 (cm)
Mimosa ophthalmocentra Mart. ex. Benth Tree 29.21 649 5.00
Poincianella pyramidalis (Tul.) L. P. Queiroz Tree 26.65 436 5.69
Schinopsis brasiliensis Engl Tree 5.29 29 12.57
Senegalia bahiensis (Benth.) Seigler & Ebinger Tree 5.27 73 4.24
Senegalia paniculata (Wild) Killip Tree 4.59 63 3.78
Croton blanchetianus Baill Shrub 4.44 60 3.62
Jatropha mollissima (Pohl) Baill Shrub 3.44 41 3.95
Spondias tuberosa Arruda Tree 2.91 4 17.63
Mimosa tenuiflora (Wild.) Poir Tree 2.14 18 7.73
Piptadenia stipulacea (Benth.) Ducke Tree 2.09 19 5.42
fragment, and the selection criterion for repetition was the similarity in size and vegetative development of the species sampled. Afterwards, the collected leaves were packed in paper bags and stored in styrofoam boxes, and then taken to a forced air circulation chamber at 65 °C until a constant weight was reached.
Nitric-perchloric digestion was carried out in the leaves to extract and to determine Cu, Fe, Zn, and Mn by atomic absorption spectrophotometry (EMBRAPA, 2009).
Nutrient content in the leaf biomass of the species (kg ha-1) was determined by multiplying the nutrient
concentration (mg kg-1) by the dry leaf biomass of
each species.
The efficiency of biological utilization of each nutrient in each of the ten species with highest IV was calculated by the ratio between their leaf biomass and the nutrient content accumulated in that biomass (Espig et al., 2008).
The concentrations, contents, and utilization efficiencies of Cu, Fe, Zn, and Mn were analyzed through analysis of variance (ANOVA) and post hoc mean comparisons using the Scott–Knott test at 5% probability, with significant results at 5% probability level. When the coefficients of variation (CV) were greater than 30%, the data were transformed using √x as transformation model.
3. RESULTS AND DISCUSSION
Leaf biomass estimates in this research were performed according to Silva & Sampaio (2008), who selected nine native Caatinga species to establish
models and allometric equations based on their DBH. Three of the species selected by the authors also occurredamong the ten that had the highest IV in the present study, specifically two shrub species (Croton blanchetianus and Jatropha mollissima); one tree species (Poincianella pyramidalis); and two tree genera (Mimosa and Schinopsis) (Table 2).
The leaf biomass of each studied species ranged from 0.6 to 6.4 kg plant-1. Spondias tuberosa was the
most representative species in terms of leaf biomass, followed by the tree species Schinopsis brasiliensis and the shrubs Jatropha mollissima and Croton blanchetianus. The species that presented the lowest leaf biomass were the trees Senegalia paniculata, Senegalia bahiensis, and
Mimosa ophthalmocentra (Table 2).
The leaf biomass per hectare of the studied species ranged from 18.8 to 564.7 kg ha-1 to 1,588.6 kg ha-1
(Table 2). Alves et al. (2017) evaluated the leaf biomass of five species with the highest IV in Floresta, Pernambuco, Brazil, and found values of 1,800 ± 1,100 kg ha-1
in regenerated areas and 4,500 ± 2,100 kg ha-1 in a
preserved area in the Caatinga. Therefore, the impacts of anthropization and/or degradation are evident in this studied fragment despite decades elapsed of preservation.
The tree species Mimosa ophthalmocentra showed a high leaf biomass value as a result of the high number of individuals in the studied fragment (Table 1). On the other hand, the tree species Piptadenia stipulacea had the lowest of leaf biomass value per area (Table 2) because, although it was not the least abundant species in the fragment, it had a low DBH (Table 1).
Table 2. Leaf biomass of the species of greatest importance value (IV) per individual and area in a hypoxerophytic
Caatinga fragment.
Species Leaf biomass per individual (kg plant-1) Leaf biomass per area (kg ha-1)
Mimosa ophthalmocentra 0.9 564.7
Poincianella pyramidalis 1.1 465.5
Schinopsis brasiliensis 3.7 108.6
Senegalia bahiensis 0.7 48.9
Senegalia paniculata 0.6 35.2
Croton blanchetianus 2.7 159.6
Jatropha mollissima 3.2 130.5
Spondias tuberosa 6.4 25.6
Mimosa tenuiflora 1.7 31.2
Piptadenia stipulacea 1.0 18.8
The species that had the highest biomass per area were Mimosa ophthalmocentra, Poincianella pyramidalis,
Croton blanchetianus, Jatropha mollissima and
Schinopsis brasilienses (Table 2). Poincianella pyramidalis
and Mimosa ophthalmocetra are species that have a great resistance to drought and good ability to compete for light. This justifies their large number of individuals (Table 1) and, consequently, greater biomass in relation to the other species with the highest IV in the fragment (Table 2).
There was a high biomass variation between species, what can be attributed to the physiological and morphological characteristics of the individuals, age of the stands, soil fertility, disturbances, and management adopted in the area. Additionally, Njana (2016) cited soil type, climate, topography, natural regeneration, and human impact as factors that may also influence biomass in tropical forests. Medeiros et al. (2008) also found variation in plant shoot biomass in the Caatinga. Barbosa et al. (2012) added that variation of environmental factors, such as hydrology, can also influence the aerial biomass of forest species, corroborating Moura et al. (2016) who affirmed that the total biomass in Caatinga areas is mainly a function of water availability.
The leaf biomass estimates of Mimosa ophthalmocentra
and Jatropha molissima were higher than those found by Alves et al. (2017) in a regenerating Caatinga area for these same species. This allows us to infer that
although this fragment has traces of degradation, it is in an advanced state of regeneration due to the long time without anthropic interference and also for the the best local edaphoclimatic conditions when compared to the area where Alves et al. (2017) carried out their research.
The environment of the present site of study is more humid and the Caatinga was hypoxerophytic, while the environment in Floresta is drier and the Caatinga is hyperxerophytic. Moreover, the fragment studied in the present research has a soil that offers a greater contribution of N, which has a concentration of 76.94 g kg-1 (Barbosa et al., 2012), while the soil in the
preserved fragment studied by Alves et al. (2017) in the rainy season presented N concentrations ranging from 3.1 to 18.6 g kg-1. This higher contribution of N in the
present study may have resulted from the semi-extensive livestock activity practiced in the area, because this sort of activity favors the growth and development of species. The regeneration in this environment is likely to be faster than in hyperxerophytic Caatinga areas without additional contribution of N.
The concentrations of Fe, Zn, and Mn in the leaves of the species varied among the species, while concentrations of Cu did not depend on the species (Table 3).
Table 3. Copper, Iron, Zinc, and Manganese concentrations in the leaves of species of highest importance value (IV)
in a hypoxerophytic Caatinga fragment.
Species Cu ___________________________Fe Zn Mn
mg kg-1____________________________
Mimosa ophthalmocentra 15.80 93.68 b 24.22 b 12.35 c
Poincianella pyramidalis 22.92 112.48 b 28.67 b 10.77 c
Schinopsis brasiliensis 15.82 96.60 b 29.38 b 19.15 b
Senegalia bahiensis 15.22 98.53 b 22.20 b 12.35 c
Senegalia paniculata 17.37 117.45 b 84.03 a 20.28 b
Croton blanchetianus 17.62 106.05 b 102.47 a 40.88 a
Jatropha mollissima 15.62 558.20 a 35.22 b 23.82 b
Spondias tuberosa 14.85 199.05 b 26.90 b 17.35 b
Mimosa tenuiflora 13.25 110.07 b 30.72 b 11.38 c
Piptadenia stipulacea 13.42 111.27 b 38.63 b 7.15 c
Average 16.20 160.34 43.24 17.55
Fcalculated 1.16ns 4.91** 4.30** 12.95***
CV (%)1 27.42 25.28 21.22 26.50
1Coefficient of variation = Standard deviation/Average x 100. Averages followed by equal letters in the columns do not differ from
each other at 5% probability level by the Scott-Knott’s test. ** and *** Significant at 1 and 0.1% probability by the F test, respectively.
The nutrient concentrations in the leaf biomass of the species studied had the following decreasing order: Fe > Zn > M n> Cu (Table 3).
Fe was the micronutrient with the highest concentration in the species with highest IV, with an average value of 160.34 mg kg-1 (Table 3). This shows
that the plants have had a good absorption of this nutrient, as it is natural in well-developed soils such as the Argisol in the studied area, where the available levels of Fe are higher than those of other micronutrients. In their natural evolution, these soils concentrate large amounts of Fe oxides.
The highest Fe concentration was found in
Jatropha mollissima (Table 3). Species may have different nutrient concentrations in the leaves for two reasons: they may be more efficient in absorbing certain nutrients that are required in their metabolism; or they can concentrate in the leaves a greater amount of the nutrient, as a result of lower biomass production in some species that leads them to concentrate the nutrient (Alves et al., 2017).
In the case of Fe concentration in this study, there were differences between the species justified by the two reasons. Jatropha mollissima had a smaller individual leaf biomass than Spondia tuberosa and
Schinopsis brasiliensis (Table 2), causing differences between these two species; Fe was more concentrated in Jatropha mollissima due to its smaller biomass. On the other hand, this species produced more biomass at individual level than the other species (Table 2), and despite of it, Fe concentrations were higher in
Jatropha mollissima (Table 3). This species likely has a high demand for Fe and, therefore, absorbs more of this micronutrient than the other species.
Zn concentration was of 43.24 mg kg-1, higher than
those of Mn and Cu (Table 3). It has been reported that high levels of P induce Zn deficiency (Muner et al., 2011), but in the present work this behavior was not observed. Barbosa et al. (2012) also found high levels of P in the same plants.
The difference of Zn and Fe concentration of between the species may have been due to the concentration effect and greater nutrient absorption capacity. Senegalia paniculata was one of the species that produced less biomass at individual level (Table 2) and the absorbed Zn was therefore concentrated in such biomass. As a result, Zn concentrations in this
species were higher than those of all the other species but Croton blanchetianus (Table 3). Although the latter species produced 4.5 times more biomass than
Senegalia paniculata (Table 2), their Zn concentrations did not differ statistically (Table 3). This suggests a high demand for Zn in Croton blanchetianus.
Mn concentrations in differed from one species to the other to greater extents than Fe and Zn concentrations (Table 3). In this case, the results were due to different demands rather than concentration or dilution effects. Croton blanchetianus demanded more Mn than the other species, similar to the observed for Zn concentrations (Table 3).
We can conclude that Jatropha mollissima had high demand for Fe, and Croton blanchetianus for Zn and Mn. Thus, environments poor in Fe may compromise the regeneration, growth, and development of Jatropha mollissima. Similarly, environments that are poor in Zn and Mn may restrict the development of Croton blanchetianus.
Brun et al. (2012) found variations in nutrient concentrations in the leaves of native species from Rio Grande do Sul. Medeiros et al. (2008) also observed variations in Mn concentrations in Tabebuia serratifolia,
Aspidosperma pylifolium, Tabebuia cariíba, and
Astronium urundeuva, finding higher concentrations in the leaves than in the branches. Corcioli et al. (2016) affirmed that under good conditions of Mn supply, leaves accumulate high amounts of Mn according to the age of the plant.
There were no significant differences in Cu concentration between species. Corcioli et al. (2016) reported that plants rarely exhibit Cu deficiency due to adequate availability of the element in the majority of soils. The authors also added that nutrient deficiency is difficult to diagnose due to the interference of other elements such as Fe and Zn.
In more restrictive contexts, species tend to present a greater absorption capacity, optimizing the available nutrients. According to some authors, nutrient concentrations of species growing when in the same site may indicate their nutritional demands (Bündchen et al., 2013). High levels of nutrients found in plants seem to be a matter of nutritional needs, but Nunes et al. (2013) say that they are the result of a higher absorption efficiency of the species, especially in nutrient-poor sites.
The adequate levels may have been related to the soil pH of the fragment, which promoted greater availability and consequently greater absorption of micronutrients, leading to a differentiation between species based on their ability to absorb and accumulate them. Among the factors that affect the nutrient availability in the soil, pH is one of the most important (Nachtigall et al., 2009).
The average contents of Cu, Fe, Zn, and Mn in the species were 34.51; 432.69; 88.03; and 43.58 mg plant-1,
respectively, and obeyed the following decreasing order: Fe > Zn > Mn > Cu (Table 4).
The species Spondias tuberosa presented higher contents in of Cu, Fe, and Mn than the other species. Jatropha mollissima presented the highest Fe content, while Zn and Mn contents were highest in Croton blanchetianus (Table 4). This difference can be attributed to the high individual biomass production of Spondias tuberosa and Croton blanchetianus (Table 2). In the case of Jatropha mollissima,
is the result was due to the high Fe concentration found in the species (Table 3).
As for the contents of Cu, Fe, Zn, and Mn in the species per area, average values of 2.85; 22.51; 6.32; 2.59 g ha-1,
Table 4. Content of Copper, Iron, Zinc, and Manganese by species (mg plant-1) and area (g ha-1) in the leaves of the species of greatest importance value (IV) in a hypoxerophytic Caatinga fragment.
Species Cu _________________________Fe Zn Mn
mg plant-1________________________
Mimosa ophthalmocentra 13.75 c 81.51 b 29.77 c 10.74 c
Poincianella pyramidalis 24.47 c 120.08 b 30.60 c 11.49 c
Schinopsis brasiliensis 59.21 b 361.63 b 110.00 c 71.70 b
Senegalia bahiensis 10.20 c 66.04 b 14.88 c 8.28 c
Senegalia paniculata 9.70 c 65.63 b 46.96 c 11.33 c
Croton blanchetianus 46.87 b 282.13 b 272.60 a 108.76 a
Jatropha mollissima 49.69 b 1776.08 a 112.05 c 75.78 b
Spondias tuberosa 94.97 a 1272.92 a 172.03 b 110.95 a
Mimosa tenuiflora 22.98 c 190.85 b 53.26 c 19.74 c
Piptadenia stipulacea 13.28 c 109.99 b 38.19 c 70.07 c
Average 34.51 432.69 88.03 43.58
F calculated 10.43*** 4.86 *** 7.78*** 18.60***
CV (%)1 17.19 36.34 21.78 16.18
__________________________g ha-1_________________________
Mimosa ophthalmocentra 8.92 a 52.90 a 19.32 a 6.98 a
Poincianella pyramidalis 10.67 a 52.36 a 13.34 a 5.01 a
Schinopsis brasiliensis 1.72 b 10.49 b 3.19 b 2.08 c
Senegalia bahiensis 0.74 b 4.82 b 1.08 b 0.60 d
Senegalia paniculata 0.61 b 4.14 b 2.96 b 0.71 d
Croton blanchetianus 2.81 b 16.93 b 16.35 a 6.52 a
Jatropha mollissima 2.04 b 72.82 a 4.59 b 3.10 c
Spondias tuberosa 0.38 b 5.09 b 0.69 b 0.44 d
Mimosa tenuiflora 0.41 b 3.43 b 0.96 b 0.35 d
Piptadenia stipulacea 0.25 b 2.09 b 0.73 b 0.40 d
Average 2.85 22.51 6.32 2.59
Fcalculated 27.94*** 12.79*** 17.68*** 26.39***
CV (%) 16.71 22.48 20.85 34.72
1Coefficient of variation = Standard deviation/Average x 100. Averages followed by equal letters in the columns do not differ from
respectively, were found (Table 4) and obeyed the following decreasing order: Fe > Zn > Cu > Mn. Even though the concentration of Cu was lower than that of Mn, on average (Table 4), the amount of Cu stored in the leaf biomass of the species was higher than that of Mn (Table 4). It was observed that species with a higher biomass production per area (Table 2) had higher concentrations of Cu than of Mn (Table 3), and since the content per area is the product of the concentration and the biomass, this inversion can occur, especially when evaluating many species.
Fe content was the highest of the evaluated micronutrients, ranging from 2.09 to 72.82 g ha-1 with
an average of 22.51 g ha-1 in the species in the studied
fragment (Table 4).
The amount of nutrients stored per area dependents on the total biomass produced by the species. Mimosa ophthalmocentra and Poincianella pyramidalis presented the highest Cu, Fe, Zn, and Mn contents (Table 4). Although they were not the species with the highest concentration of these nutrients (Table 3), they were the ones that most produced leaf biomass per area in the fragment (Table 2). Thus, if a species presents a great stock of a nutrient, it does not mean that the species necessarily has a great demand for that nutrient.
The need of a nutrient is more related to its concentration than to its content in the species, provided that the effects of concentration and dilution are properly considered. For example, Jatropha molíssima stocked more Fe than Croton blanchetianus per area (Table 4). In this case, the Fe stock in the leaves did not depend on the biomass produced because Croton blanchetianus
produced more biomass per area than Jatropha molíssima
(Table 2). Fe concentration in this species was so high (Table 3) that exceeded the low biomass production, which confirms its high demand for Fe.
Information about the compartmentalization of nutrient content in the species is used in planted forests to assist in the proper planning of fertilization through the prognosis of exported nutrients during the removal of commercial compartments (Espig et al., 2008).
The nutrient contents of forest species are in line with the support capacity of the plants, which contributes to the balance of the ecosystem. of the nutrients stored are returned to the sites through nutrient cycling, thus fertilizing the forest environments.
The efficiency of biological utilization of the nutrients Fe, Zn, and Mn differed among the species (Table 5). Although the efficiency of biological utilization of Cu ranged from 47.77 to 89.63 kg g-1, there was no
statistical difference between species. This variation in efficiency between species may be related to fertility and nutrient availability in the soil, or even to a specific characteristic of the species.
Fe was the nutrient used by the species with lowest efficiency, and Mn was the one used with the greatest efficiency. In other words, most of the biomass produced in the Caatinga contained low amounts of Mn and great amounts of Fe (Table 5).
The nutrients ha the following decreasing order of efficiency of biological utilization: Mn > Cu > Zn > Fe. This decreasing order is the opposite of that observed in the content. This means that the larger the stock of a nutrient for a given biomass production, the less efficient the species may be in relation to that nutrient.
Another very interesting aspect is that the efficiency of biological utilization is an indicator of greater or lesser nutritional requirement of the species for a given nutrient. For example, the efficiency of biological utilization of Fe ranged from 2.38 to 11.09 kg g-1, with
an average of 8.80 kg g-1, with the lesser efficient species
being Jatropha mollissima and Spondias tuberosa
(Table 5). Jatropha mollissima had a high demand for Fe (Table 3), but did not translate this demand into biomass, being inefficient in the utilization of this nutrient. Thus, Jatropha mollissima and Spondias tuberosa arenot indicated to be used in environments with low Fe availability.
Values of efficiency of biological utilization of Zn differed significantly only in the case of Senegalia paniculata and Croton blanchetianus which were less efficient in the use of nutrients in relation to the other species (Table 5). Therefore, they should not be indicated for environments with restricted Zn availability. Efficiency of biological utilization of Mn was the most variable among species, with efficiencies ranging from 24.72 to 149.11 kg g-1. Piptadenia stipulacea was the most
efficient in Mn utilization and Croton blanchetianus
was the less efficient (Table 5). The latter species had a high demand for Mn (Table 4), but did not convert this requirement into leaf biomass (Table 2).
indication of the ability of the species to adapt to restrictive environments of certain nutrients.
The species Jatropha mollissima and Spondias tuberosa
are not indicated to be used in areas that have poor availability of Fe and Mn because of the low efficiency of these species, which implies the need for a greater amount of these nutrients in order for them to produce biomass. As a suggestion, when there is a restriction of Fe and Mn in the soil in reforestation programs in the Caatinga, species such as Piptadenia stipulacea
and Senegalia bahiensis can be indicated because they present high efficiency of biological utilization.
The nutritional efficiency of the species refers to the capacity of nutrient utilization for leaf biomass production. This efficiency is specific to each nutrient and depends on the essential physiological needs of each species (Bündchen et al., 2013). It is recommended, therefore, to give priority to species with greater efficiency of absorption in less fertile soils (Nunes et al., 2013).
4. CONCLUSIONS
The efficiency of biological utilization of the nutrients by the species followed the decreasing order: Mn > Cu > Zn > Fe. The species Jatropha mollissima
and Spondias tuberosa were less efficient in the use of Fe and Senegalia paniculata and Croton blanchetianus
in the use of Zn. In turn, Piptadenia stipulacea and
Mimosa ophthalmocentra were very efficient in the use of Fe and Mn. The nutritional efficiency of the species can contribute as a criterion of choice of species in forest restoration programs.
ACKNOWLEDGEMENTS
The authors are grateful to Mr. José Cavalcanti de Siqueira Brito for assigning the fragment’s area to carry out this study, and to the National Council for Scientific and Technological Development (CNPq) and the Coordination for the Improvement of Higher Education Personnel (CAPES) for the concessions of grants for the research and study.
SUBMISSION STATUS
Received: 05 Sep., 2017 Accepted: 14 Feb., 2018
CORRESPONDENCE TO
Fernando José Freire
Universidade Federal Rural de Pernambuco – UFRPE, Rua Dom Manoel de Medeiros, CEP 52171-900, Recife, PE, Brasil e-mail: [email protected]
Table 5. Efficiency of biological utilization of Copper, Iron, Zinc, and Manganese in the leaves of the species with
greatest importance value (IV) in a hypoxerophytic Caatinga fragment.
Species Cu ____________________________Fe Zn Mn
kg g-1___________________________
Mimosa ophthalmocentra 64.00 11.09 a 29.26 a 86.54 b
Poincianella pyramidalis 47.77 9.16 a 35.47 a 99.38 b
Schinopsis brasiliensis 63.63 10.42 a 34.36 a 55.28 c
Senegalia bahiensis 66.33 10.28 a 46.65 a 83.64 b
Senegalia paniculata 57.97 8.54 a 14.79 b 52.49 c
Croton blanchetianus 65.70 9.98 a 13.64 b 24.72 c
Jatropha mollissima 67.38 2.38 b 28.51 a 42.70 c
Spondias tuberosa 74.00 7.16 b 38.04 a 64.18 c
Mimosa tenuiflora 89.63 9.71 a 33.22 a 93.80 b
Piptadenia stipulacea 75.20 9.26 a 25.91 a 149.11 a
Average 67.16 8.80 29.98 75.19
Fcalculated 0.81ns 3.70** 5.96*** 5.45***
CV (%)1 14.99 25.65 23.91 16.09
1Coefficient of variation = Standard deviation/Average x 100. Averages followed by equal letters in the columns do not differ from
each other at 5% probability level by the Scott-Knott’s test. ** and *** Significant at 1 and 0,1% probability by the F test, respectively.
REFERENCES
Alvares CA, Stape JL, Sentelhas PC, Moraes Gonçalves JL, Sparovek G. Köppen’s climate classification map for Brazil. Meteorologische Zeitschrift 2013; 22(6): 711-728. http://dx.doi.org/10.1127/0941-2948/2013/0507. Alves AR, Ferreira RLC, Silva JAA, Dubeux JCB Jr, Osajima JA, Holanda AC. Conteúdo de nutrientes na biomassa e eficiência nutricional de espécies da Caatinga.
Ciência Florestal 2017; 27(2): 377-390. http://dx.doi. org/10.5902/1980509827686.
Barbosa MD, Marangon LC, Feliciano ALP, Freire FJ, Duarte GMT. Florística e fitossociologia de espécies arbóreas e arbustivas em uma área de Caatinga em Arcoverde, Pernambuco, Brasil. Revista Árvore 2012; 36(5): 851-858. http://dx.doi.org/10.1590/S0100-67622012000500007. Beltrão BA, Mascarenhas JC, Miranda JLF, Souza Júnior LC, Galvão MJTG, Pereira SN. Diagnóstico do município de Arcoverde, estado de Pernambuco. Recife: CPRM/ PRODEEM; 2005.
Biondi CM, Nascimento CWA, Fabrício Neta AB, Ribeiro MR. Teores de Fe, Mn, Zn, Cu, Ni e Co em solos de referência de Pernambuco. Revista Brasileira de Ciência do Solo 2011; 35(3): 1057-1066. http://dx.doi.org/10.1590/ S0100-06832011000300039.
Brun EJ, Rosa SF, Roppa C, Shumacher MV, Brun FGK. Avaliação nutricional de espécies nativas utilizadas na arborização do campus da Universidade Federal de Santa Maria-RS. Revista da Sociedade Brasileira de Arborização Urbana 2012; 7(1): 89-111.
Bündchen M, Boeger MRT, Reissmann CB, Silva LSC. Status nutricional e eficiência no uso de nutrientes em espécies arbóreas da floresta subtropical no sul do Brasil.
Scientia Forestalis 2013; 41(98): 227-236.
Corcioli G, Borges JD, Jesus RP. Deficiências de macro e micronutrientes em mudas maduras de Khaya ivorensis estudadas em viveiro. Cerne 2016; 22(1): 121-128. http:// dx.doi.org/10.1590/01047760201622012085.
Deusdará KRL, Forti MC, Borma LS, Menezes RSC, Lima JRS, Ometto JPHB. Rainwater chemistry and bulk atmospheric deposition in a tropical semiarid ecosystem: the Brazilian Caatinga. Journal of Atmospheric Chemistry
2017; 74(1): 71-85. http://dx.doi.org/10.1007/s10874-016-9341-9.
Empresa Brasileira de Pesquisa Agropecuária – EMBRAPA.
Manual de análises de solo, plantas e fertilizantes. Brasília: Embrapa Informação Tecnológica; 2009.
Espig SA, Freire FJ, Marangon LC, Ferreira RLC, Freire MBGS, Espig DB. Composição e eficiência da utilização biológica de nutrientes em fragmento de Mata Atlântica
em Pernambuco. Ciência Florestal 2008; 18(3): 309-316. http://dx.doi.org/10.5902/19805098441.
Fontes AG, Gama-Rodrigues AC, Gama-Rodrigues EF. Eficiência nutricional de espécies arbóreas em função da fertilização fosfatada. Pesquisa Florestal Brasileira, 2013; 33(73): 9-18. http://dx.doi.org/10.4336/2013.pfb.33.73.392 Fontes PCR. Nutrição mineral de culturas hortícolas: horizontes e desafios para um agrônomo. Horticultura Brasileira 2014; 32(3): 247-253. http://dx.doi.org/10.1590/ S0102-05362014000300002.
Medeiros MLD, Santos RV, Tertuliano SSX. Avaliação do estado nutricional de dez espécies arbóreas ocorrentes no semi-árido da Paraíba. Revista Caatinga 2008; 21(3): 31-39. Moura PN, Althoff TD, Oliveira RA, Souto JS, Souto PC, Menezes RSC et al. Carbon and nutrient fluxes through literfall at four succession stages of Caatinga dry forest in Northeastern Brazil. Nutrient Cycling in Agroecosystems
2016; 105(1): 25-38. http://dx.doi.org/10.1007/s10705-016-9771-4.
Muner LHD, Ruiz HA, Venegas VHA, Neves JCL, Freire FJ, Freire MBGS. Disponibilidade de zinco para milho em resposta à localização de fósforo no solo. Revista Brasileira de Engenharia Agrícola e Ambiental 2011; 15(1): 29-36. http://dx.doi.org/10.1590/S1415-43662011000100005. Nachtigall GR, Nogueirol RC, Alleoni RLF. Extração sequencial de Mn e Zn em solos em função do pH e adição de cama-de-frango. Revista Brasileira de Engenharia Agrícola e Ambiental 2009; 13(3): 240-249. http://dx.doi. org/10.1590/S1415-43662009000300004.
Njana MA. Indirects methods of tree biometrics estimation and their uncertainties. Southern Forests 2016; 79(1): 41-49. http://dx.doi.org/10.2989/20702620.2016.1233753. Nunes EM, Fernandes YTD, Montenegro INA, Alves CAB, Souto JS. Eficiência da translocação de nutrientes em plantas. Revista Verde de Agroecologia e Desenvolvimento Sustentável 2013; 8(5): 90-95.
Santos HG, Jacomine PKT, Anjos LHC, Oliveira VA, Lumbreras JF, Coelho MR et al. Sistema Brasileiro de Classificação de Solos. Rio de Janeiro: Embrapa Solos; 2013. Santos JZL, Resende AV, Furtini Neto AE, Corte EF. Crescimento, acúmulo de fósforo e frações fosfatadas em mudas de sete espécies de árvores nativas. Revista Árvore 2008; 32(5): 799-807. http://dx.doi.org/10.1590/ S0100-67622008000500003.