.
Different physiological responses under drought stress
result in different recovery abilities of two tropical woody
evergreen species
Gabriella Frosi1, Wolfgang Harand2, Marciel Teixeira de Oliveira1, Silvia Pereira1, Simone Pereira Cabral3, Abelardo Antônio de Assunção Montenegro4 and Mauro Guida Santos1*
Received: October 26, 2016 Accepted: February 22, 2017
ABSTRACT
Th e eff ects of water defi cit on physiological and biochemical variables of young plants of two tropical woody species,
Pachira aquatica and Sterculia foetida, and their recovery abilities were measured. Leaf water potential, gas exchange and selected carbon metabolism components were measured in a greenhouse experiment with control, moderate and severe water defi cit treatments. Under severe drought stress, gas exchange and chlorophyll fl uorescence decreased in both species compared to their respective controls. After rehydration, P. aquatica and S. foetida showed a partial
and full recovery of the measured variables, respectively. In addition, a decrease and an increase in photosynthetic pigments were observed for P. aquatica and S. foetida, respectively, compared to their controls. In conclusion, the two species showed diff ering responses regarding photosynthetic pigment content dynamics for tolerating water defi cit. Individuals of P. aquatica in the severe water defi cit treatment showed a decrease in pigments, which may have impaired the recovery of metabolism (gas exchange) after rehydration, while S. foetida experienced an increase, favoring a full recovery of gas exchange and biochemical metabolism after rehydration.
Keywords: chlorophyll fl uorescence, climate changes, gas exchange, semiarid, water defi cit
Introduction
In tropical regions, which present a strong seasonality and water restriction, woody and evergreen species can be a viable alternative for sustainability of the local biodiversity. Climate changes increase rainfall irregularities and average temperatures in semiarid regions (Donohue et al. 2013), such
as the Brazilian Northeast. It is thus essential to understand how tree species behave under water restriction and which strategies they use to tolerate low water availability in the soil (Souza et al. 2010; Flexas et al. 2013).
In general, under water defi cit, the leaf metabolism of woody tropical species changes, resulting in changes in water potential, gas exchange, chlorophyll fl uorescence, organic solute contents and photosynthetic pigment (Frosi et al. 2013; Rivas et al. 2013; Oliveira et al. 2014). Some species decrease their photosynthetic pigments and accumulate organic solutes without showing a faster recovery of the photosynthetic activity, while other species show the opposite behavior (Souza et al. 2010; Rivas et al. 2013; Oliveira et al. 2014). Th is variation in plant responses, when subjected to water defi cit and rehydration, is relevant
1 Departamento de Botânica, Universidade Federal de Pernambuco, 50670-901, Recife, PE, Brazil 2 Instituto Nacional do Semiárido, 58429-970, Campina Grande, PB, Brazil
3 Centro de Tecnologias Estratégicas do Nordeste, Instituto Nacional de Tecnologia, 50740-540, Recife, PE, Brazil 4 Departamento de Tecnologia Rural, Universidade Federal Rural de Pernambuco, 50710-470, Recife, PE, Brazil
especially for evergreen species in semiarid environments due to the seasonality of water availability.
Pachira aquatica and Sterculia foetida are tropical woody evergreen species belonging to the Malvaceae family. They may have a potential for biodiesel production under semiarid conditions due to the high content and quality of oil in the seeds (Oliveira et al. 2000). Studies on these species focus on germination and characterization of oilseeds for biodiesel production. Ecological uses are also studied, such as the ability to recover degraded areas (Santos et al. 2004; Infante-Mata et al. 2014). However, ecophysiological aspects such as drought tolerance are unknown, especially those related to photosynthetic activity and recovery after periods of low water availability.
The maintenance of the integrity of the photosynthetic machinery is a most desirable ability in evergreen species, enabling their growth in semiarid regions. Thus, this study aimed to evaluate the effects of water deficit and recovery capacity of two tropical woody evergreen species,
P. aquatica and S. foetida, in a greenhouse, on physiological and biochemical variables. We hypothesize that both species will present a similar response regarding photosynthetic and biochemical adjustments during a water restriction period and also during rehydration, since both species belong to the same family and are widely found in the Brazilian Northeast.
Materials and methods
Plant material, growth conditions
and experimental design
Paquira aquatica Aubl. and Sterculia foetida L. seeds were collected in Pernambuco State, Brazil. The experiment was conducted in a greenhouse (8°08’58’’S, 34°56’55’’W). Seeds were previously disinfected in 1% sodium hypochlorite for five minutes, followed by washing three times in distilled water. Disinfected seeds were subsequently planted in plastic pots with a 10 kg capacity (0.27 x 0.22 m) of substrate. They contained a mixture of topsoil (organic), red clay and sand at a ratio of 3:1:1. They were then transferred to the greenhouse. P. aquatica seeds germinated in three days,
while S. foetida seeds germinated in six days.
P. aquatica and S. foetida plants were kept in the
greenhouse under an average temperature of 35 ± 2 °C
and 45-60% relative humidity, watered daily with 600 mL (capacity of soil in pot) for nine and seven months, respectively, until the beginning of the treatments. The design was completely randomized with the following different hydration levels: control (100% capacity of soil in pot), moderate (50% capacity of soil in pot) and severe (interruption of irrigation), with four plants per treatment (one plant per pot). The maximum stress occurred 15 days after the interruption of irrigation, when gas exchange reached almost zero, and rehydration took place over the
subsequent four days for all plants subjected to selected water deficit treatments (moderate and severe).
Leaf water potential (
Ψ
l) and soil moisture
Leaf water potential (Ψl) was measured using a Scholander pressure chamber (Soil moisture Equipment Corp., Santa Barbara, CA, USA) on the third fully expanded and not senescent leaf pair (Scholander et al. 1965). Measurements were performed at 6:00 am during maximum stress and rehydration. Soil moisture was obtained at a depth of 20 cm (sensor reach) using a soil moisture meter (v/v) (Falker HFM 2030, Porto Alegre, BR).
Leaf gas exchange, chlorophyll fluorescence and
vapor pressure deficit (VPD)
Leaf gas exchange was performed from 9:00 am to 11:00 am on the third fully expanded and not senescent leaf pair on alternate days during the experiment. Chlorophyll fluorescence variables were measured at the same time of the gas exchange leaf pair. The measurements were performed using a LI-COR 6400XT portable photosynthesis system (Li-COR - Lincoln, Nebraska, USA) attached to a modulated fluorometer (6400-40). The photosynthetic photon flux density was fixed at 2,000 mmol m-2s-1 according to the
incident radiation at the time of measurement of gas exchange. Stomatal conductance (gs), net photosynthetic rate (A) and transpiration rate (E) were measured. In order to evaluate the variable chlorophyll fluorescence, leaves were adapted to dark for 30 min prior to the measurements of minimal fluorescence (Fo). Maximum fluorescence on the dark-acclimated leaf (Fm) was measured after applying a saturation pulse of ~7,000 μmol m-2 s-1. Steady state
fluorescence emission (F') and maximum fluorescence (Fm') were determined using a light-adapted leaf under a stable photosynthesis obtained with the exposition of leaves to a light intensity of 2,000 μmol m-2 s-1 for 1.0 to
1.5 min. The data were used to calculate the following fluorescence variables: maximum quantum efficiency of PSII photochemistry (Fv/Fm), PSII operating efficiency (Fq'/Fm'), photochemical quenching (qP), electron transport rate (ETR), and non-photochemical quenching (NPQ) (Baker 2008).
Vapor pressure deficit (VPD) was calculated using the formula es- ea, where es is the saturated vapor pressure and ea
is the ambient pressure deficit (Campbell & Norman 1998), using temperature and relative humidity obtained with a digital thermohygrometer (Termo-Higro SH 122, J Prolab. São José dos Pinhais, BR).
Biochemical analysis
at 3:00 pm, during maximum stress and on the last day of rehydration for biochemical analysis. Samples were immediately frozen in liquid nitrogen and stored at -20 °C.
The analyses were performed soon after the end of the experiment. For the analyses, 50 mg of fresh leaves were used to determine total soluble sugar (SS) (Dubois et al.
1956), leaf free amino acid (FAA) (Moore & Stein 1948), total soluble protein (TSP) (Bradford 1976), chlorophyll
a and b (Chl a and Chl b), and carotenoid (Car) contents (Lichtenthaler & Buschmann 2001). All readings were performed using a double beam spectrophotometer (Genesis 10S UV-Vis, Thermo Scientific, Waltham, USA). The insoluble fraction from carbohydrate extraction was used to determine the starch content. The pellet was hydrolyzed for 1 h with 10 units of amyloglucosidase, and the resulting sugars were analyzed one more time (Dubois et al. 1956).
Statistical analysis
The experiment was conducted in a 2x3 factorial design considering two species (P. aquatica and S. foetida) and three water levels (control, moderate and severe water deficit). The mean and standard error were calculated for all attributes (n=4 plants per treatment). Leaf water potential, soil moisture, gas exchange, chlorophyll fluorescence and biochemical data were analyzed using two-way analysis of variance (ANOVA) (species x water levels), and significant differences were compared using the Newman Keuls test at a 5% probability. The data were analyzed using the Statistica 8.0 software (StatSoft. Inc., Tulsa, Oklahoma, USA). The statistical summary is shown in Tab. 1. A principal component analysis (PCA) was performed to verify possible groupings among dependent variables, eliminating redundancies and defining the most important variables to separate groups with the highest stress and rehydration. For PCA analysis, the data were transformed (ranging) in order to be standardized due different magnitudes of scale and level of importance of each variable, determined by the order of eigenvectors (McGarigal et al. 2000). The
level of importance of each principal component (PC) was determined using the Broken-stick method, in which eigenvalues that exceeded what was expected were kept for interpretation. Analyses were performed using the Fitopac 2.1.2.85 software (Shepherd 2010).
Results
Leaf water potential (
Ψ
l) and soil moisture (SM)
Under maximum stress, the Ψl was higher in P. aquatica
plants compared to S. foetida plants, showing a decrease in the severe treatment in both species compared to the control. Moderate treatments did not differ (Tab. 2). The soil moisture, for the control and moderate treatments, was 20% for both species, whereas under severe water deficit it was 4%. After rehydration, Ψl and soil moisture were recovered in the severe treatment and did not differ from control plants for both species. In this period, AS maximum stress, higher values of Ψl were observed for P. aquatica compared to S. foetida plants.
Leaf gas exchange, chlorophyll fluorescence and
vapor pressure deficit (VPD)
The VPD was 3 and 4 kPa in maximum stress and rehydration days, respectively. Regarding gas exchange, the control and moderate treatments presented similar
gs, Aand E values during the experiment for both species. However, the severe treatment, under maximum stress, showed significant decreases in all variables compared to the control treatment for each species, i.e., more than 80%, with a smaller decrease in A in S. foetida plants (Tab. 2). After rehydration, P. aquatica, under severe water deficit, had a
partial recovery of gs, A and E compared to the control, while
S. foetida, after a severe water deficit, had a full recovery of gas exchange rates.
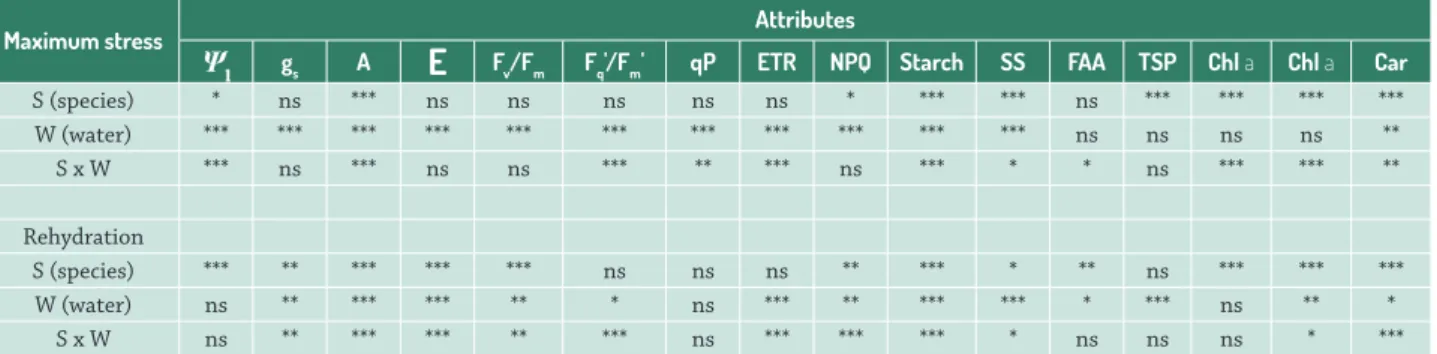
Table 1. Statistical summary of two-way ANOVA for each period of analysis (maximum stress and rehydration). Significant levels are indicated as follows: *, P < 0.05; **, P < 0.01; ***, P < 0.001; ns, not significant for leaf water potential (Ψl), stomatal conductance (gs), net photosynthetic rate (A), transpiration rate (E), maximum quantum efficiency of PSII (Fv/Fm), PSII operating efficiency (Fq'/ Fm'), photochemical quenching (qP), electron transport rate (ETR), non-photochemical quenching (NPQ), starch, soluble sugars (SS), free amino acids (FAA), total soluble protein (TSP), chlorophyll a (Chl a), chlorophyll b (Chl b) and carotenoids (Car).
Maximum stress Attributes
Ψl gs A
E
Fv/Fm Fq'/Fm' qP ETR NPQ Starch SS FAA TSP Chl a Chl a CarS (species) * ns *** ns ns ns ns ns * *** *** ns *** *** *** ***
W (water) *** *** *** *** *** *** *** *** *** *** *** ns ns ns ns **
S x W *** ns *** ns ns *** ** *** ns *** * * ns *** *** **
Rehydration
S (species) *** ** *** *** *** ns ns ns ** *** * ** ns *** *** ***
W (water) ns ** *** *** ** * ns *** ** *** *** * *** ns ** *
As for chlorophyll fluorescence, the severe treatment showed decreases in Fv/Fm, Fq'/Fm', qP and ETR and increases in NPQ, under maximum stress, for both species compared to control treatments (Tab. 3). Comparing the species,
P. aquatica plants under severe water deficit had higher decreases in Fq'/Fm', qP and ETR compared to S. foetida
plants under the same water restriction conditions. After rehydration, the recovery of photochemical attributes in severe treatments was similar to the recovery of gas exchange for both species. P. aquatica had a partial recovery
of Fq'/Fm', qP and ETR in the severe treatment compared to the control, except for Fv/Fm, which had a full recovery in this treatment and a low recovery in moderate water deficit plants. Furthermore, the NPQ in the severe treatment remained with high values for this species under maximum stress. In S. foetida plants of the severe treatment, a full
recovery of all photochemical variables, compared to control plants, was observed.
Biochemical analysis
Under maximum stress, starch was superior in S. foetida
plants compared to P. aquatica in all treatments. S. foetida
showed the leaf starch content higher in moderate water
deficit plants and decreased in severe treatment compared to control, without differences among P. aquatica treatments
(Tab. 3). The SS, in general, was higher in S. foetida plants than
P. aquatica plants, with reductions in the severe treatment
for both species in comparison with control treatments. However, this reduction was more pronounced in P. aquatica.
The FAA decreased only in the control treatment of S. foetida, while the TSP differed between species, with higher
concentrations in S. foetida plants compared to P. aquatica
plants. Regarding photosynthetic pigments, S. foetida plants had a higher concentration compared to P. aquatica plants. In addition, the dynamics of such pigments regarding water levels were different for each species. S. foetida plants of the severe treatment increased their concentrations, while
P. aquatica plants decreased compared to control plants.
After rehydration, S. foetida plants had a higher concentration of starch compared to P. aquatica. In relation
to water levels, the severe treatment of P. aquatica had a higher concentration of starch compared to control plants, while S. foetida plants of the severe water deficit treatment did not differ from the control, with higher concentrations when compared to P. aquatica. As for SS, the severe water deficit treatment had a lower concentration compared to their respective control for both species. The FAA differed between species, with higher concentrations observed for Table 2. Leaf water potential (Ψl), stomatal conductance (gs), net photosynthetic rate (A), transpiration rate (E), maximum quantum efficiency of PSII (Fv/Fm), PSII operating efficiency (Fq'/Fm'), photochemical quenching (qP), electron transport rate (ETR) and non-photochemical quenching (NPQ) of P. aquatica and S. foetida leaves of young plants under greenhouse conditions subjected to the following water restriction levels: control (100% capacity of soil in pot), moderate (50% capacity of soil in pot) and severe (suspension of irrigation). Values represent the mean values of experimental replications followed by standard error (n=4±S.E.). Different letters indicate differences by Newman Keuls test.
Attributes
Maximum Stress
P. aquatica S. foetida
Control Moderate Severe Control Moderate Severe
Ψl (MPa) -0.21±0.01A -0.25±0.02A -0.91±0.07C -0.42±0.01B -0.38±0.01B -1.06±0.02D gs (mol m-2s-1) 0.12±0.01A 0.11±0.01A 0.01±0.00B 0.11±0.01A 0.11±0.01A 0.01±0.0B A(mmol m-2s-1) 9.4±0.71A 9.1±0.56A 0.14±0.01C 7.7±0.41A 7.5±0.42A 1.19±0.08B E (mmol m-2s-1) 3.9±0.10A 4.0±0.20A 0.4±0.01B 3.7±0.34A 4.0±0.37A 0.5±0.01B
Fv/Fm 0.78±0.01A 0.77±0.01A 0.69±0.02B 0.75±0.00A 0.80±0.03A 0.67±0.03B Fq'/Fm' 0.10±0.01A 0.11±0.01A 0.02±0.00D 0.07±0.00B 0.08±0.01AB 0.03±0.00C
qP 0.29±0.01A 0.31±0.04A 0.07±0.01C 0.21±0.02A 0.21±0.01A 0.10±0.01B
ETR 87.6±7.3A 94.4±11.8A 15.5±1.4D 64.1±3.47B 69.6±5.23AB 21.81±1.40C
NPQ 1.95±0.17B 2.20±0.29B 3.22±0.20A 1.63±0.25B 1.48±0.17B 3.02±0.24A
Rehydration
Ψl (MPa) -0.29±0.01A -0.25±0.03A -0.26±0.03A -0.44±0.03B -0.39±0.03B -0.45±0.03B gs (mol m-2s-1) 0.11±0.00A 0.11±0.01A 0.03±0.00B 0.12±0.02A 0.11±0.01A 0.11±0.01A A(mmol m-2s-1) 10.0±0.28A 9.0±0.56A 2.7±0.25B 9.0±0.74A 8.5±0.44A 10.3±0.36A E (mmol m-2s-1) 4.2±0.15A 4.3±0.34A 1.7±0.15B 4.5±0.63A 4.6±0.13A 4.6±0.28A
Fv/Fm 0.70±0.01A 0.63±0.01B 0.74±0.02A 0.76±0.02A 0.73±0.01A 0.73±0.01A Fq'/Fm' 0.11±0.02A 0.11±0.01A 0.05±0.01C 0.09±0.01AB 0.07±0.01BC 0.09±0.01AB
qP 0.32±0.01A 0.30±0.01A 0.22±0.02A 0.25±0.01A 0.24±0.02A 0.25±0.01A
ETR 86.8±10.60AB 101.4±4.51A 46.8±4.33C 81.2±4.76AB 73.6±3.91B 82.0±2.24AB
S. foetida plants compared to P. aquatica plants, while TSP differed regarding water levels, with low values in control plants for both species. Regarding photosynthetic pigments, high concentrations were observed in S. foetida plants when compared to P. aquatica. In relation to water levels, S. foetida
did not differ among treatments, while P. aquatica plants had high values in the moderate and severe treatments when compared to the control.
Principal component analysis (PCA)
The PCA analysis performed on P. aquatica showed that all variables accounted for 70.25% of the total data variation (Fig. 1A), evidencing a separation among treatments via PC1 and between periods (maximum stress and rehydration) via PC2. The variables that contributed the most to the differences between the groups had eigenvalues > 0.23; their respective substantial correlation coefficients are detailed below. For PC1, the most relevant attributes were
A (0.97), E (0.96), gs(0.96), ETR (0.91), qP (0.89), Fq'/Fm' (0.88), NPQ (-0.84), SS (0.83), Chl a (0.76), and Ψl (-0.75).
For PC2, the most relevant attributes were FAA (0.77), Car (0.75), Chl b (0.69), and Fv/Fm(0.68).
Regarding S. foetida, the PCA showed that 80.25% of the total data variance can be explained by the set of variables evaluated (Fig. 1B). The variables that contributed the most to the differences between groups had eigenvalues > 0.22; their respective substantial correlation coefficients are detailed below. In the graphical analysis, a separation
between the different periods (maximum stress and rehydration) was observed for PC1. Meanwhile, a separation between the treatments was observed for PC2 mainly during the maximum stress period. In that analysis, the control and the moderate treatments were grouped together and the severe treatment was distanced. For PC1, the most significant variables were A (0.98), ETR (0.96), E (0.96),
Fq'/Fm' (0.94), qP (0.93), gs(0.92), Chl a (-0.88), Ψl (0.88), starch (0.84), Chl b (-0.84), and NPQ (-0.77). For PC2, the most relevant attributes were SS (0.77), FAA (-0.74), Fv/ Fm(0.66), TSP (-0.63), and Car (0.57).
Discussion
The stomatal closure observed for both P. aquatica
and S. foetida under severe water deficit conditions might be related to a decrease in leaf water potential in these plants. Therefore, stomatal closure led to decreases in gas exchange and photochemical variables. Under severe water restriction, plants typically show a marked photoinhibitory effect characterized by decreases in Fv/Fm, Fq'/Fm', qP and ETR and increases in NPQ. Such responses suggested that plants invested in energy dissipation as heat, avoiding damage to the photosynthetic apparatus (Ribeiro et al. 2004). Similar results for light energy use in two tree species (Piptadenia moniliformes and Trischidium molle) under water stress were found by Souza et al. (2010). However, both
species, also from the semiarid region of Brazil, did not
Table 3. Starch, soluble sugars (SS), free amino acids (FAA), total soluble protein (TSP), chlorophyll a (Chl a), chlorophyll b (Chl b)
and carotenoids (Car) of P. aquatica and S. foetida leaves of young plants under greenhouse conditions subjected to the following water restriction levels: control (100% capacity of soil in pot), moderate (50% capacity of soil in pot) and severe (suspension of irrigation). Values represent the mean values of experimental replications followed by standard error (n=4±S.E.). Different letters indicate differences by Newman Keuls test.
Attributes
Maximum Stress
P. aquatica S. foetida
Control Moderate Severe Control Moderate Severe Starch (mmol kg-1 DW) 406.6±32.2D 405.9±13.7D 463.0±16.0D 1510.2±18.8B 1673.2±14.7A 1314.1±25.3C
SS (mmol kg-1 DW) 1118.2±30.1B 1083.7±18.0B 703.8±31.9D 1221.3±24.7A 1097.8±19.4B 852.2±24.8C FAA (mmol kg-1 DW) 66.7±2.6A 68.2±3.8A 61.4±3.8A 55.3±2.1B 61.4±3.1A 69.4±3.7A
TSP (g kg-1DW) 80.8±4.9B 101.5±6.4B 93.2±4.2B 106.7±4.2A 108.2±5.0A 115.6±7.8A Chl a (g kg-1 DW) 2.8±0.3D 2.3±0.1E 1.3±0.1F 4.2±0.1C 4.7±0.1B 5.5±0.2A Chl b (g kg-1 DW) 0.9±0.1D 0.8±0.0D 0.5±0.0E 1.4±0.0C 1.6±0.0B 1.8±0.1A
Car (g kg-1 DW) 0.8±0.0C 0.8±0.0C 0.5±0.0D 1.5±0.0B 1.7±0.0A 1.6±0.0AB
Rehydration
Starch (mmolkg-1 DW) 388.7±12.4D 377.2±21.4D 648.9±31.2C 1743.7±21.8A 1543.9±30.1B 1681.4±38.0A SS (mmol kg-1 DW) 987.8±11.6AB 882.3±19.6BC 746.3±25.1D 962.7±4.1AB 1052.9±3.7A 806.4±18.0CD FAA (mmol kg-1 DW) 53.6±1.1B 55.5±1.8B 65.1±3.5B 89.0±8.5A 79.3±4.5A 93.7±5.3A
TSP (g kg-1DW) 103.3±8.8B 141.6±2.8A 154.9±4.2A 104.7±11.8B 132.9±4.7A 127.7±5.7A Chl a (g kg-1 DW) 1.8±0.3B 2.5±0.2B 1.6±0.1B 3.9±0.2A 3.6±0.2A 3.6±0.1A Chl b (g kg-1 DW) 0.4±0.0C 0.8±0.1B 0.7±0.0B 1.1±0.1A 1.1±0.0A 1.1±0.1A
Figure 1. The first (PC1) versus the second (PC2) principal component analysis of the ordination based on the whole dataset of the study of P. aquatica (A) and S. foetida (B). Closed symbols represent maximum stress (15th) and open symbols represents rehydration
(19th) days.
present a permanent photochemical damage, recovering Fv/ Fm values after rehydration. Furthermore, similar responses were also observed for Moringa oleifera (Rivas et al. 2013) and Anadenanthera columbrina (Oliveira et al. 2014), both common species in the Brazilian northwest region.
The responses of physiological variables after re-watering have received less attention than photosynthetic responses during the evolution of drought stress (Rivas et al. 2016).
After a severe water deficit, the recovery of photosynthesis may be progressive and incomplete. In general, plants subjected to a severe water deficit present 40-60% of the maximum photosynthetic rate one day after re-watering, and the recovery continues over the following days, although maximum photosynthesis rates are not always recovered (Gallé et al. 2007). This pattern was observed for P. aquatica
plants subjected to severe water deficit. However, a full
recovery of gas exchange and photochemical variables could be achieved with more rehydration days for this species.
Under maximum stress, the decrease in chlorophylls and carotenoids of P. aquatica plants under severe water deficit probably contributes to a slower recovery after rehydration. Similar responses in photosynthetic pigments, such as those observed for P. aquatica under water restriction, were
present in Olea europaea (Guerfel et al. 2009).
could provide a faster recovery of the photosynthetic activity after rehydration. A similar response was observed for young
Anadenanthera columbrina and Moringa oleifera plants (Rivas
et al. 2013; Oliveira et al. 2014). Such different responses
regarding the dynamic content of leaf photosynthetic pigments may have influenced the performance of the photosynthetic machinery during the recovery period for both species.
The low concentration of starch and SS in plants of
P. aquatica and S. foetida under severe treatments may be related to the low photosynthesis observed in these treatments when compared to the control. Other studies reported that water deficit may promote a decrease in SS (Frosi et al. 2013). The maintenance of FAA and TSP in P. aquatica plants of the severe treatment, under maximum stress, suggests a decrease in growth. Similar results for FAA and TSP were obtained by Oliveira et al. (2014) in
Anadenanthera columbrina plants under drought. Different from P. aquatica, the high FAA in S. foetida plants under
severe water deficit may have increased their tolerance to stress, favoring a full recovery after rehydration. However, the increase in starch and TSP in the severe water deficit treatmentfor both species after rehydration suggested that SS was directed to accumulate energy due to the recovery of photosynthesis and a re-growth thereafter. Such results indicated that changes in photosynthetic pigments are a strategy to tolerate water deficit in this species (Tab. 3).
The different responses of these species under limited water availability were clearly shown by the PCA. Due to the partial recovery of gas exchange and photochemical and biochemical attributes of P. aquatica plants subjected to severe water deficit, this treatment was formed a group separated from the other treatments under maximum stress and rehydration (Fig. 1A). S. foetida plants under a severe water deficit have a pattern similar to P. aquatica under maximum stress. However, after rehydration, all S. foetida
treatments formed a single group due to the full recovery mainly of gas exchange and photochemical attributes in plants from the severe water deficit treatment (Fig. 1B).
This study evidenced that both species, under water restriction, showed different leaf responses to tolerate drought stresses, although both are perennial and tropical woody species, which leads us to reject the hypothesis of this study. Decreases in stomatal conductance and the expected consequences were observed. However, the species behaved differently regarding FAA, TSP and dynamic responses of photosynthetic pigments to tolerate water deficits. P. aquatica did not change its FAA and TSP, and degraded the pigments under severe water restriction. S. foetida increased its FAA and photosynthetic pigments concentrations in this condition. Thus, this reflects in a differential metabolism recovery for both species. P. aquatica had a partial recovery of gas exchange rates, while S. foetida showed a full recovery after rehydration. On the other hand, such differences between P. aquatica and S. foetida regarding recovery speed
may be related to different times of response for each species in this study.
Although both species are able to tolerate drought stress using different leaf metabolism responses, S. foetida
plants showed a better performance after re-watering when compared to Pachira aquatica plants. This indicates that a faster recovery may enable a competitive advantage by resuming growth after a period of drought, which is a cyclical event in semiarid environments.
Acknowledgements
The study was financed by the Conselho Nacional de Desenvolvimento Científico e Tecnológico - CNPq (Proc. 551300/2010-8) and the Fundação de Amparo à Ciência e Tecnologia do Estado de Pernambuco - FACEPE (APQ – FACEPE 0929-5.01/10). M.G. Santos would like to thank CNPq for providing a scholarship.
References
Baker NR. 2008. Chlorophyll fluorescence: a probe of photosynthesis in vivo. Annual Review of Plant Biology 59: 89-113.
Bradford MM. 1976. Rapid and quantitative method for quantitation of microgram quantities of protein utilizing the principle of protein-dye binding. Analytical Biochemistry 72: 248-254.
Campbell GS, Norman JM. 1998. An introduction to environmental biophysics. New York, Springer.
Donohue RJ, Roderick ML, McVicar TR, Farquhar GD. 2013. Impact of CO2 fertilization on maximum foliage cover across the globe’s warm, arid environments. Geophysical Research Letter 40: 3031-3035. Dubois M, Gilles KA, Hamilton JK, Reders PA. Smith F. 1956. Colorimetric
method for determination of sugars and related substances. Analytical Chemistry 28: 350-356.
Flexas J, Niinemets Ü, Gallé A, et al. 2013. Diffusional conductances to CO2 as a target for increasing photosynthesis and photosynthetic water-use efficiency. Photosynthesis Research 117: 45-59. Frosi G, Oliveira MT, Almeida-Cortez J, Santos M.G. 2013. Ecophysiological
performance of Calotropis procera: an exotic and evergreen species in Caatinga, Brazilian semi-arid. Acta Physiologiae Plantarum 35: 335-344.
Gallé A, Haldimann P, Feller U. 2007. Photosynthetic performance and water relations in young pubescent oak (Quercus pubescens) trees during drought stress and recovery. New Phytologist 174: 799-810. Guerfel M, Baccouri O, Boujnah D, Chaïbi W, Zarrouk M. 2009. Impacts
of water stress on gas exchange, water relations, chlorophyll content and leaf structure in the two main Tunisian olive (Olea europaea L.) cultivars. Scientia Horticulturae 119: 257-263.
Hörtensteiner S. 2009. Stay-green regulates chlorophyll and chlorophyll-binding protein degradation during senescence. Trends in Plant Science 14: 155-162.
Infante-Mata D, Moreno-Casasola P, Madero-Veja C. 2014. ¿Pachira aquatica, un indicador del límite del manglar? Revista Mexicana de Biodiversidad 85: 143-160.
Lichtenthaler HK, Buschmann C. 2001. Chlorophylls and carotenoids: measurement and characterization by UV-VIS spectroscopy. Current Protocols in Food Analytical Chemistry F4.3: 1-8.
McGarigal K, Cushman SA, Stafford S. 2000. Multivariate statistics for wildlife ecology research. New York, Springer-Verlag.
Oliveira JTA, Vasconcelos IM, Bezerra LCNM, Silveira SB, Monteiro ACO, Moreira RA. 2000. Composition and nutritional properties of seeds from Pachira aquatica Aubl, Sterculia striata St Hil et Naud and Terminalia catappa Linn. Food Chemistry 70: 185-191.
Oliveira MT, Dias CM, Frosi G, Santos MG. 2014. Different mechanisms drive the performance of native and invasive woody species in response to leaf phosphorus supply during periods of drought stress and recovery. Plant Physiology and Biochemistry 82: 62-75.
Ribeiro RV, Machado EC, Oliveira RF. 2004. Growth and leaf temperature effects on photosynthesis of sweet orange plants infected with Xylella fastidiosa. Plant Pathology 53: 334-340.
Rivas R, Falcão HM, Ribeiro RV, Machado EC, Pimentel C, Santos MG. 2016. Drought tolerance in cowpea species is driven by less sensitivity of leaf gas exchange to water deficit and rapid recovery of photosynthesis after rehydration. South African Journal of Botany 103: 101-107.
Rivas R, Oliveira MT, Santos MG. 2013. Three cycles of water deficit from seed to young plants of Moringa oleifera woody species improves stress tolerance. Plant Physiology and Biochemistry 63: 200-208.
Santos TO, Morais TGO, Matos VP. 2004. Escarificação mecânica em sementes de chichá (Sterculia foetida L.). Revista Árvore 28: 1-6. Scholander PF, Hammel HT, Bradstreet ED, Hemmingsen EA. 1965. Sap
pressure in vascular plants, negative hydrostatic pressure can be measured in plants. Science 148: 339-346.
Shepherd GJ, 2010. Fitopac 2.1.2.85. Manual do usuário. Campinas, Unicamp.