vol. 43, n. 3, jul./set., 2007
Determination of optimum wavelength and derivative order in
spectrophotometry for quantitation of hydroquinone in creams
Pedro López García*, Maria Inês Rocha Miritello Santoro, Anil Kumar Singh, Erika Rosa Maria
Kedor-Hackmann
Departament of Pharmacy, Faculty of Pharmaceutical Sciences, University of São Paulo
UV derivative spectrophotometry was used for quantitative determination of hydroquinone in creams. The aim of this work was to investigate optimum wavelength and order of derivative, and to validate the proposed spectrophotometric method. The results of standard curves were calculated and statistically analyzed through the least squares method in the interval from 10.0 to 26.0 µg/mL, in the first, second, third and fourth order derivatives. The quantitative determination was carried out by using the zero-crossing (Z-C) and zero-peak (Z-P) methods. The proposed method is simple, of low cost and provides reliable results in order to be used in quality control of creams containing hydroquinone as active substance.
*Correspondence: P. L. García
Departament of Pharmacy Faculty of Pharmaceutical Sciences University of São Paulo Caixa Postal 66083
05508-900 - São Paulo - SP, Brazil E-mail: [email protected]
Uniterms
• Hydroquinone • UV derivative
• spectrophotometry • Quality control
INTRODUCTION
The hyperpigmentary disorders of the skin are caused by the over production of melanin, either by a normal or increased number of melanocytes, or by hormonal disorders (Cecil, 1993; Silva, Rezende, 1998). The hydroquinone (HQ) has been used for decades in creams, gels and lotions for the treatment of these disorders. It is the most frequently
used compound in skin-toning preparations (Palumbo et
al., 1991; Katsambas, Antoniou, 1995; Mohamed,
Mohamed, 1998). It belongs to the group of phenols and alike most compounds of this group, it easily undergoes oxidative degradation, principally in the presence of metallic ions, high concentration of oxygen, high pH and on exposure to light (Connors et al., 1986; Ullmann´s, 1999). The effects of HQ are transitory and concentrations below 3.0% do not cause skin injuries, however concentration above 5.0% could provoke local irritation being this the
main reason for the validation of a simple method (Bleehen,
1977; Hardman et al., 1996; Zanini and Oga, 1989).
Several analytical methods for the determination of HQ in skin-toning preparations are described, including high performance liquid chromatography (Firth, Rix, 1986; Gagliardi et al., 1987; Borremans et. al., 1999), capillary electrochromatography (Desiderio et al., 2000), micellar
chromatography (Sakodinskaya et al., 1992) and other
analytical techniques (Wang, 1995; Cruz, Fatibello-Filho, 2000; Rueda et al., 2003).
The HQ shows a broad band of absorption in the UV region between 190 and 350 nm, whose spectrum can be represented by the curve A = f (λ), where A is absorbance
and λ the wavelength. From this curve, successive
With the obtained values, the differential curve can be
traced giving rise to derivative spectrum of order n. The
derivative spectrophotometry is based on the use of these
spectra (Hackmann et al., 1991; Hopkala, Kowalczuk,
2000; Karpiñska, 2004).
The aim of this work was to determine most appropriate wavelength, as well as order of the derivative for quantitative determination of HQ in creams preparation (García et al., 2005). Such selection contributes to the development and validation of simple and reliable method for the quality control of cream preparations containing this substance.
MATERIAL AND METHODS
Chemicals
Hydroquinone (99.8%), kindly supplied by Labora-tórios Stiefel S.A. (São Paulo, Brasil), sulfuric acid (analytical grade) Merck® (São Paulo, Brasil). Distilled
water was used to prepare all solutions.
Samples
The cream preparations were obtained from a local compounding pharmacy. Sample I: 2 g HQ/100 g cream; Sample II 4 g HQ/100 g cream and Sample III 4 g HQ/100 g cream.
Instrumentation and analytical conditions
The methods were developed on a UV-Vis
spectrophotometer UV-1601 (Shimadzu®) using 1.0 cm
quartz cell and data were processed with online UVPC
v3.91 Personal Spectroscopy Software (Shimadzu®). The
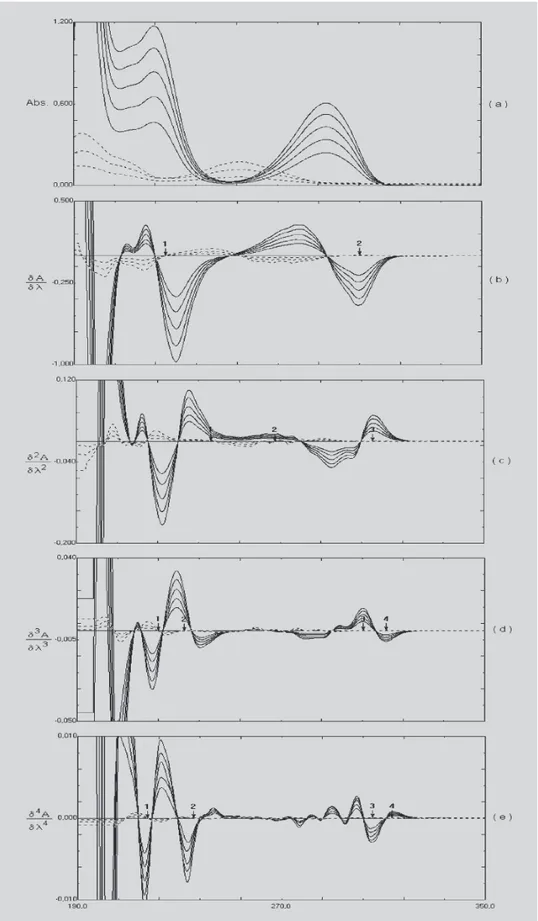
wavelength interval was established between 190 and 350 nm, the delta lambda was 2 nm, the average screening speed was 370 nm/min and the amplitude axis were from 0.000 to 1.200; -1.000 to 0.500; -0.200 to 0.120; -0.050 to 0.040 and -0.010 to 0.010 for zero, first, second, third and fourth orders derivative spectra, respectively.
Selectivity
An amount of placebo cream equivalent to 20.0 mg of HQ was weighed and transferred to a 100 mL graduated
becker. Approximately 50 mL of H2SO4 (0.05 M) was
added and was shaken during 10 min in a water bath at 40 °C. This solution was transferred to a 100 mL volumetric flask and the volume was completed with the
same solvent. The solution was filtered through Whatman®
filter paper no.1, discarding first 5 mL. Appropriate aliquots were diluted using sulfuric acid (0.05 M) in 50 mL volumetric flask to obtain solutions with final concentration equivalent to 16.0, 20.0 and 24.0 µg/mL of placebo.
Linearity
To prepare calibration curve, accurately weighed 50.0 mg of HQ was transferred to a 50 mL volumetric flask and dissolved in sulfuric acid (0.05M). The volume was completed with the same solvent. The above solution was systematically diluted in 25 mL volumetric flasks (in triplicate) to obtain final solutions containing 10.0, 14.0, 18.0, 22.0 and 26.0 µg/mL of HQ.
Precision
Accurately weighed amount of cream equivalent to 15.0 mg of HQ was transferred to a 100 mL graduated
becker. Approximately 50 mL of H2SO4 (0.05 M) were
added and were shaken during 10 min in a water bath at 40 ºC. This solution was transferred to a 100 mL volumetric flask and the volume was completed with the same solvent. The resultant solution was filtered through Whatman filter paper no.1, discarding first 5 mL. A 3 mL aliquot of this solution was diluted in a 25 mL volumetric flask using 0.05 M sulfuric acid to obtain a solution with final concentration of 18.0 µg/mL. Each sample was assayed ten times with each sample solution.
Accuracy
An accurately weighed amount of cream equivalent to 12.0 mg of hydroquinone was transferred to a 100 mL volumetric flask, dissolved in approximately 50 mL of 0.05 M sulfuric acid and was shaken during 10 min in a water bath at 40 °C. After cooling, the volume was completed with the same solvent and aliquots of 10.0 mL of this solution were transferred into 100 mL volumetric flasks containing 1.0, 5.0 and 10.0 mL of a standard hydroquinone solution (100.0 µg/mL) and sulfuric acid (0.05 M) was added to make up the volume to obtain final concentrations of 13.2, 18.0 and 24.0 µg/mL of HQ. All solutions were prepared in triplicate and analyzed. The percentage recovery was calculated using the equation proposed in Official Methods of Analysis of AOAC International (AOAC International, 1990).
Procedure
of the spectrophotometer with 0.05 M sulfuric acid, the absorption spectra of each sample were obtained. The first, second, third and fourth orders derivative spectra were traced from above curves. The quantitative determinations of HQ were made at signal when there was no interfering absorption.
RESULTS AND DISCUSSIONS
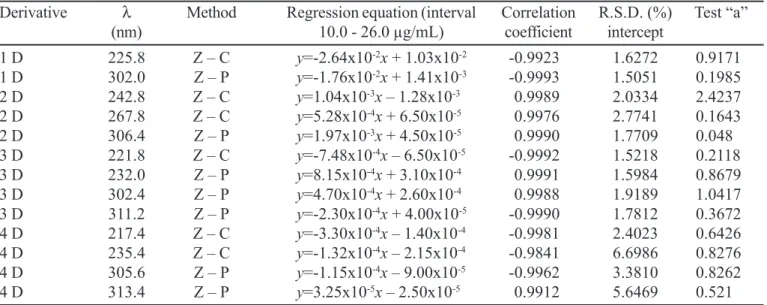
The calibration curves were constructed by plotting amplitudes of the first, second, third and fourth derivative spectra versus the concentration of the HQ in 0.05 M sulfuric acid. Table I shows statistically treated data of calibration curves.
Zero-crossing (Z-C) is the method that enables the measurement of the spectrum amplitude where the interference is cancelled till the signal of the HQ. Zero-peak (Z-P) is the method that measures the spectrum amplitude from the base line till the signal of HQ. These two methods were used for quantitative determination of HQ in creams. Figure 1 shows the zero, first, second, third and fourth orders derivative spectra of the calibration curves of HQ in 0.05 M sulfuric acid. It was observed that at designated points, the possible interference from placebo is null. These are the most appropriate wavelengths for quantitative determination of HQ. However, between these points, there is a single wavelength that provides statistically most adequate result and at this point, determination can be made with least relative standard deviation.
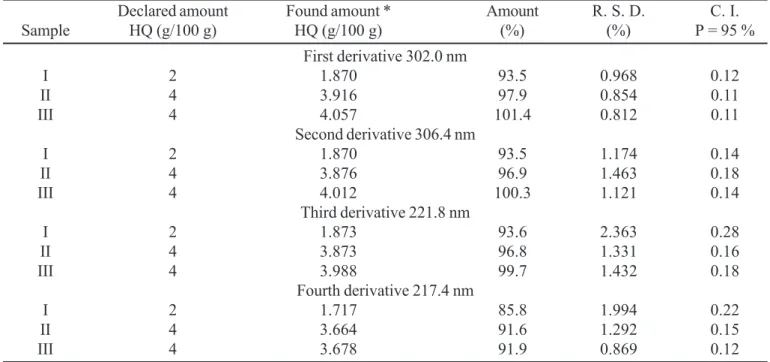
After identifying the optimum wavelength and derivative order by statistic treatment (signal at 302.0 nm in the first derivative), the analytical method was validated and applied for quantitative determination of HQ in creams. The results can be observed in Table II. The low relative standard deviation (R.S.D.) values indicates precision of the method. In majority of the determinations it is below 2%, indicating high degree of agreement (repeatability)
between experimental values (Bruce et al., 1998; ICH
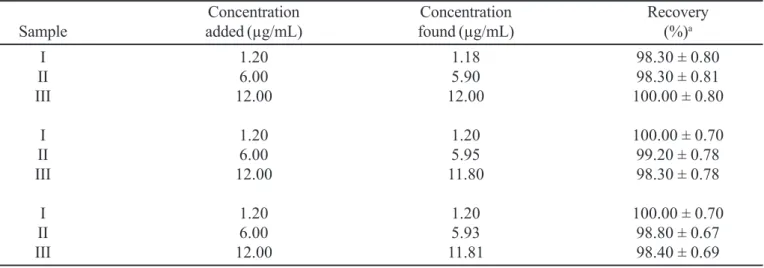
Q2A; ICH Q2B; Shabir, 2003). Figure 2 shows UV derivative spectra of HQ standard solution, HQ sample solution and placebo of the cream. No interfering signals and overlaps were observed in placebo at 302.0 nm in the first derivative. A good accuracy of the method was verified with a mean recovery of 99.2% (Table III).
CONCLUSIONS
The proposed UV derivative spectrophotometric method proved to be an excellent option for HQ determination in creams. The interference from excipients was eliminated by selecting the most adequate wavelength. The first derivative with zero-peak method at 302.0 nm was successfully applied for quantitative determination of HQ. The proposed method can be used for analysis in routine quality control of cosmetic preparations with HQ as a unique active substance. The method is simple, rapid, pre-cise and of low cost.
TABLE I - Statistics evaluation of the calibration curves of HQ in 0.05 M sulfuric acid
Derivative λ Method Regression equation (interval Correlation R.S.D. (%) Test “a”
(nm) 10.0 - 26.0 µg/mL) coefficient intercept
1 D 225.8 Z – C y=-2.64x10⁻²x + 1.03x10⁻² -0.9923 1.6272 0.9171
1 D 302.0 Z – P y=-1.76x10⁻²x + 1.41x10⁻³ -0.9993 1.5051 0.1985
2 D 242.8 Z – C y=1.04x10⁻³x – 1.28x10⁻³ 0.9989 2.0334 2.4237
2 D 267.8 Z – C y=5.28x10⁻⁴x + 6.50x10⁻⁵ 0.9976 2.7741 0.1643
2 D 306.4 Z – P y=1.97x10⁻³x + 4.50x10⁻⁵ 0.9990 1.7709 0.048
3 D 221.8 Z – C y=-7.48x10⁻⁴x – 6.50x10⁻⁵ -0.9992 1.5218 0.2118
3 D 232.0 Z – P y=8.15x10⁻⁴x + 3.10x10⁻⁴ 0.9991 1.5984 0.8679
3 D 302.4 Z – P y=4.70x10⁻⁴x + 2.60x10⁻⁴ 0.9988 1.9189 1.0417
3 D 311.2 Z – P y=-2.30x10⁻⁴x + 4.00x10⁻⁵ -0.9990 1.7812 0.3672
4 D 217.4 Z – C y=-3.30x10⁻⁴x – 1.40x10⁻⁴ -0.9981 2.4023 0.6426
4 D 235.4 Z – C y=-1.32x10⁻⁴x – 2.15x10⁻⁴ -0.9841 6.6986 0.8276
4 D 305.6 Z – P y=-1.15x10⁻⁴x – 9.00x10⁻⁵ -0.9962 3.3810 0.8262
4 D 313.4 Z – P y=3.25x10⁻⁵x – 2.50x10⁻⁵ 0.9912 5.6469 0.521
TABLE II - Determination of the HQ content in cream utilizing the first, second, third and fourth derivative orders in 0.05 M sulfuric acid
Declared amount Found amount * Amount R. S. D. C. I.
Sample HQ (g/100 g) HQ (g/100 g) (%) (%) P = 95 %
First derivative 302.0 nm
I 2 1.870 93.5 0.968 0.12
II 4 3.916 97.9 0.854 0.11
III 4 4.057 101.4 0.812 0.11
Second derivative 306.4 nm
I 2 1.870 93.5 1.174 0.14
II 4 3.876 96.9 1.463 0.18
III 4 4.012 100.3 1.121 0.14
Third derivative 221.8 nm
I 2 1.873 93.6 2.363 0.28
II 4 3.873 96.8 1.331 0.16
III 4 3.988 99.7 1.432 0.18
Fourth derivative 217.4 nm
I 2 1.717 85.8 1.994 0.22
II 4 3.664 91.6 1.292 0.15
III 4 3.678 91.9 0.869 0.12
* n = 10; R.S.D. = Relative Standard Deviation; C.I. = Confidence Interval
RESUMO
Determinação do comprimento de onda ótimo e da ordem da derivada em espectrofotometria para
quantificação de hidroquinona em cremes
A espectrofotometria derivada no UV foi usada para a de-terminação quantitativa de hidroquinona em cremes. O objetivo desta pesquisa foi investigar o melhor compri-mento de onda e a ordem da derivada, bem como validar o método proposto. Os resultados das curvas analíticas fo-ram analisados estatisticamente pelo método dos mínimos quadrados no intervalo de 10,0 a 26,0 µg/mL, na primei-ra, segunda, terceira e quarta ordens da derivada. As de-terminações quantitativas foram realizadas utilizando os métodos “zero-crossing (Z-C)” e zero-pico (Z-P). O mé-todo proposto é simples, de baixo custo e fornece resulta-dos confiáveis podendo ser usado no controle de qualida-de qualida-de cremes contendo hidroquinona como substância ativa.
UNITERMOS: Hidroquinona. Espectrofotometria deriva-da no UV. Controle de qualideriva-dade
ACKNOWLEDGMENTS
We acknowledge CNPq (Conselho Nacional de De-senvolvimento Científico e Tecnológico - Brasil) for the financial support.
REFERENCES
AOAC INTERNATIONAL. Official Methods of Analysis, 15
Ed. Arlington: AOAC INTERNATIONAL, 1990. p.21.
BLEEHEN, S.S. Skin bleaching preparations. J. Soc. Cosmet. Chem., New York, v.28, p.407-412, 1977.
BORREMANS, M.; DE BEER, J.; GOEYENS, L. Experimental and statistical validation of HPLC analysis of hydroquinone and its methoxyphenol, 4-ethoxyphenol and 4-benzyloxyphenol ethers in cosmetic
products. Chromatographia, Wiesbaden, v.50, n.5/6,
p.346-352, 1999.
BRUCE, P.; MINKKINEN, P.; RIEKKOLA, M.-L. Practical method validation: validation sufficient for an analysis method. Mikrochim. Acta, Wien, v.128, n.1/2, p.93-106, 1998.
CECIL, R.L.; WYNGAARDEN, J.B.; SMITH Jr., L.H.; BENNETT, J.C., eds. Cecil tratado de medicina interna. 19.ed. Rio de Janeiro: Guanabara Koogan, 1993. v.2, p.2370-2371.
CONNORS, K.A.; AMIDON, G.L.; STELLA, V.J. Chemical
stability of pharmaceuticals: a handbook for pharmacists. 2.ed. New York: John Wiley, 1986. p.82-93.
TABLE III - Recovery of a standard HQ content added to cream and determined by first derivative at 302.0 nm in 0.05 M sulfuric acid
Concentration Concentration Recovery
Sample added (µg/mL) found (µg/mL) (%)a
I 1.20 1.18 98.30 ± 0.80
II 6.00 5.90 98.30 ± 0.81
III 12.00 12.00 100.00 ± 0.80
I 1.20 1.20 100.00 ± 0.70
II 6.00 5.95 99.20 ± 0.78
III 12.00 11.80 98.30 ± 0.78
I 1.20 1.20 100.00 ± 0.70
II 6.00 5.93 98.80 ± 0.67
III 12.00 11.81 98.40 ± 0.69
CRUZ, V.I.; FATIBELLO-FILHO, O. Biosensor based on paraffin/graphite modified with sweet potato tissue for the determination of hydroquinone in cosmetic cream in organic phase. Talanta, Amsterdam, v.52, n.4, p.681-689, 2000.
DESIDERIO, C.; OSSICINI, L.; FANALI, S. Analysis of hydroquinone and some of its ethers by using capillary electrochromatography. J. Chromatogr., A, Amsterdam, v.887, n.2, p.489-496, 2000.
FIRTH, J.; RIX, I. Determination of hydroquinone in skin-toning creams using high-performance liquid chromatography. Analyst, Letchworth, v.111, n.2, p.129-132, 1986.
GAGLIARDI, L.; AMATO, A.; CAVAZZUTTI, G.; CHIMENTI, F.; BOLASCO, A.; TONELLI, D. Identification and quantification of hydroquinone and some of its ethers in cosmetic products by reversed-phase
high-performance liquid chromatography. J.
Chromatogr., Amsterdam, v.404, n.1, p.267-272, 1987.
HACKMANN, E.R.M.; BENETON, S.A.; SANTORO, M.I.R.M. Espectrofotometria derivada na análise de
fármacos em medicamentos. Rev. Port. Farm., Lisboa.
v.41, n.1, p.7-13, 1991.
HARDMAN, J.G.; LIMBARD, L.E.; MOLINOFF, P.B.;
RUDDON, R.W.; GILMAN, A.G., eds. Goodman &
Gilman´s The pharmacological basis of therapeutics. 9.ed., New York: McGraw-Hill, 1996. p.1216.
HOPKALA, H.; KOWALCZUK, D. Application of derivative UV spectrophotometry for the determinantion of enoxacin and nalidixic acid in tablets. Pharmazie, Eschborn, v.55, n.6, p.432-435, 2000.
INTERNATIONAL CONFERENCE ON
HARMONIZATION (ICH); validation of analytical
procedures: Definitions and terminology, Q2A (CPMP/ ICH/381/95), 1995. Disponível em: http://www.ich.org. Acesso em: 24 jul. 2006.
INTERNATIONAL CONFERENCE ON
HARMONIZATION (ICH); validation of analytical
procedures: Methodology, Q2B (CPMP/ICH/281/95), 1995. Disponível em: http://www.ich.org. Acesso em: 24 jul. 2006.
KARPIÑSKA, J. Derivative spectrophotometry—recent applications and directions of developments. Talanta. Amsterdam, v.64, n.4, p.801-822, 2004.
KATSAMBAS, A.; ANTONIOU, CH. Melasma: classification and treatment. J. Eur. Acad. Dermatol. Venereol., Amsterdam, v.4, n.3, p.217-223, 1995.
GARCIA, P.L.; SANTORO, M.I.R.M; KEDOR-HACKMANN, E.R.M.; SINGH, A.K. Development and validation of a HPLC and a UV derivative spectrophotometric methods for determination of
hydroquinone in gel and cream preparations J. Pharm.
Biomed. Anal., Oxford, v.39, n.3/4, p.764-768, 2005.
MOHAMED, A.; MOHAMED, M. Topical hydroquinone in the treatment of some hyperpigmentary disorders. Int. J. Dermatol., Oxford, v.37, n.6, p.449-450, 1998.
PALUMBO, A.; D’ISCHIA, M.; MISURACA, G.; PROTA, G. Mechanism of inhibition of melanogenesis by
hydroquinone. Biochim. Biophys. Acta, Amsterdam,
v.1073, n.1, p.85-90, 1991.
RUEDA, M.E.; SARABIA, L.A.; HERRERO, A.; ORTIZ, M.C. Optimisation of a flow injection system with electrochemical detection using the desirability function application to the determination of hydroquinone in
cosmetic. Anal. Chim. Acta, Amsterdam, v.479, n.2,
p.173-184, 2003.
SAKODINSKAYA, I.K.; DESIDERIO, C.; NARDI, A.; FANALI, S. Micellar electrokinetic chromatographic study of hydroquinone and some of its ethers. determination of hydroquinone in skin-toning cream. J. Chromatogr., Amsterdam, v.596, n.1, p.95-100, 1992.
SHABIR, G.A. Validation of high-performance liquid chromatography methods for pharmaceutical analysis. understanding the differences and similarities between validation requeriments of the US Food and Drug Administration, the US Pharmacopeia and the
International Conference on Harmonization. J.
Chromatogr., A, Amsterdam, v.987, n.1/2, p.57-66, 2003.
SILVA, P.; RESENDE, A., coords. Farmacologia. 5.ed. Rio
de Janeiro: Guanabara Koogan, 1998. p.1242.
ULLMANN´S encyclopedia of Industrial organic chemicals;
WANG, L. Simultaneous determination of hydroquinone ethers in cosmetic after preconcentration at a carbon paste electrode. Analyst, Letchworth, v.120, n.8, p.2241-2244, 1995.
ZANINI, A.; OGA, S. Farmacologia aplicada. 4.ed. São
Paulo: Atheneu, 1989. p.429.