vol. 43, n. 3, jul./set., 2007
Use of chloramine-T and two dyes in the sensitive determination of
stavudine in pharmaceuticals
Kanakapura Basavaiah
1*, Veeraiah Ramakrishna
2, Urdigere Rangachar Anilkumar
11Department of Chemistry, University of Mysore, India, 2Department of Drugs Control, Govt. College of Pharmacy, India
Three new methods are described for the assay of stavudine (STV) in bulk drug and in dosage forms using chloramine-T (CAT) and two dyes, methyl orange and indigocarmine, as reagents. Titrimetry involves treating STV with a measured excess of CAT in hydrochloric acid medium, and after the oxidation of STV is judged to be complete, the unreacted oxidant is determined iodometrically. Spectrophotometric methods entail the addition of a known excess of CAT to STV in hydrochloric acid medium followed by determination of residual oxidant by reacting with a fixed amount of either methyl orange and measuring the absorbance at 520 nm (Method A) or indigo carmine and measuring the absorbance at 610 nm (Method B). In all the methods, the amount of CAT reacted corresponds to the amount of STV. In titrimetric method, the reaction follows 1:1 stoichiometry (STV: CAT), and is applicable over the range 1.5-10 mg of STV. In spectrophotometric methods, the absorbance is found to increase linearly with concentration of STV. The systems obey Beer’s law for 0.2-2.0 and 1.0-10.0 µg/mL for method A and method B, respectively. The apparent molar absorptivities are calculated to be 5.7x10⁴ and 1.5x10⁴ L/mol/cm for method A and method B, respectively, and the corresponding Sandell sensitivity values are 0.004 and 0.015 µg/cm2. The limits of detection and quantification are reported for both methods. Intra-day and inter-day precision and accuracy of the developed methods were evaluated as per the current ICH guidelines. The methods were successfully applied to the assay of STV in tablet and capsule formulations and the results were compared with those of a reference method by applying Student’s t-test and F-test. No interference was observed from common tablet adjuvants. The accuracy and reliability of the methods were further ascertained by performing recovery experiments via standard-addition method. *Correspondence:
K. Basavaiah Department of Chemistry University of Mysore
Manasagangotri, Mysore-570 006, India
E-mail: [email protected]
INTRODUCTION
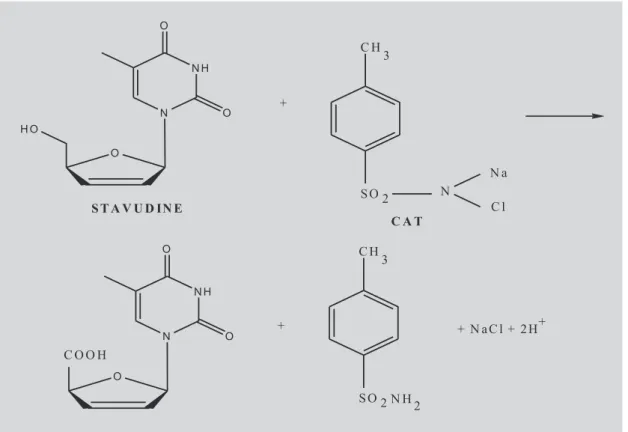
Stavudine (STV), chemically known as 21-31
-didehydro -21-31- dideoxythymidine (Figure 1), is a
nucleoside analog reverse transcriptase inhibitor (NARTI) active against HIV (Merck Index, 1996). STV is converted intracellularly to triphosphate which stops the DNA synthesis of retroviruses through competitive inhibition of reverse transcriptase and incorporation into viral DNA. It is the fourth antiretroviral drug in the market and is used in the treatment of HIV infection. The drug is official in United States Pharmacopeia (USP, 2006). which describes high performance liquid chromatographic procedures for bulk drug and tablets.
A number of methods based on high performance liquid chromatography (Bezy et al. 2005; Verweij-van Wissen et al. 2005; Contreras et al. 2004), liquid chromatography-tandem mass spectrometry (Compain et al., 2005; Huang et al., 2004; Raices et al., 2003, Fan et al., 2002; Weisner et al., 2002), micellar electrokinetic chromatography (Fan and Stewart. 2002) and electro-phoresis (Pereira et al., 2005) are known for the quantitative determination of STV in biological matrices such as blood plasma, blood serum and human cells. Several chromatographic techniques including HPLC (Dunge et al., 2005; Djurdjevic et al., 2004; Zhang et al.,
2003; Sablon et al., 2004; Pai and Desai. 2003; Rezk et al., 2003), HPTLC (Wankhede et al., 2005; Kaul et al., 2005) and LC-MS (Volosov et al., 2002), have been used for the determination of STV in pharmaceuticals. The drug has also been assayed by mass spectrometry (Soldin, 2004) and UV-spectrophotometry (Sankar et al., 2002).
Despite its long history and established versatility, no titrimetric method has yet been reported for the deter-mination of STV in pharmaceuticals. Visible spectro-photometry, because of its simplicity, speed, sensitivity, reasonable accuracy and precision, and cost-effectiveness, continues to be the preferred technique in laboratories of developing and underdeveloped nations, which can illafford expensive chromatographic and related techniques. Three procedures (Sarma et al., 2002) have been reported for the assay of STV in pharmaceuticals using Potassium permanganate-Fast Green FCF, permanganate/periodate-3-methylbenzothiazolinone hydrazone (MBTH) and iron(III)chloride-ferricyanide as reagents. The same authors (Sarma et al., 2002) have used three more reagents, N-bromosuccinimide (NBS)-celestine blue, cobalt thiocyante and ammonium molybdate for the spectro-photometric determination of STV. A method based on oxidative-coupling reaction (Sankar et al., 2002) involving the use of iron (III)-MBTH is also found in the literature. But, these methods suffer from one or the other
disadvantage like poor sensitivity, heating or extraction step and/or use of expensive chemical/organic solvent.
In this communication, we report one titrimetric and two spectrophotometric methods for the determination of STV in bulk drug and in pharmaceutical formulations. The methods are based on the oxidation of STV by CAT followed by estimation of unreacted oxidant by iodometric back titration (titrimetry) or reacting with a fixed amount of dye (spectrophotometry). The methods were applied to the determination of STV in different proprietary drugs and were found to yield satisfactory results.
EXPERIMENTAL
Apparatus
A Systronics model 106 digital spectrophotometer with 1-cm matched quartz cells was used for all absorbance measurements.
Reagents and materials
All chemicals used were of analytical reagent grade
and distilled water was used to prepare all solutions. Chloramine-T solution (0.01M) was prepared by dissolving about 2.8 g of the chemical (Qualigens Fine Chem., Glaxo India Ltd., Mumbai) in water and diluting to 1 litre, and used in titrimetry after standardization ( Berka
et al., 1965). For spectrophotometric investigation, the above solution was diluted appropriately with water to get 50.0 and 225.0 µg/mL concentrations for method A and method B, respectively. To prepare 50.0 µg/mL methyl orange for method A, first, a 500.0 µg/mL dye solution was prepared by dissolving 59.0 mg of dye (s.d. Fine Chem Ltd., Mumbai, assay 85%) in water and diluting to 100 mL in a calibrated flask, and filtered using glass wool. This was diluted ten-fold with water to get the required concentration. For method B, first, a 1000.0 µg/mL indigo carmine solution was prepared by dissolving 112.0 mg of dye (s.d.Fine-Chem Ltd., Mumbai, 90% assay) in water and diluting to 100 mL, and filterd. This was appropriately diluted with water to get 200.0 µg/mL. Hydrochloric acid (5.0, 2.0 or 1.0 M) was prepared by diluting concentrated acid (s.d. Fine-Chem Ltd., Mumbai, Sp gr 1.18) appropriately with water. Sodium thiosulphate solution (0.02 M) was prepared by dissolving about 5.0 g of the
TABLE I - Comparison of performance characteristics of proposed methods with the existing spectrophotometric methods
Sl Reagent* λmax, nm Linear range, ∈, Remarks Ref.
No. µg/ mL L/mol/cm
1 a) NBS-celestine 540 0.7-6.0 1.6×10⁴ NBS requires daily Sarma et
blue standardisation al. 2002
b) Cobalt thiocyante 610 1.5-15.0 7.7×10³ Involves extraction step
with organic solvent, less sensitive
c) Ammonium 700 11.0-150.0 1.0×10³ Requires heating;
molybdate least sensitive.
2 Iron (III)-MBTH Longer contact time, Sankar et
expensive chemical al. 2002
3 a) KMnO4-Fast 640 1.0-8.0 1.28×10⁴ Less sensitive Sharma et
green FCF al. 2002
b) KMnO4/NaIO4- 620 0.6-6.0 2.02×10⁴ Longer contact time,
MBTH expensive chemical
c) Iron (III)- 740 9.0-75.0 1.24×10³ Less sensitive
ferricyanide
4 a) CAT- 520 0.2-2.0 5.7×10⁴ Highly sensitive,wide Present
methylorange linear dyanamic ranges, methods
b) CAT- 610 0.5-10 1.5×10⁴ no heating/extraction,
indigocarmine shorter reaction time
inexpensive chemicals
chemical (SISCO Chem, Industries, Mumbai) in 1 litre of water and standardized with pure potassium dichromate iodometrically (Bassett et al., 1978). Aqueous solutions of potassium iodide (10%) and starch indicator (1%) were prepared in the usual way. Pharmaceutical grade STV, certified to be 99.8% pure, was received from Cipla India Ltd, Mumbai, India, as gift and was used as received. A 1.0 mg/mL solution of STV was prepared by dissolving accurately weighed 250.0 mg of pure drug in water and diluting to 250 mL with water in a calibrated flask and used for assay by titrimetry. This stock solution (1000.0 µg/mL) was diluted with water to get working concentrations of 5.0 and 20.0 µg/mL STV for method A and method B, respectively.
Methods
Titrimetry
A 10.0 mL aliquot of pure drug solution equivalent to 1.5-10.0 mg of STV was measured accurately and transferred into a 100 mL titration flask. Five mL 1 M hydrochloric acid followed by 10 mL of 0.01 M CAT solution were added and kept aside for 10 min with occasional swirling. Then, 5 mL of 10% potassium iodide solution were added to the flask and the liberated iodine was titrated with 0.02 M sodium thiosulphate to a starch end point. A blank titration was run under same conditions. The amount of the drug present in the measured aliquot was calculated from the volume of CAT that has reacted with the drug.
Spectrophotometric method using methyl orange (Method A)
Aliquots of pure STV solution (0.4 to 4.0 mL; 5.0 µg/mL) were transferred into a series of 10 mL calibrated flasks and the total volume was adjusted to 4.0 mL with water. To each flask were added 1 mL of 5 M hydrochloric acid followed by 1 mL of CAT solution (50.0 µg/mL). The content was mixed well and the flasks were set aside for 10 min with occasional shaking. Finally, 1 mL of 50.0 µg/mLmethyl orange solution was added to each flask, diluted to the mark with water and the absorbance of solution was measured at 520 nm against reagent blank after 10 min.
Spectrophotometry with indigo carmine (Method B) Varying aliquots (0.5-5.0 mL) of standard 20.0 µg/mL STV solution were measured accurately and delivered into a series of 10 mL calibrated flasks and the total volume was brought to 5.0 mL with water. To each flask were added 2 mL each of 2 M hydrochloric acid and 200.0 µg/mL
chloramine-T solutions successively; the flasks were let stand for 10 min with occasional shaking. Then, 1 mL of 200.0 µg/mL indigo carmine solution was added to each flask, the volume was adjusted to the mark with water and mixed well. The absorbance of each solution was measured at 610 nm against a reagent blank after 10 min.
In either spectrophotometric method, the concentration of the unknown was read from the calibration graph or computed from the regression equation derived from the Beer’s law data.
Assay procedure for formulations
An amount of finely ground tablet/capsule powder equivalent to 100.0 mg of STV was accurately weighed into a 100 mL calibrated flask, 60 mL of water added and shaken for 20 min. Then, the volume was made up to the mark with water, mixed well, and filtered using a Whatman No 42 filter paper. First 10 mL portion of the filtrate was discarded and a suitable aliquot of the subsequent portion (1.0 mg/mL STV) was taken for assay by titrimetric procedures. The filtrate was diluted appropriately to get 5.0 and 20.0 µg/mL STV concentrations for analysis by spectrophotometric method A and method B, respectively.
RESULTS AND DISCUSSIONS
The proposed methods are based on the oxidation of STV by CAT in HCl medium and the reaction is followed by titrimetry and spectrophotometry for quantization purposes. In titrimetry, the unreacted CAT is determined iodometrically, and in spectrophotometric methods, the same is determined by reacting with a fixed amount of either methyl orange or indigo carmine. The latter methods make use of the bleaching action of chloramine-T on either dye, the decolouration being caused by the oxidative destruction of the dye.
Optimisation of experimental conditions
Titrimetry
reaction between STV and CAT proceeds stoichio-metrically in the ratio of 1:1, in the optimum range (1.5-10.0 mg). Based on the reaction stoichiometry, a tentative reaction scheme shown in Figure 1 is suggested.
Spectrophotometry
In the proposed spectrophotometric methods, the ability of CAT to effect oxidation of STV and irreversibly destroy methyl orange or indigo carmine to colourless products in acid medium has been used. STV when added in increasing concentrations to a fixed concentration of CAT, consumes the latter and there will be a concomitant decrease in its concentration. When a fixed concentration of either dye is added to decreasing concentrations of CAT, a concomitant increase in the concentration of dye results and a proportional increase in the absorbance at the respective λmax is observed with increasing concentration of STV.
Preliminary experiments were performed to fix the upper limits of the dyes that could be determined spectrophotometrically, and these were found to be 5.0 and 20.0 µg/mL for methyl orange and indigo carmine, respectively. A CAT concentration of 5.0 µg/mL was found to irreversibly destroy the red colour of 5.0 µg/mL methyl orange whereas 20.0 µg/mL CAT was required to bleach the blue colour due to 22.5 µg/mL indigo carmine. Hence, different amounts of STV were reacted with 1 mL of 50.0 µg/mL CAT in method A and 1mL of 225.0 µg/mL CAT in method B followed by determination of the residual oxidant as described under the respective procedures.
For both oxidation of STV and bleaching of dye by
CAT, hydrochloric acid medium was found to be ideal. One mL of 5 M hydrochloric acid for method A and 2 mL of 2 M HCl for method B, in a total volume of ~4-5 mL were adequate for the oxidation step which was complete in 10 min in both methods and the same quantity of acid was employed for the estimation of the dye. Contact time of 10 min is not critical and any delay upto 30 min had no effect on the absorbance. The absorbance of either dye colour was stable for several hours in the presence of reaction product.
Analytical data
A linear correlation was found between absorbance at λmax and concentration of STV. The graphs showed negligible intercept and are described by the equation:
Y = a + bX
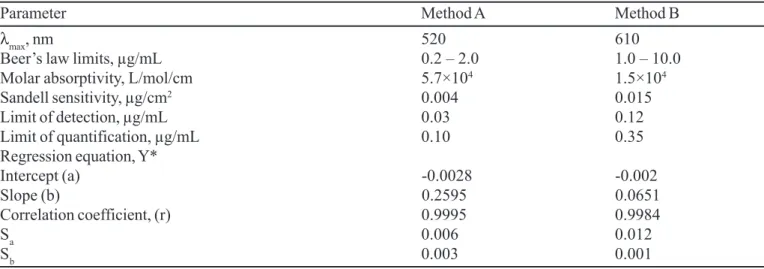
(where Y = absorbance of 1-cm layer of solution; a = intercept; b = slope and X = concentration in µg/mL). Regression analysis of the Beer’s law data using the method of least squares was made to evaluate the slope (b), intercept (a) and correlation coefficient(r) for each system and the values are presented in Table II. The optical characteristics such as Beer’s law limits, molar absorptivity and Sandell sensitivity values of both methods are also given in Table II. The limits of detection (LOD) and quantitation(LOQ) calculated according to ICH guidelines( ICH guidelines, 1996) are also presented in Table II and reveal the very high sensitivity of the spectrophotometric methods.
TABLE II - Analytical and regression parameters of spectrophotometric methods
Parameter Method A Method B
λmax, nm 520 610
Beer’s law limits, µg/mL 0.2 – 2.0 1.0 – 10.0
Molar absorptivity, L/mol/cm 5.7×10⁴ 1.5×10⁴
Sandell sensitivity, µg/cm2 0.004 0.015
Limit of detection, µg/mL 0.03 0.12
Limit of quantification, µg/mL 0.10 0.35
Regression equation, Y*
Intercept (a) -0.0028 -0.002
Slope (b) 0.2595 0.0651
Correlation coefficient, (r) 0.9995 0.9984
Sa 0.006 0.012
Sb 0.003 0.001
Method Validation
Intra-day and inter-day precision
To evaluate the precision of the methods, pure drug solution at three different levels (within the working limits) was analysed, each determination being repeated seven ti-mes. The relative standard deviation (%) values were ≤ 2.0 and indicate the high precision for the methods. For a better picture of reproducibility on a day-to-day basis, a series of experiments were performed in which standard drug solution at three different levels was determined each day for five days with all solutions being prepared afresh each day. The day-to-day relative standard deviation values were in the range of 3.2-3.7% and represent the best appraisal of the methods in routine use.
Application to analysis of commercial samples
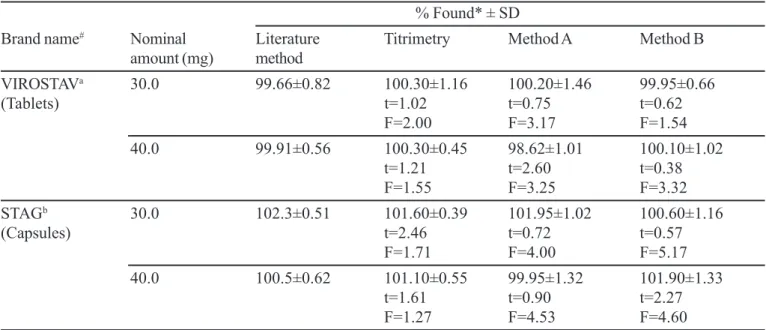
In order to check the validity of the proposed methods, STV was determined in some commercial formulations. Table III gives the results of the determination from which it is clear that there is close agreement between the results obtained by the proposed methods and the label claim. The results were also compared statistically by a Student’s t- test for accuracy and variance ratio F- test for precision with those of the literature method (Sankar et al., 2002) at 95% confidence level. The calculated t- and F-values (Table III) did not exceed the tabulated values (t=2.77, F=6.39), indicating
that there was no significant difference between the proposed methods and the reference method in respect to accuracy and precision.
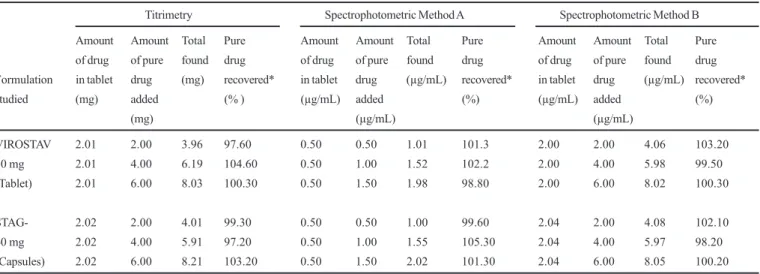
The accuracy and validity of the proposed methods were further ascertained by performing recovery studies. Pre-analysed tablet or capsule powder was spiked with pure STV at three different levels and the total was found by the proposed methods. Each determination was repeated three times. The recovery of the pure drug added was quantitative and revealed that co-formulated substances such as talc, starch, gum acacia, lactose, sodium alginate, magnesium stearate, calcium carbonate, calcium gluconate and calcium dihydrogenorthophosphate did not interfere in the determination. The results of recovery study are compiled in Table IV.
CONCLUSIONS
Three useful micro methods for the determination of STV have been developed and validated. The methods are simple and rapid taking not more than 10-15 min for the assay. The titrimetric method is the first ever proposed for stavudine and is applicable over range 1.5 to 10.0 mg. Both the spectrophotometric methods are more sensitive than the existing UV and HPLC methods and are free from such experimental variables as heating or extraction step. The methods rely on the use of simple and cheap chemicals and techniques but provide a sensitivity comparable to that
TABLE III - Results of determination of stavudine in formulations and statistical comparison with the literature method
% Found* ± SD
Brand name# Nominal Literature Titrimetry Method A Method B
amount (mg) method
VIROSTAVa 30.0 99.66±0.82 100.30±1.16 100.20±1.46 99.95±0.66
(Tablets) t=1.02 t=0.75 t=0.62
F=2.00 F=3.17 F=1.54
40.0 99.91±0.56 100.30±0.45 98.62±1.01 100.10±1.02
t=1.21 t=2.60 t=0.38
F=1.55 F=3.25 F=3.32
STAGb 30.0 102.3±0.51 101.60±0.39 101.95±1.02 100.60±1.16
(Capsules) t=2.46 t=0.72 t=0.57
F=1.71 F=4.00 F=5.17
40.0 100.5±0.62 101.10±0.55 99.95±1.32 101.90±1.33
t=1.61 t=0.90 t=2.27
F=1.27 F=4.53 F=4.60
achieved by sophisticated and expensive technique like HPLC. Thus, they can be used as alternatives for rapid and routine determination of bulk sample and tablets.
RESUMO
Uso de cloramina-T e de dois corantes na determina-ção sensível de estavudina em medicamentos
Descrevem-se três novos métodos para o ensaio de estavudina (STV) na matéria-prima e nas formulações utilizando-se clroamina-T (CAT) e dois corantes, alaranjado de metila e índigo carmim como reagentes. A titulação envolve o tratamento de STV com excesso medi-do de CAT em meio de ácimedi-do clorídrico, e, quanmedi-do a oxi-dação se completar, o oxidante que não reagiu é determi-nado iodometricamente. Os métodos espectrofotométricos compreendem a adição de excesso conhecido de CAT ao STV em ácido clorídrico, seguida da determinação do oxidante residual por meio da reação com quantidade fi-xada de alaranjado de metila, medindo-se a absorvância a 520 nm (Método A) ou índigo carmim, medindo-se a absorvância a 610 nm (Método B). Em todos os métodos, a quantidade de CAT que reagiu corresponde à quantida-de quantida-de STV. No método titulométrico, a reação segue a estequiometria 1:1 (STV:CAT) e é aplicável na faixa de 1,5 a 10 mg de STV. Nos métodos espectrofotométricos, a absorvância aumenta linearmente com a concentração de STV. Os sistemas obedecem a lei de Beer nos intervalos de 0,2 a 2,0 mg/mL e 1,0 a 10,00 mg/mL para os métodos A e B, respectivamente, e os valores de sensibilidade de Sandell correspondentes são 0,004 e 0,015 µg/cm2. Os
li-mites de detecção e de quantificação são apresentados para ambos os métodos. A precisão e a exatidão intra-dia e inter-dia dos métodos desenvolvidos são avaliadas de acordo com as normas ICH. Os métodos foram aplicados com êxito aos ensaios de STV em comprimidos e em cáp-sulas e os resultados foram comparáveis com aqueles ob-tidos com o método de referência, utilizando-se o teste t de Student e o teste F. Não se observou interferência dos adjuvantes comuns em comprimidos. A exatidão e a confiabilidade dos métodos foram ajustadas por meio de experimentos de recuperação via método de adição de padrão.
UNITERMOS: Estavudina. Titulometria. Espectrofoto-metria. Cloramina-T.
REFERENCES
BASSETT, J.; DENNEY, R. C.; JEFFERY, G. H.;
MENDHAM, J. Vogel’s text book of quantitative
inorganic analysis. London: Longman Group Ltd., 1978. p.376.
BEZY, V.; MORIN, P.; COURBE, P.; LELEU, G. AGROFOGLIO, L. Simultaneous analysis of several antiretroviral nucleosides in rat-plasma by high performance liquid chromatography with uv using acetic acid/hydroxylamine buffer. J. Chromatogr. B., v.821, p.132-143, 2005.
BERKA, A.; VULTERIN, J., ZYKA, J. Newer redox titrants. London: Pergamon Press,1965. p.38.
TABLE IV - Recovery of a standard STV solution added to samples and analysed by the proposed methods
Titrimetry Spectrophotometric Method A Spectrophotometric Method B
Amount Amount Total Pure Amount Amount Total Pure Amount Amount Total Pure
of drug of pure found drug of drug of pure found drug of drug of pure found drug
Formulation in tablet drug (mg) recovered* in tablet drug (µg/mL) recovered* in tablet drug (µg/mL) recovered*
studied (mg) added (% ) (µg/mL) added (%) (µg/mL) added (%)
(mg) (µg/mL) (µg/mL)
VIROSTAV 2.01 2.00 3.96 97.60 0.50 0.50 1.01 101.3 2.00 2.00 4.06 103.20
30 mg 2.01 4.00 6.19 104.60 0.50 1.00 1.52 102.2 2.00 4.00 5.98 99.50
(Tablet) 2.01 6.00 8.03 100.30 0.50 1.50 1.98 98.80 2.00 6.00 8.02 100.30
STAG- 2.02 2.00 4.01 99.30 0.50 0.50 1.00 99.60 2.04 2.00 4.08 102.10
40 mg 2.02 4.00 5.91 97.20 0.50 1.00 1.55 105.30 2.04 4.00 5.97 98.20
(Capsules) 2.02 6.00 8.21 103.20 0.50 1.50 2.02 101.30 2.04 6.00 8.05 100.20
COMPAIN, S.; SCHLEMMER, D.; LEVI, M.; PRUVOST, A.; GOUJARD, C.; GRASSI, J., BENECH, H. Development and validation of a liquid chromatographic/ tandem mass spectrometric assay for the quantitation of nucleoside HIV reverse transcriptase inhibitors in biological matrices. J. Mass Spectrom., v.40, p.9-18, 2005.
CONTRERAS, J.; GONZALEZ, H.; MENENDEZ, R., LOPEZ, M. Development and validation of a reversed phase liquid chromatographic method for the analysis of D and T (stavudine) in rat plasma. J. Chromatogr B., v.801, p.199-203, 2004.
DJURDJEVIC, P.; LABAN, A.; MARKOVIC, S., JELIKIK-STANKOV, M. Chromometric optimization of a RP-HPLC method for the simultaneous analysis of abacavir, lamivudine and zidovudine in tablets. Anal. Lett., v.37, p.2649-2667, 2004.
DUNGE, A.; SHARDA, N.; SINGH, B., SINGH, S. Establishment of inherent stability of stavudine and development of a validated stability-indicating HPLC assay method. J. Pharm. Biomed. Anal., v. 37, p. 1115-1119, 2005.
FAN, B.; BARTLETT, M. G.; STEWART, J. T. Determination of lamivudine/stavudine/efavirenz in human serum using liquid chromatography/electrospray tandem mass spectrometry with ionization polarity switch.
Biomed. Chromatogr., v.16, p.383-389, 2002.
FAN, B., STEWART, J. T. Determination of stavudine/ didanosine/saquinavir and stavudine/didanosine/efavirenz in human serum by micellar electrokinetic chromatography. J. Liq. Chromatogr. Rel. Technol., v.25, p.937-947, 2002.
HUANG, Y.; ZURLINDEN, E.; LIN E.; LI, X.; TOKUMOTO, J.; GOLDEN, J.; MURR, A.; ENGSTORM, J., CONTE, J. Liquid chromatographic-tandem mass spectrometric assay for the simultaneous determination of didanosine and stavudine in human plasma, Branchoalveolar lavage fluid, alveolar cells, periphera blood mononuclear cells, seminal plasma, cerebrospinal fluid and tonsil tissue. J. Chromatogr. B., v. 799 p. 51-61, 2004.
INTERNATIONAL CONFERENCE ON HARMO-NIZATION OF TECHNICAL REQUIREMENTS FOR REGISTRATION OF PHARMACEUTICALS FOR HUMAN USE. ICH Harmonised Tripartite Guideline. Validation of Analytical Procedures: Text and Methodology Q2(R1). Complementary Guideline on Methodology. London: [s.n.], 1996.
KAUL, N.; AGARAWAL, H.; PARADKAR, A. R.; MAHADIK, K. R. The ICH guidance in practice: stress degradation studies on stavudine and development of a validated specific stability-indicating HPTLC assay method. J. Chromatogr. Sci., v. 43, p.406-415, 2005.
MERCK INDEX. 12th ed. White House Station: Merck and
Co. Inc, 1996. p.1502.
PAI, N. R.; DESAI, A. S. Simultaneous estimation of some antiretroviral drugs from tablets by reverse phase HPLC method. Indian Drugs, v. 40, p.111-114, 2003.
PEREIRA, E. A.; MICKE, G. A.; TAVARES, M. F. M. Determination of antiretroviral agents in human serum by capillary electrophoresis. J. Chromatogr. A., v.1091, p. 169-176, 2005.
RAICES, R. S. L.; SALVADORI, M. C.; ESTRELA, R. C. E.; DEAQUIN NETO, F. R., SQUREZ-KURTZ, G. Determination of stavudine in human serum by on-line solid-phase extraction coupled to HPLC with electrospray ionization tandem mass spectrometry: application to a bioequivalence study. Rapid commun. Mass. Spectro., v.17, p. 1611-1618, 2003.
REZK, N. L.; TIDWELL, R. R.; RICHARD, R.; KASHUBA, A. D. M. Simultaneous determination of six HIV nucleoside analogue reverse transcriptase inhibitors and nevirapine by HPLC with ultraviolet absorbance detection. J. Chromatogr B., v.791, p. 137-147, 2003.
SABLON, M.; CONTRERAS, J.; DIAZ, O.; PEREZ, R.; VELEZ, H.; RODRIGUEZ-TANTY, C. Quantification of an antiviral drug (d 4T) by an HPLC procedure. Acta Pharma. Bonaeresse,. v.23, p.81-88, 2004.
SANKAR, D. G.; REDDY, M. V. V. N.; KUMAR, J. M. R.; MURTHY, T. K. Spectrophotometric determination of lamivudine and stavudine. Indian J. Pharm. Sci., v. 64, p.504-506, 2002.
SARMA, C. S. N.; SASTRI, C. K.; SASTRY, C. S. P. Simple oxidimetric methods for determination of stavudine or lamivudine. Asian J. Chem., v.14, p.683-690, 2002.
SARMA, C. S. N.; SASTRI, C. K.; SASTRY, C. S. P. Determination of stavudine and lamivudine by visible spectrophotometry. Acta Ciencia Indica Chem., v.28, p.221-225,2002.
SOLDIN, S. J. Anti-retroviral analysis by mass spectrometry. PCT Int Appl Patent No Wo 2004089182, 2004.
TRAN, T. T.; ROBBINS, B. L.; PINKERTON, F. H.; FERRUA. B.; GRASSI, J.; FRIDLAND, A. A new sensitive cartridge-RID method for determination of stavudine (D 4 T) triphosphate in human cells in vivo.
Antiviral Res., v.58, p.125-129, 2003.
UNITED STATES PHARMACOPEIA. United States Pharmacopeial Convention Inc. Rockville: 2006. p. 2005-2007.
VERWEIJ-VAN WISSEN, C. P. W. G. M.; AARNOUTSE, R. E.; BURGER, D. M. Simultaneous determination of the HIV nucleoside analogue reverse transcriptase inhibitors lamivudine, didanosine, stavudine, zidovudine and abacavir in human plasma by reverse phase HPLC.
J. Chromatogr. B., v.816, p.121-129, 2005.
VOLOSOV, A.; ALEXANDER, C.; TING, L.; SOLDIN, S. J. Simple rapid method for quantification of antiretrovirals by liquid chromatography-tandem mass spectrometry.
Clin. Biochem., v.35, p.99-103, 2002.
WANKHEDE, S. B.; GUPTHA, K. R.; WADODKAR, S. G. Simultaneous high performance thin layer chromatographic estimation of lamivudine and stavudine in tablet dosage forms. Indian J. Pharm. Sci., v. 67, p.96-97, 2005.
WIESNER, J. L.; SUTHERLAND, F. C. W.; SMIT, M. J.; VAN ESSEN, G. H.; HUNDT, H. K. L.; SWART, K. J.; HUNDT, A. F. Sensitive and rapid liquid-chromatography-tandem mass spectrometry method for the determination of stavudine in human plasma. J. Chromatogr. B., v.773, p.129-134,2002.
ZHANG, M.; CEN, J. Determination of stavudine and its related substances by HPLC. Zhongguo Yiyao Gongye Zazhi v.34, p.402-403, 2003.