A
rt
ic
le
0103 - 5053 $6.00+0.00
*e-mail: [email protected]
Seasonal Variability of Essential Oils of
Eugenia uniflora
Leaves
Deomar P. Costa,a Suzana C. Santos,a José C. Seraphinb and Pedro H. Ferri*,a
aInstituto de Química and bInstituto de Matemática e Estatística,
Universidade Federal de Goiás, CP 131, 74001-970 Goiânia-GO, Brazil
A influência sazonal na composição química dos óleos essenciais das folhas de Eugenia uniflora de um biótipo de cor de fruto vermelho-alaranjado indicou a presença de dois grupos de óleos em relação às duas estações do Cerrado brasileiro. O grupo I incluiu amostras coletadas na estação seca (abril-setembro), caracterizadas por conterem as mais altas percentagens de espatulenol (10%) e óxido de cariofileno (4,1%). No grupo II, com amostras coletadas na estação úmida (outubro-março), o constituinte majoritário foi o epóxido de selina-1,3,7(11)-trien-8-ona (29%). A correlação canônica indicou que o espatulenol e o óxido de cariofileno apresentaram um forte relacionamento com o balanço de nutrientes (S, Ca, Fe) e os fenólicos foliares, enquanto o epóxido de selina-1,3,7(11)-trien-8-ona foi correlacionado ao conteúdo de K, Cu, Mn e a precipitação nos meses da estação úmida. Os sesquiterpenos oxigenados predominaram em todas as amostras e a variação química nos óleos essenciais parece ser determinada pelo ambiente com uma clara influência sazonal.
Seasonal influence on the chemical composition of essential oils of Eugenia uniflora leaves with red-orange fruit colour biotype has indicated the presence of two oil clusters in the two seasons of the Brazilian Cerrado. Cluster I included samples collected during dry months (April-September) which were characterized by the highest percentages of spathulenol (10%) and caryophyllene oxide (4.1%). In cluster II, whose samples were collected during wet months (October-March), the major constituent was selina-1,3,7(11)-trien-8-one epoxide (29%). The canonical correlation indicated that spathulenol and caryophyllene oxide revealed a strong relationship with the phenolics and nutrient balance (S, Ca, Fe) in leaves, whereas selina-1,3,7(11)-trien-8-one epoxide was related to K, Cu, Mn, and precipitation during the months of the wet season. Oxygenated sesquiterpenes were predominant in all the sampling months and the oil chemovariation observed might be environmentally determined by a clear seasonal influence.
Keywords:Eugenia uniflora, Myrtaceae, essential oil, seasonal influence, principal component analysis, canonical correlation analysis
Introduction
Eugenia uniflora L. (Myrtaceae) is a Brazilian shrubby tree with edible cherry-like fruits which is locally known as “pitangueira”. Its leaves have been used in folk medicine for the treatment of diarrhea,1,2 inflammation,1 hyperglycemia,
hyperlipidemia, hypertriglycemia,3,4 and hypertension.
In addition, they have been used as an antimalarial5-7
and spasmolytic agent6,8 as well as an inhibitor of DNA
polymerase, maltase, sucrase, and α-glucosidase.4,9
Phytochemical studies have mainly focused on the essential oil and polyphenolic constituents of the leaf.9-16
Antimicrobial activities have been reported for essential oils
and expressed juice, including bacterial and dermatophyte isolates.17-19
Previous studies have identified the ellagitannin oenothein B as responsible for the inhibition of 60 kDa heat-shock protein (HSP60) and (1,3)-β-glucan synthase (Pbfks1) transcript of Paracoccidioides brasiliensis,20
the etiological agent of one of the most prevalent human systemic mycosis in Latin America.21 In addition, the
yeast phase of P. brasiliensis was inhibited by non-polar fractions of the ethanolic extract of E. uniflora leaves.22
previously identified in the essential oils of E. uniflora.11,13-16
In another study, the essential oil from leaves of the red-orange fruit colour biotype of E. uniflora, which is rich in 1,3,7(11)-trien-8-one and selina-1,3,7(11)-trien-8-one epoxide, has also inhibited the yeast phase of P. brasiliensis based on minimal fungicide concentration.22
The aim of this study was to investigate the chemical constituents of the essential oils of E. uniflora leaves with red-orange fruit colour biotype in order to confirm the existence of environmental influence on this species. For this purpose, essential oils from mature leaves of the representative population with red-orange fruit colour biotype were analyzed by GC-MS on a monthly basis during two years. To study chemical variability, volatile constituents were submitted to Principal Component, Cluster, and Canonical Discriminant analyses to detect the pattern distribution of samples and to identify which constituents are able to distinguish between these groups of samples. In addition, mineral nutrients and phenolic foliars as well as climatic factors for each season were analyzed via
Canonical Correlation analysis. The results obtained will possibly contribute to an understanding of the antifungal activity of this biotype against P. brasiliensis.
Results and Discussion
Seasonal influence on the essential oil constituents of E. uniflora leaves was observed for samples with red-orange fruit colour biotype,23 which were collected on a
monthly basis for two years. A total of 15 constituents were identified, accounting for 80-95% of volatile constituents (Table 1). The essential oils were predominantly composed of oxygenated sesquiterpenes (78-93%), reaching the highest amounts during the wet season (85-93%). Essential oils of E. uniflora have shown that, although the main constituent may vary, sesquiterpenes are usually the dominant class.11,13-16,24 Nevertheless, leaf oils from plants
growing in Argentina whose main constituents were the monoterpenes pulegone, carvone, limonene, and the sesquiterpene nerolidol have been described.10,12
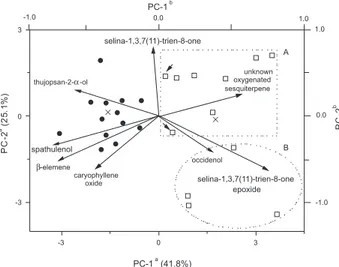
The results obtained from PCA and Cluster analysis
via Ward’s technique (25 samples × 16 variables = 400 data) have revealed the existence of a high chemical variability throughout the months of data collection. Figure 1 shows the relative position of the sampling months in the discriminant space in relation to a diaxial system originated in the PCA. First PC accounts for ca. 42% of total variance and discriminates well above the 99% confidence level the samples collected in the dry (April-September; average precipitation of 47.8 mm) and in the wet (October-March;
average precipitation of 200.8 mm) seasons. In addition, the Second PC mainly separates samples with the highest selina-1,3,7(11)-trien-8-one contents (46 ± 4%), which occurred in the wet months with the highest pluviosity (217.3 mm), from the others.
Therefore, two types of leaf oils were found: cluster I included samples collected during the dry season and was characterised by the highest percentage of spathulenol (10 ± 1%), caryophyllene oxide (4.0 ± 1.6%), β-elemene (1.4 ± 0.4%), and thujopsan-2α-ol (0.85 ± 0.41%); cluster II included samples collected during the wet season and revealed selina-1,3,7(11)-trien-8-one epoxide (29 ± 7%), occidenol (0.70 ± 0.14%), and the unknown oxygenated sesquiterpene (0.27 ± 0.21%) as principal constituents. In the present case, the wet sampling months can be separated
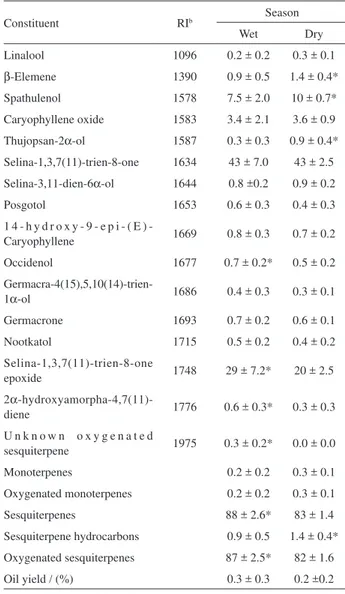
Table 1. Percentagesa of essential oil constituents of E. uniflora leaf oil samples of red-orange fruit colour biotype collected during wet and dry seasons in the Brazilian Cerrado
Constituent RIb Season
Wet Dry
Linalool 1096 0.2 ± 0.2 0.3 ± 0.1
β-Elemene 1390 0.9 ± 0.5 1.4 ± 0.4*
Spathulenol 1578 7.5 ± 2.0 10 ± 0.7*
Caryophyllene oxide 1583 3.4 ± 2.1 3.6 ± 0.9
Thujopsan-2α-ol 1587 0.3 ± 0.3 0.9 ± 0.4*
Selina-1,3,7(11)-trien-8-one 1634 43 ± 7.0 43 ± 2.5
Selina-3,11-dien-6α-ol 1644 0.8 ±0.2 0.9 ± 0.2
Posgotol 1653 0.6 ± 0.3 0.4 ± 0.3
1 4 h y d r o x y 9 e p i ( E )
-Caryophyllene 1669 0.8 ± 0.3 0.7 ± 0.2
Occidenol 1677 0.7 ± 0.2* 0.5 ± 0.2
Germacra-4(15),5,10(14)-trien-1α-ol 1686 0.4 ± 0.3 0.3 ± 0.1
Germacrone 1693 0.7 ± 0.2 0.6 ± 0.1
Nootkatol 1715 0.5 ± 0.2 0.4 ± 0.2
Selina-1,3,7(11)-trien-8-one
epoxide 1748 29 ± 7.2* 20 ± 2.5
2α-hydroxyamorpha-4,7(11)-diene 1776 0.6 ± 0.3* 0.3 ± 0.3
U n k n o w n o x y g e n a t e d
sesquiterpene 1975 0.3 ± 0.2* 0.0 ± 0.0
Monoterpenes 0.2 ± 0.2 0.3 ± 0.1
Oxygenated monoterpenes 0.2 ± 0.2 0.3 ± 0.1
Sesquiterpenes 88 ± 2.6* 83 ± 1.4
Sesquiterpene hydrocarbons 0.9 ± 0.5 1.4 ± 0.4*
Oxygenated sesquiterpenes 87 ± 2.5* 82 ± 1.6
Oil yield / (%) 0.3 ± 0.3 0.2 ±0.2
in subcluster IIA, mainly constituted by months of the wettest year (2002), which was characterized by a high percentage of selina-1,3,7(11)-trien-8-one (46 ± 4%); and in subcluster IIB (mainly the wet months of 2003, when the pluviosity was lower) with selina-1,3,7(11)-trien-8-one epoxide (37 ± 5%) as its principal constituent.
In order to assimilate the overall trend in volatile leaf oils and to reduce the uncontrolled factors affecting quantitative variations, the constituent data was also coded as independent single characters (either present or absent), according to a recommendation by Sneath and Sokal.25
Multiple Correspondence analyses revealed a similar chemical distinction between the sampled months. Cluster I was clustered and cluster II was mainly split based on the up and down samples in relation to PC-2 origin, as is shown in Figure 1, although it has indicated three mismatched sampling months (data not shown).
The Canonical Discriminant analysis (CDA) confirmed the clusterings as a priori groupings. Furthermore, an axial system which originated from the CDA discriminated well above the 99% confidence level the two types of essential oils, based only on the contents of spathulenol and selina-1,3,7(11)-trien-8-one epoxide as predictor variables. The discriminant function accounts for total variability and separates cluster I from II (F-test value = 15.23; degrees of freedom, DF = 2 and 22) due to the high negative and positive scores of spathulenol (−0.90) and selina-1,3,7(11)-trien-8-one epoxide (0.85), respectively. It was possible to predict accurately ca. 92% of total well-classification in the original clusters by a cross-validation approach. The
mismatched classifications were the wet sampling months October/2002 and March/2003 of cluster II, which had been classified under cluster I. Such a misclassification could be caused by a lower level of selina-1,3,7(11)-trien-8-one epoxide in the sample, which is a feature of samples collected during the dry season.
The observed chemovariations may be correlated with the biotic pressures which could modulate sample volatiles, such as the influence of pollinators and herbivores or differences in environmental conditions.26 Seasonal
variations in monoterpene emission rates from Salvia fruticosa Mill have been described and the high emission during spring months was attributed to a self-protection mechanism of the plant’s defense from an increase in insect activity.27 Other variations include an induced response
to herbivore damage to recruit predators or herbivore parasites.28 On the other hand, several studies have reported
the effects of nutrients on essential oil biosynthesis.29
The availability of nutrients to plants may influence the concentration of oil yields and therefore modify interactions between plants and herbivores.30
The volatile constituent data (set 1), two foliar chemicals (phenolic compounds and nutrients), and climatic factor data (set 2) were jointly analyzed via Canonical Correlation analysis (CCA), a multivariate treatment that describes correlations between two sets of data (Table 2).31 The
method allows for the assessment of new variables called canonical variates (CVs) so that they exhibit the highest correlation possible between two sets of data.
CCA begins with the performance of independent PCA on each of the two sets of variables. Hence multicollinearities are removed from the variable sets. The resulting components are rotated to establish the weights for each variable, in order to produce maximum correlation between linear combinations of variables from both data sets. The canonical weights are standardized coefficients and their magnitudes may be used to determine with which original variables a canonical correlation is predominantly associated. However, as canonical coefficients may be subject to multicollinearity and thus lead to incorrect judgments, correlations of the original variables with the CVs, known as canonical loadings or structure correlation coefficients, have been used to explain the latter. Similarly to PCA, CVs are uncorrelated with each other whereas eigenvalues are approximately equal to the squares of the canonical correlations and reflect the proportion of variance explained by each canonical correlation relating two sets of variables.
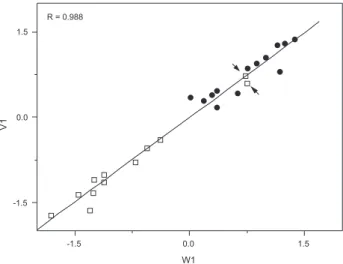
CCA results (Table 2) revealed that the first axis of volatile constituent data (set 1) was highly correlated with the first axis of foliar and climatic factors (set 2). Indeed, the first pair of canonical variates (V1 and W1) was correlated;
their canonical correlation coefficient was equal to 0.988 and the amount of variance accounted for 97.5%. Since the
P-value of the first pair of CVs was lower than 0.01, the considered data sets were statistically correlated at the 99% confidence level by Wilks’ multivariate lambda test and may be used to interpret the relationship between variables.
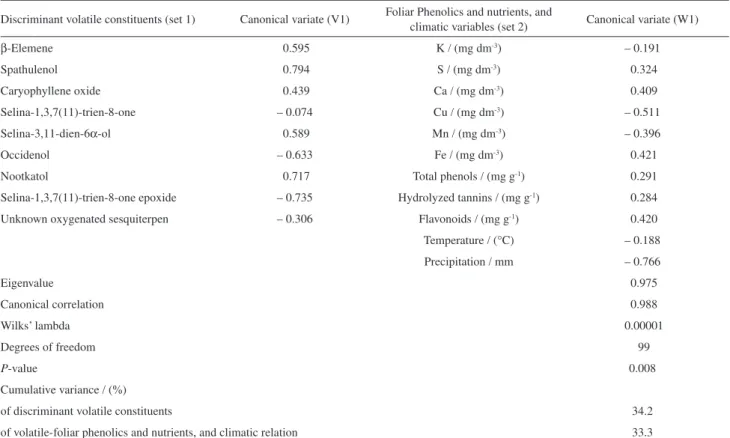
In Table 2, when the signs and magnitude of the structure correlation coefficients are assessed, it may be concluded that an increase in the value of the first CV is associated with an increased in β-elemene, spathulenol, caryophyllene oxide, selina-3,11-dien-6α-ol, occidenol, and nootkatol from set 1, and foliar phenolics (flavonoids, hydrolyzed tannins, and total phenols) and mineral nutrients (S, Ca, and Fe) from set 2. On the other hand, this increase in the value of the first CV is highly associated with a decrease of occidenol, selina-1,3,7(11)-trien-8-one epoxide, and an unknown oxygenated sesquiterpene from the first set and of foliar mineral nutrients (Cu and Mn) and precipitation from the second set. Therefore, the first CV mainly describes sesquiterpene variation, mineral balance, and phenolic contents in leaves in response to the environmental pressure during seasons.
The canonical correlation plot (Figure 2) shows the first canonical correlation. The points indicate the canonical scores of each case (sampling months) based on case scores
for each of the two CVs. When canonical correlation is high, the points will form two clusters at different points on the regression line. In fact, Figure 2 shows that the first pair of CVs discriminated months according to the season. The coldest and driest sampling months related to winter (cluster I) were located on the right side of the regression line (positive CV values), whereas sampling months related to hot and humid summer (cluster II) were located on the left side of the regression line (negative CV values).
The observed positive and negative correlation coefficients between volatile constituents and metal ions are in agreement with the effects of foliar application of micronutrient fertilizers containing Zn and Mn on cumin oils.29 Additionally, micronutrient effects should
be associated with a requirement for sesquiterpene synthases for a divalent metal ion as cofactor, which have also influenced the number of by-products obtained in these reactions.32 Other studies have also revealed that
the contents of the majority of volatile constituents varied significantly in different seasons,33 including Cerrado
species such as Lychnophora and Baccharis.34 As regards
foliar phenolic distributions, we found correlations with discriminant volatile constituents of the dry season. An explanation for this correlation is that phenolics, especially flavonoids, were protecting leaves by acting as antioxidants
Table 2. Canonical correlation summary of volatile constituents, phenolics and nutrients from leaves, and climatic factors with their canonical variates
Discriminant volatile constituents (set 1) Canonical variate (V1) Foliar Phenolics and nutrients, and
climatic variables (set 2) Canonical variate (W1)
β-Elemene 0.595 K / (mg dm-3) – 0.191
Spathulenol 0.794 S / (mg dm-3) 0.324
Caryophyllene oxide 0.439 Ca / (mg dm-3) 0.409
Selina-1,3,7(11)-trien-8-one – 0.074 Cu / (mg dm-3) – 0.511
Selina-3,11-dien-6α-ol 0.589 Mn / (mg dm-3) – 0.396
Occidenol – 0.633 Fe / (mg dm-3) 0.421
Nootkatol 0.717 Total phenols / (mg g-1) 0.291
Selina-1,3,7(11)-trien-8-one epoxide – 0.735 Hydrolyzed tannins / (mg g-1) 0.284
Unknown oxygenated sesquiterpen – 0.306 Flavonoids / (mg g-1) 0.420
Temperature / (°C) – 0.188
Precipitation / mm – 0.766
Eigenvalue 0.975
Canonical correlation 0.988
Wilks’ lambda 0.00001
Degrees of freedom 99
P-value 0.008
Cumulative variance / (%)
of discriminant volatile constituents 34.2
and a higher concentration was required to protect leaves from abiotic stresses.35
Our results may support the presence of a chemotypic seasonal variation for E. uniflora leaf oil due to the significant differences in the chemical composition between the two Cerrado seasons. The literature data combined with our results led us to deduce that the chemotype growing in Northeastern Brazil and Nigeria, which presented high contents of 1,3,7(11)-trien-8-one and selina-1,3,7(11)-trien-8-one epoxide, could be the most common red-orange fruit colour biotype of these regions.13,15 The
chemical composition of oils from Nigeria is similar to those of our study, although the content of selina-1,3,7(11)-trien-8-one (17-17.8%) and selina-1,3,7(11)-selina-1,3,7(11)-trien-8-one epoxide (14%) was lower than that of our samples.11,15 In
addition, the absence of curzerene and atractylone in our samples revealed a marked deviation from previous leaf oil investigations.11,15 The last chemical constituents were
only identified in our data collection by SIM-GC/MS. Oil constituents such as pulegone, carvone, α-selinene, and nerolidol, all of which were identified in E. uniflora
essential oils collected in Argentina,10 were not detected
in our oil samples. Thus, our results suggest a possible chemical speciation in the sampled plants which could be attributed to different ecotypes.34
Two other essential oil chemotypes of the plant have been reported: the chemotype growing in Southern Brazil that contained α- and β-selinene, and nerolidol;12 and the
chemotype growing in Argentina whose main constituents were monoterpenes and the sesquiterpene nerolidol.10 These
chemical data could be confirmed by genetic studies based on nuclear and chloroplastic DNA markers,36 which indicate
that a more restricted gene flow may exist between the populations of E. uniflora from Southern Brazil and those from Northeastern and Southeastern Brazil.
The chemical polymorphism observed in this E. uniflora
chemotype could be caused by seasonal and ecological variation patterns in the leaf essential oil associated with the red-orange fruit colour biotype. The knowledge of plasticity in the essential oil among populations of E. uniflora could contribute to the herb’s medicinal value against P. brasiliensis.
Conclusions
The leaf essential oil of E. uniflora with red-orange fruit colour biotype grown in the Brazilian Central Cerrado revealed a selina-1,3,7(11)-trien-8-one/selina-1,3,7(11)-trien-8-one epoxide chemotype whose chemical polymorphism could be attributed to seasonal and ecological variations.
Experimental
Plant material
E. uniflora samples were collected on a monthly basis between December 2001 and December 2003 in the vicinities of Anápolis (S 16° 20´ 13´´; W 48° 56´ 19´´; 1034 m), Goiás State, Brazil. The plant was identified by Professor Heleno Dias Ferreira of the Department of General Biology, Universidade Federal de Goiás (UFG), Goiás State, Brazil. Voucher specimen is deposited at the UFG Herbarium (code number 25477).
In order to assess the chemical composition of oils, the aerial parts of two individual plants of the same age were collected from their original natural habitat and dried at room temperature for 7 days at 30 °C until constant weight. After having been powdered, the dried phytomass (30 g) was submitted to hydrodistillation (2 h) using a modified Clevenger-type apparatus. At the end of each distillation the oils were collected and dried with anhydrous Na2SO4, transferred to glass flasks, and kept at a temperature of −18 °C. Oil yields (%) were based on the dried weight of plant samples.
Chemical analysis
Oil sample analyses were performed on a GC-MS Shimadzu QP5050A instrument under the following conditions: a CBP-5 (Shimadzu) fused silica capillary column (30 m × 0.25 mm i.d., 0.25 µm film thickness) connected to a quadrupole detector operating in the EI
mode at 70 eV with a scan mass range of 40-400 m/z at a sampling rate of 1.0 scan s-1; carrier gas: He (1 mL min-1);
injector and interface temperatures of 220 °C and 240 °C, respectively, with a split ratio of 1:20. The injection volume was 0.4 µL (20% in hexane) and the oven temperature was raised from 60 °C to 246 °C, with an increase of 3 °C min-1,
then 10 °C min-1 to 270 °C, holding the final temperature
for 5 min. Selected Ion Monitoring (SIM) was performed in the same conditions of scan analyses. Volatile constituents were identified by comparing their Kovats retention indexes (RI),37 by co-injection with a C
8-C32 n-alkanes series, 38 mass
spectra with those of the literature,37 and computerised
MS-database using NIST libraries.
Foliar phenolics (flavonoids, tannins, and phenols) were determined using spectrophotometric assays.39 Nutrient
in leaves (K, Ca, Mg, N, P, S, Cu, Zn, Mn, and Fe) were determined by applying the usual methods.40
Chemical variability
Principal Component analysis (PCA) was applied to examine the interrelationships between populations and their essential oil constituents, via Système Portable d’Analyse des Données Numériques-SPAD.N software package, version 2.5, Centre International de Statistique et d’Informatique Appliquées, France (1994). Cluster analysis was also applied to the study of sample similarity on the basis of essential oil constituent distribution. Nearest neighbour complete linkage technique by Benzécri algorithm was used as an index of similarity and hierarchical clustering was performed according to Ward’s variance minimizing method.41 Prior to
the multivariate analysis, the data was preprocessed by means of auto-scaling and mean centering.
Canonical Discriminant analysis via SAS CANDISC (Statistical Analysis System, SAS Institute Inc., Cary, NC, 1996) was used to differentiate samples and clusters on the basis of oil composition. The predictive ability of canonical discriminant functions was evaluated by cross-validation, leaving one group approach as implemented in SAS statistical package.
Oil constituent data (set 1), mineral and phenolic foliars, and climatic factor data (set 2) relationships were obtained via Canonical Correlation analysis using the SAS CANCORR procedure. The magnitude of structure correlation coefficients (canonical loadings) was used to explain canonical variates. The predictive ability was assessed by canonical redundancy analysis with standardized variance coefficients.
Average multiple comparisons were established by ANOVA using SAS GLM analyses. All data were checked for homoscedasticity by Hartley’s test. This test revealed
significant deviation from the basic assumption for the oil component germacra-4(15),5,10(14)-trien-1α-ol (Table 1), which was arcsine transformed, and for spathulenol, 8-one, and selina-1,3,7(11)-trien-8-oneepoxide, which were rank-transformed. Whenever a difference was established, a post-hoc Tukey test was performed. Results are shown as mean values and are joined by standard deviation in some cases. P-values less than 0.05 were considered significant.
Acknowledgments
The authors are indebted to CNPq, PADCT III, and FUNAPE/UFG for financial support; to CAPES for granting a fellowship to Deomar P. Costa. We are also indebted to Prof. Heleno D. Ferreira of the Department of General Biology, ICB/UFG, for the botanical identification.
Supplementary Information
GC-MS chromatograms of representative essential oils, phenolics, and nutrients from E. uniflora leaves showing seasonal influence are available free of charge at http://jbcs.sbq.org.br as PDF file.
References
1. Schapoval, E. E. S.; Silveira, S. M.; Miranda, M. L.; Alice, C. B.; Henriques, A. T.; J. Ethnopharmacol.1994, 44, 137. 2. Almeida, C. E.; Karnikowski, M. G. O.; Foleto, R.; Baldisserotto,
B.; Rev. Saude Publ.1995, 29, 428.
3. Ferro, E.; Schinini, A.; Maldonado, M.; Rosner, J.; Hirschmann, G. S.; J. Ethnopharmacol. 1988, 24, 321.
4. Arai, J.; Amagaya, S.; Komatsu, Y.; Okuda, M.; Mayashi, T.; Kasai, M.; Arisawa, M.; Momose, Y.; J. Ethnopharmacol.1999,
68, 307; Matsumura, T.; Kasai, M.; Hayashi, T.; Arisawa, M.; Momose, Y.; Arai, I.; Amagaya, S.; Omatsu, Y.; Pharm. Biol.
2000, 38, 302.
5. Consolini, A. E.; Baldini, O. A. N.; Amat, A. G.; J. Ethnopharmacol.
1999, 66, 33.
6. Morioka, K.; Nojima, H.; Kurosaki, F.; Arisawa, M.; Kuraishi, Y.; Momose, Y.; Phytomedicine2000,7, 99.
7. Agbedahunsi, J. M.; Aladesanmi, A. J.; Fitoterapia1993, 64, 174.
8. Wazlawik, E.; Silva, M. A.; Peters, R. R.; Correia, J. F. G.; Farias, M. R.; Calixto, J. B.; Ribeiro do Valle, R. M.; J. Pharm. Pharmacol.1997, 49, 433.
9. Lee, M.-H.; Nishimoto, S.; Yang, L.-L.; Yen, K.-Y.; Hatano, T.; Yoshida, T.; Okuda, T.; Phytochemistry1997, 44, 1343; Lee, M.-H.; Chiou, J.-F.; Yen, K.-Y.; Yang, L.-L.; Cancer Lett.2000,
10. Viana, M. E. L.; Retamar, J. A.; An. Soc. Cient. Argent.1971, 192, 111; Ubiergo, G.; Taher, H. A.; Talenti, E. C.; An. Asoc. Quim. Argent.1987, 75, 377.
11. Weyerstahl, P.; Marschall-Weyerstahl, H.; Christiansen, C.; Oguntimien, B. O.; Adeoye, A. O.; Planta Med.1988,54, 546. 12. Henriques, A. T.; Sobral, M. E.; Cauduro, A. D.; Schapoval, E.
E. S.; Bassini, V. L.; Lamaty, G.; Menut, C.; Bessière, J. M.;
J. Essent. Oil Res.1993, 5, 501.
13. Morais, S. M.; Craveiro, A. A.; Machado, M. I. L.; Alencar, J. W.; Mattos, F. J. A.; J. Essent. Oil Res.1996, 8, 449.
14. Maia, J. G. S.; Andrade, M. H. L.; Silva, M. H. L.; Zoghbi, M. G. B.; J. Essent. Oil Res.1999, 11, 727.
15. Ogunwande, I. A.; Olawore, N. O.; Ekundayo, O.; Walker, T. M.; Schmidt, J. M.; Setzer, W. N.; Int. J. Aromather.2005, 15, 147; 16. Melo, R. M.; Corrêa, V. F. S.; Amorim, A. C. L.; Miranda, A. L.
P.; Rezende, C. M.; J. Braz. Chem. Soc.2007, 18, 179. 17. Adebajo A. C.; Oloke K. J.; Aladesanmi A. J.; Fitoterapia1989,
60, 451; Fadeyi, M. O.; Akpan, U. E.; Phytother. Res.1989,3, 154.
18. El-Shabrawy A. O.; Bull. Fac. Pharm. Cairo Univ.1995, 33, 17.
19. Lima, E. O.; Gompertz, O. F.; Giesbrecht, A. M.; Paulo, M. Q.;
Mycoses 1993,36, 333.
20. Lima, M. M.; MSc Dissertation, Universidade Federal de Goiás, Brazil, 2001; Santos, G. D.; Ferri, P. H.; Santos, S. C.; Bao, S. B.; Soares, C. M. A.; Pereira, M.; Med. Mycol.2007, 45, 609. 21. Restrepo, A. In Principles and Practice of Infectious Diseases,
6th ed.; Mandel, G. I.; Bennet, J. F.; Dolin, R., eds.; Churchill
Livingstone: Philadelphia, 2004.
22. Santos, S. C.; Ferri, P. H.; Ribeiro, J. P; Guimarães, D. O.; Silva, M. O.; Garcia, A. C. F.; Pires, J. S.; Castro, A. C. M.; Silva, M. R. R.; Paula, J. R.; Rev. Bras. Pl. Med.2004, 7, 30.
23. Bezerra, J. E. F.; Silva Júnior, J. F.; Lenderman, I. E.; Pitanga (Eugenia uniflora L.), Série Frutas Nativas 1, Funep: Jaboticabal, 2000; Núcleo de Estudo em Fruticultura no Cerrado (http:// www.fruticultura.iciag.ufu.br/pitangueira.html, acessed in March, 2006); Raseira, M. C. B.; Raseira, A. In Documentos 171;Antunes, L. E. C.; Raseira, M. C. B., eds.; Embrapa Clima Temperado: Pelotas, Brasil, 2006.
24. Rücker, G.; Brasil e Silva, G. A.; Bauer, L.; Schikarski, M.; Planta Med.1977, 31, 322; Pino, J. A.; Bello, A.; Urquiola, A.; Aguero, J.; Marbot, R.; J. Essent. Oil Res.2003, 15, 70; Oliveira, A. L.; Lopes, R. B.; Cabral, F. A.; Eberlin, M. N.; Food Chem.2006,
99, 1.
25. Sneath, P. H.; Sokal, R. R.; Principles of Numerical Taxonomy,
A Series of Books in Biology, W.H. Freeman: San Francisco, 1963.
26. Sturgeon, K. B.; Evolution1979, 33, 803; Langenheim, J. H.;
J. Chem. Ecol.1994, 20, 1223; Figueiredo, A. C.; Barroso, J. G.; Pedro, L. G.; Scheffer, J. J. C. In Essential Oils: Basic and
Applied Research; Franz, C.; Mathe, A.; Buchbauer, G., eds.; Allured: Illinois, 1997, p. 95.
27. Arey, J.; Crowley, D. E.; Crowley, M.; Resketo, M.; Lester, J.;
Atmos. Environ.1995, 29, 2977.
28. Dicke, M.; Hilker, M.; Bas. Appl. Ecol.2003, 4, 3; Jurgens, A.; Feldhaar, H.; Feldmeyer, B.; Fiala, B.; Biochem. Syst. Ecol.2006,
34, 97.
29. El-Sawi, S. A.; Mohamed, M. A.; Food Chem.2002, 77, 75; Srivastava, R. K.; Singh, A. K.; Kalra, A.; Tomar, V. K. S.; Bansal, R. P.; Patra, D. D.; Chand, S.; Naqvi, A. A.; Sharma, S.; Kumar, S.; Ind. Crops Prod.2002, 15, 189.
30. Bryant, J. P.; Chapin, F. S. III; Reichardt, P. B.; Clausen, T. P.;
Oecologia1987, 72, 510.
31. Saporta, G.; Probabilités. Analyse des Données et Statistique, Technip: Paris, 1990; Meuzelaar, H. L. C.; Statheropoulos, M.; Huai, H.; Yun, Y. In Computer Enhanced Analytical Spectroscopy, vol. 3; Jurs, P. C., ed.; Plenum Press: New York, 1992. 32. Picaud, S.; Olofsson, L.; Brodelius, M.; Brodelius, P. E.; Arch.
Biochem. Biophys. 2005, 436, 215.
33. Hussain, A. I.; Anwar, F.; Sherazi, S. T. H.; Przybylski, R.; Food Chem.2008, 108, 986; Celiktas, O. Y.; Kocabas, E. E. H.; Bedir, E.; Sukan, F. V.; Ozek, T.; Baser, K. H. C.; Food Chem.2007, 100, 553; Angioni, A.; Barra, A.; Coroneo, V.; Dessi, S.; Cabras, P.;
J. Agric. Food Chem.2006, 54, 4364; Kofidis, G.; Bosabalidis, A.; Kokkini, S.; J. Essent. Oil Res.2006, 16, 469; Kim, J. -C.; Kim, K. -J.; Kim, D. -S.; Han, J. -S.; Chemosphere2005, 59, 1685. 34. Curado, M. A.; Oliveira, C. B. A.; Jesus, J. G.; Santos, S. C.;
Seraphin, J. C.; Ferri, P. H.; Phytochemistry2006, 67, 2363; Silva, F. G.; Oliveira, C. B. A.; Pinto, J. E. B. P.; Nascimento, V. E.; Santos, S. C.; Seraphin, J. C.; Ferri, P. H.; J. Braz. Chem. Soc.2007, 18, 990.
35. Close, D. C.; McArthur, C.; Hagerman, A. E.; Fitzgerald, H.;
Phytochemistry2005, 66, 215.
36. Salgueiro, F.; Felix, D.; Caldas, J. F.; Margis-Pinheiro, M.; Margis, R.; Diversity Distrib.2004, 10, 201.
37. Adams, R. P.; Identification of Essential Oil Components by Gas Chromatography/ Mass Spectrometry, 4th ed. Allured: Illinois,
2007.
38. van Den Dool, H.; Kratz, P. D. J. A.; J. Chromatogr. 1963, 11, 463.
39. Waterman, P. G.; Mole, S.; Analysis of Phenolic Plant Metabolites, Blackwell Scientific Publications: Oxford, 1994.
40. Silva, S. C.; Manual de Análises Químicas de Solos, Plantas e Fertilizantes, 1ª ed.; Embrapa: Brasília, Brazil, 1999.
41. Benzécri, J. P.; L´Analyse des Données: la Taxinomie, Tome 1, Dunod: Paris, 1980; Ward, J. H.; J. Am. Stat. Assoc.1963, 58, 238.
S
u
p
p
le
m
e
n
ta
ry
In
fo
rm
a
ti
o
n
0103 - 5053 $6.00+0.00
*e-mail: [email protected]
Seasonal Variability of Essential Oils of
Eugenia uniflora
Leaves
Deomar P. Costa,a Suzana C. Santos,a José C. Seraphinb and Pedro H. Ferri*,a
aInstituto de Química and bInstituto de Matemática e Estatística,
Universidade Federal de Goiás, CP 131, 74001-970 Goiânia-GO, Brazil
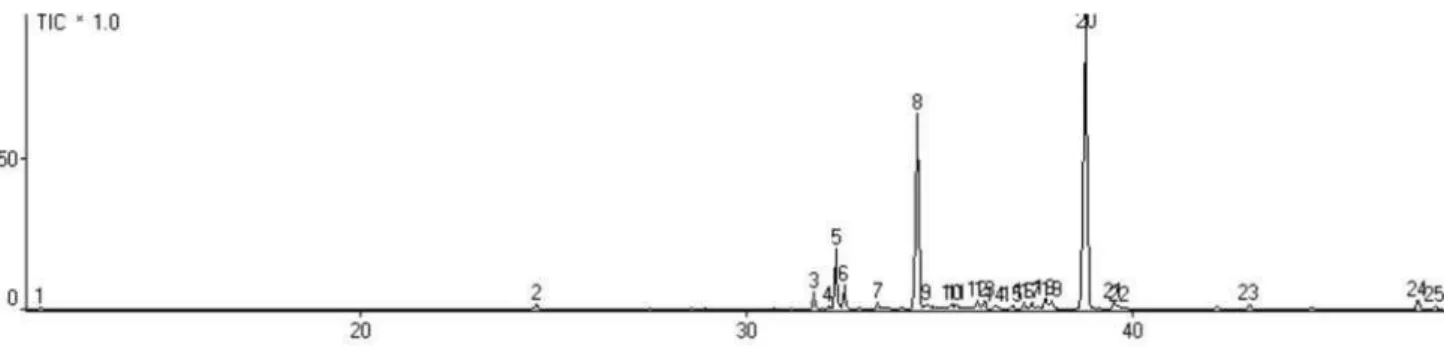
Figure S1. Total Ion Chromatogram (TIC) of essential oil from leaves of representative E. uniflora with red-orange fruit color biotype collected in the dry season.
Figure S2. Total Ion Chromatogram (TIC) of essential oil from leaves of representative E. uniflora with red-orange fruit color biotype collected in the wet season.
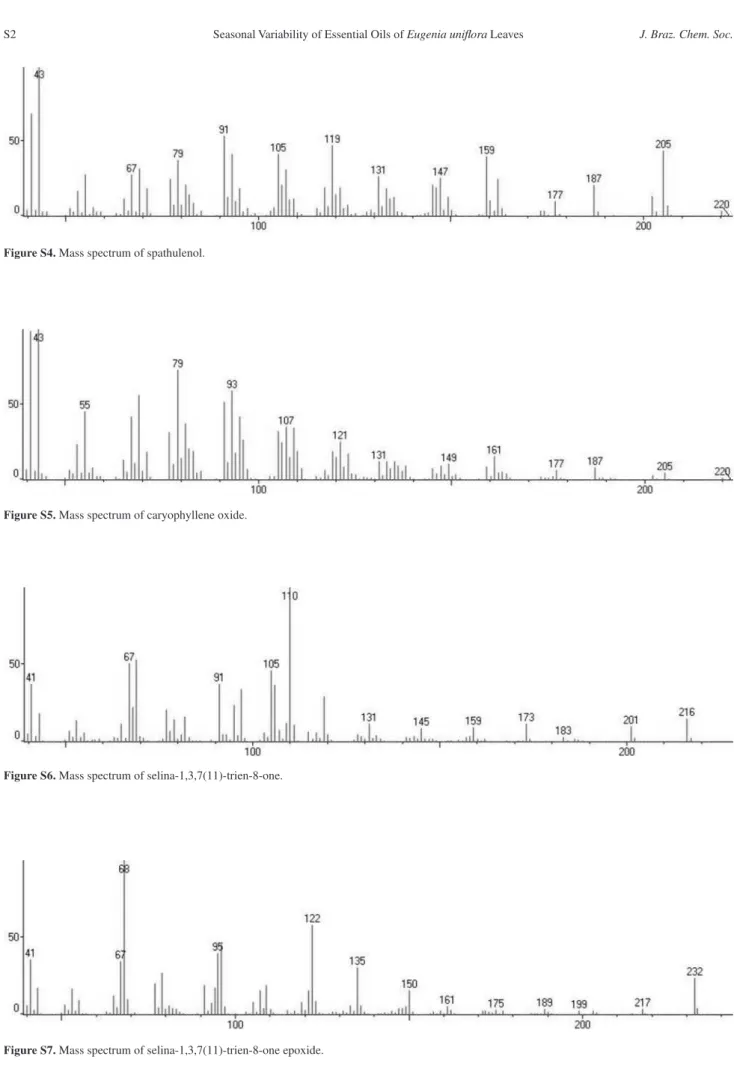
Figure S4. Mass spectrum of spathulenol.
Figure S5. Mass spectrum of caryophyllene oxide.
Figure S6. Mass spectrum of selina-1,3,7(11)-trien-8-one.
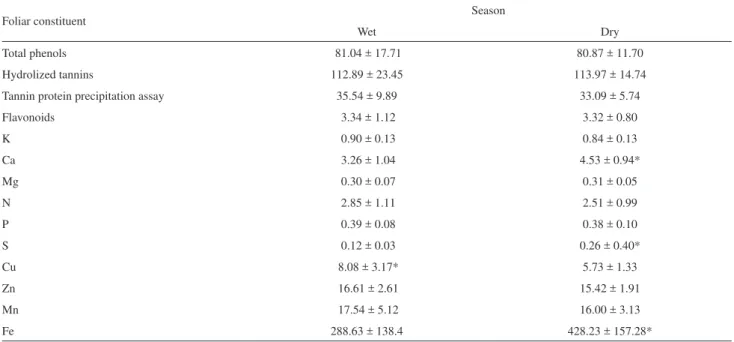
Table S1. Averagea of phenolics (mg g-1) and nutrients (mg dm-3) from E. uniflora leaves with red-orange fruit color biotype collected during wet and dry seasons in the Brazilian Cerrado
Foliar constituent Season
Wet Dry
Total phenols 81.04 ± 17.71 80.87 ± 11.70
Hydrolized tannins 112.89 ± 23.45 113.97 ± 14.74
Tannin protein precipitation assay 35.54 ± 9.89 33.09 ± 5.74
Flavonoids 3.34 ± 1.12 3.32 ± 0.80
K 0.90 ± 0.13 0.84 ± 0.13
Ca 3.26 ± 1.04 4.53 ± 0.94*
Mg 0.30 ± 0.07 0.31 ± 0.05
N 2.85 ± 1.11 2.51 ± 0.99
P 0.39 ± 0.08 0.38 ± 0.10
S 0.12 ± 0.03 0.26 ± 0.40*
Cu 8.08 ± 3.17* 5.73 ± 1.33
Zn 16.61 ± 2.61 15.42 ± 1.91
Mn 17.54 ± 5.12 16.00 ± 3.13
Fe 288.63 ± 138.4 428.23 ± 157.28*