A
r
ti
c
le
*e-mail: [email protected]
Structural, Morphological and Vibrational Properties of Titanate Nanotubes and Nanoribbons
Bartolomeu C. Viana,b Odair P. Ferreira,*,a Antonio G. Souza Filho,b
Josue Mendes Filhob and Oswaldo L. Alvesa
aInstituto de Química, Universidade Estadual de Campinas, CP 6154, 13083-970 Campinas-SP, Brazil
bDepartamento de Física, Universidade Federal do Ceará, CP 6030, 60455-900 Fortaleza-CE, Brazil
Este trabalho relata o estudo das propriedades estruturais, morfológicas e vibracionais dos nanotubos e das nanofitas de titanato obtidos a partir de estruturas bidimensionais por meio de tratamento hidrotérmico do TiO2 em solução aquosa de NaOH. As propriedades físicas destas nanoestruturas, como preparadas e tratadas termicamente, são discutidas e comparadas com seus similares “bulks” (Na2Ti3O7 e Na2Ti6O13). Os resultados obtidos por várias técnicas de caracterização nos permitem concluir que as paredes dos nanotubos e das nanofitas, como preparados, são isoestruturais ao composto Na2Ti3O7. Contudo, nos nanotubos as ligações químicas são deformadas por causa da curvatura das paredes, enquanto nas nanofitas as camadas apresentam apenas uma desordem estrutural provocada pelo efeito de tamanho. As características térmicas das nanofitas são similares àquelas observadas para os nanotubos, nos quais as mudanças estruturais e morfológicas levam para a formação de grandes bastões (bulks) com uma mistura de fase Na2Ti3O7 e Na2Ti6O13. Concluímos que os nanotubos e as nanofitas de titanato têm a mesma composição química, igual a Na2-xHxTi3O7•nH
2O (0 ≤x ≤2). Também podemos sugerir que a espectroscopia Raman pode
ser usada para uma fácil e rápida identificação das mudanças morfológicas e estruturais das nanoestruturas de titanato.
This work reports the structural, morphological and vibrational properties of titanate nanotubes and nanoribbons obtained from bidimensional structures by hydrothermal treatment of TiO2 in aqueous NaOH solutions. The physical properties of these as-synthesized and heat-treated nanostructures are discussed in comparison with their bulk (Na2Ti3O7 and Na2Ti6O13) counterparts. The results obtained from several characterization techniques allowed to conclude that the layers of both as-synthesized nanotubes and nanoribbons are isostructural to the Na2Ti3O7 compound. However, in the nanotubes, the chemical bonds are deformed because of the curvature of walls while in the nanoribbons the layers present structural disorder due only the size effects. The thermal behavior of titanate nanoribbons is similar to those observed for titanate nanotubes. When thermally treated titanate nanoribbons change to bulk with a phase mixing of Na2Ti3O7 and Na2Ti6O13. We conclude in this work that the chemical composition of both the titanate nanotubes and the nanoribbons is the same, Na2-xHxTi3O7•nH
2O (0 ≤x ≤2) and Raman spectroscopy can
be used for an easy and quick identification of both morphology and structure changes of the nanosized titanates.
Keywords: titanium oxide, titanate nanostructures, thermal treatment, phase transformation, spectroscopy
Introduction
Intensive investigations have been carried out on the physical and chemical properties of inorganic
nanosized materials in the recent years.1 Researchers are
realizing that one-dimensional nanostructures made from inorganic materials have intriguing properties different
from those of carbon nanostructures and thus have a
variety of potential applications.2,3 In particular, titanate
nanostructures have received a great deal of attention, in part because titanate nanomaterials have a large surface area that leads to a wide variety of applications, including secondary lithium batteries, dye sensitized solar cells,
photocatalysts, and sensors.4-7 Titanate nanotubes have
degrading textile dyes, which makes them very important
ecomaterials.8,9
Titanate nanotubes and nanoribbons have mostly been
prepared through hydrothermal treatment of TiO2 powders
in aqueous NaOH solutions.10 This method is very simple,
inexpensive and efficient for obtaining samples with good morphological yields. However, the formation mechanism, composition and atomic structure of the titanate nanotubes obtained by this method are not yet well-defined and these issues have been the subject of intense debate in the
literature.11-15 What is consensus among different groups
is that hydrothermal treatment induces the formation of an intermediate layered titanate and that the nanotubes are formed by rolling up the layers originating from this layered intermediate structure, thus forming a
scroll-like geometry.13-16 On the other hand, there is a strong
controversy regarding the composition and microscopic formation mechanism whereby nanostructures with different morphologies, such as nanotubes, nanorods, nanofibers or nanoribbons, are prepared using a similar hydrothermal process. It was observed that the reactive environment plays an important role in morphology control and by adjusting the parameters of the hydrothermal process, such as temperature and time, it is possible to obtain nanosized
titanates in different morphologies.10,17-22
A new chemical composition was proposed for
the as-prepared titanate nanotubes.19 The composition
Na2-xHxTi3O7•nH
2O (0 ≤ x ≤ 2), where x depends on
the washing conditions was recently proposed, based on chemical reactions and thermal decomposition
properties.19,23 Furthermore, the nanotube walls and
nanoribbons should have atomic structures similar to
those observed in the layers of Na2Ti3O7 trititanate bulk.
The titanate nanotubes would be formed by exfoliation of lamellar structure into single sheets between (100) planes followed by the wrapping of these planes into a scroll-like
geometry.13-16,19,23,24 The nanoribbons would be formed
through cutting of layers between (100) and (010) planes
followed by their stacking in the (001) direction.24
In this paper, we present studies of structural, morphological and vibrational properties of different titanate nanostructures (nanotubes and nanoribbons). Based on the results obtained by several techniques, we show that both the morphology and structure of the titanate nanotubes (hereafter NTTiOx) and nanoribbons (hereafter NRTiOx) prepared by Kasuga’s method can be well characterized
by vibrational spectroscopy.10 Based on chemical analysis
and thermal treatment results, we show that similar to
NTTiOx, the NRTiOx walls have a Na2-xHxTi3O7•nH
2O
chemical composition and that the symmetry of the atomic
arrangements in the layers is similar to that of a Na2Ti3O7
trititanate bulk.19 Temperature-dependent data indicate that
the atomic layers of the nanoribbons undergo the transitions
to a mixing of the Na2Ti3O7 and Na2Ti6O13 bulk phases. This
structural change is similar to those observed to Na2Ti3O7
bulk when thermally treated in the same conditions.25
Experimental
All chemicals (reagent grade, Aldrich, Merck or Baker’s Analyzed) were used as received, without further purification processes. All solutions were prepared with deionized water.
Nanosized titanates preparation
Titanate nanotubes were prepared as described previously.19
In a typical synthesis, 2.00 g (25.0 mmol) of TiO2 (anatase)
were suspended in 60 mL of 10 mol L-1 aqueous NaOH solution
for 30 min. The white suspension formed was transferred to a 90 mL Teflon-lined stainless steel autoclave and kept at 165 ± 5 ºC for 170 h. After cooling to room temperature, the resulting white solid was washed several times with
deionized water until pH 11-12 (NTTiOx). For nanoribbon
preparation, the same procedure was carried out, except that
the temperature that was kept at 190 ± 5 ºC (NRTiOx). After
cooling to room temperature, the resulting white solid was washed several times with deionized water until pH 11-12. Both samples were dried at 60 ± 10 ºC for 24 h.
Bulk titanate preparation
The bulk samples of Na2Ti3O7 and Na2Ti6O13 were
synthesized by solid state reactions from the stoichiometric
weights of Na2CO3 and TiO2 (anatase), molar ratios of 1:3
and 1:6, respectively, followed by a thermal treatment in tubular furnace at 800 ºC for 20 h, in static air.
Thermal treatment of the nanoribbons
As-prepared nanoribbons (NRTiOx) were thermally
treated in the 100-1000 ºC temperature range in static air using a Mufle type furnace. Each sample was kept at a given temperature for 1 h in static air.
Characterization techniques
Determination of Na and Ti were carried out by inductively coupled plasma optical emission spectrometry (ICP OES), using a Perkin Elmer Optima 3000 DV, after
dissolution of the sample in 0.1 mol L-1 HCl. Transmission
Carl Zeiss CEM-902 setup. Scanning electron microscopy (SEM) images were obtained using a JEOL 6360LV instrument. Energy dispersive X-ray spectroscopy (EDS) data were collected using a Noran system S1X (Thermo Electron Corporation, model 6714A01SUS-SN) probe attached to the scanning electron microscope. X-ray powder diffraction (XRD) patterns were obtained with Shimadzu
XRD7000 diffractometer, using Cu Kα (λ = 1.5406 Å)
radiation operating with 30 mA and 40 kV. A scan rate of
1° min-1 was employed. Fourier transform infrared (FTIR)
spectroscopy was recorded using the KBr pellet technique
(from 370 up to 1000 cm-1)or Nujol mulls between CsI
windows (from 250 up to 370 cm-1) on a Bomen FTLA
2000 spectrometer. A total of 32 scans and a resolution of
4 cm-1 were employed for getting spectra with good signal
to noise ratios. Ex situ Raman spectra were obtained on a
Renishaw System 3000 Raman Imaging Microscope using
a He-Ne laser (632.8 nm). In situ Raman spectra data
were collected using a Jobin-Yvon T64000 spectrometer, equipped with a cooled charge coupled deviced (CCD)
detector using a cw Ar+-ion laser (514.5 nm). Low laser
power density was used in order to not overheat the
samples. A spectral resolution of 2 cm-1 was used and
measurements were performed using a backscattering geometry. DTA-TGA analyses were carried out using a TA equipment, model SDT Q600 over the 25-1000 °C
temperature range with a heating rate of 10 °C min-1 under
an air flow of 100 mL min-1.
Results and Discussion
Structure, composition and morphology
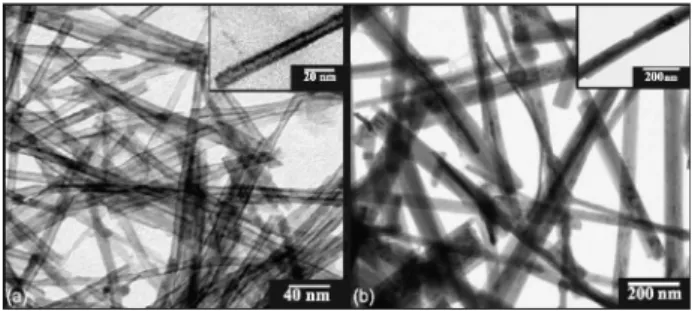
Figure 1a and 1b shows TEM images of the as-prepared NTTiOx and NRTiOx, respectively. Both samples were
prepared via hydrothermal treatment of anatase TiO2
powder in a strongly alkaline (NaOH) environment. Figure 1(a) shows that NTTiOx have a tubular morphology and they are multi-walled with an average outer (inner) diameter of 9 nm (5 nm) and a length of several tens of nm. The NTTiOx are open ended (see inset to Figure 1a) with a uniform diameter distribution. In Figure 1b we can observe that the NRTiOx samples have a ribbonlike morphology. The NRTiOx are long, uniform and multi-walled with a typical average width of approximately 100 nm, and a length of some micrometers. The nanoribbons present a wide width distribution varying from 20 to 200 nm.
In order to compare the morphological aspects of nanostructured titanates and their bulk counterparts, we show in Figure 2a and 2b SEM images of the as-prepared
sodium trititanate (Na2Ti3O7) and hexatitanate (Na2Ti6O13),
respectively. Both samples have the same morphology and an average particle size of 300 nm with very large size dispersion.
The chemical compositions of NTTiOx and NRTiOx samples were investigated by EDS and ICP OES. Table 1 shows the Na/Ti molar ratio and the compositions of the samples based on these analyses. The Na/Ti ratio found in both NTTiOx and NRTiOx samples probed by EDS are in
good agreement with the proposed Na2-xHxTi3O7 chemical
composition.19 Chemical analysis results of NTTiOx and
NRTiOx samples indicated a Na/Ti ratio that is consistent
with a composition of Na2Ti3O7 trititanate rather than bulk
Na2Ti6O13 hexatitanate.
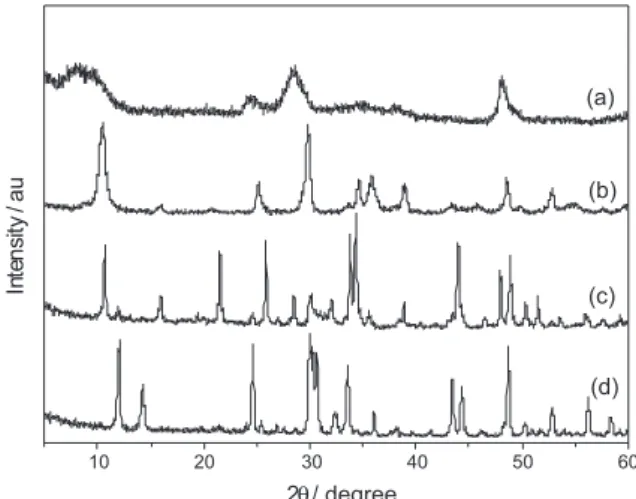
In Figure 3, we show the XRD patterns of bulk
(Na2Ti3O7 and Na2Ti6O13 as prepared) and nanostructured
titanates (NTTiOx and NRTiOx as prepared) samples. The
XRD pattern of Na2Ti3O7 (curve c) exhibits typical peaks for
Table 1. EDS average counts (Na/Ti ratio) for the as-prepared NTTiOx, NRTiOx, Na2Ti3O7 and Na2Ti6O13 and reference values. Na/Ti molar ratios in NTTiOx and NRTiOx obtained by ICP OES are also shown
Samples Na/Ti ratio Predominant
Phase
EDS ICP OES
Na2Ti3O7 (bulk) 0.552 - Na2Ti3O7 Na2Ti6O13 (bulk) 0.335 - Na2Ti6O13
NTTiOx 0.530 0.441 Na2-xHxTi3O7
NRTiOx 0.532 0.513 Na2-xHxTi3O7
Figure 1. TEM images of as-prepared (a) titanate nanotubes (NTTiOx) and (b), titanate nanoribbons (NRTiOx).
a monoclinic structure and the XRD pattern of Na2Ti6O13 (curve d) has typical peaks for a base-centered monoclinic
structure.26-28 In the XRD pattern of Na
2Ti3O7 (curve c) was
observed the presence of small amounts of TiO2 (remainder
of the initial solid solution) and Na2Ti6O13 (produced by
thermal decomposition of Na2Ti3O7). The XRD pattern
of NTTiOx (curve a) is closer to those observed by Chen
et al.,16 with some discrepancies, suggesting a crystalline
structure closer to that of H2Ti3O7. Thus, we can suggest
that NTTiOx has a structure similar to the Na2Ti3O7 because
of the high concentration of sodium cited in the Table 1. The XRD pattern of NRTiOx (curve b) shows typical peaks
that agree well with the XRD pattern of Na2Ti3O7 (curve c),
given some assumptions. The differences observed in the relative intensity of diffraction peaks for NRTiOx and
Na2Ti3O7 bulk samples can be related to both texture and
size induced effects. The morphology of NTTiOx and NRTiOx (nanometric thickness) samples would prevent the observation of some diffraction peaks owing the breaking of the long range order. The morphology of NRTiOx (large aspect ratio because of the needle shape) certainly would make the powder-like sample more texturized than the bulk where the particles exhibit a more spherical-like shape. Note the possibility of the appearance of some planes of
growth in greater intensity than Na2Ti3O7 bulk. Regarding
NTTiOx, it is expected that the size induced-effects should be more pronounced in a long range probe technique such as X-ray diffraction. The nanometric size is responsible for broadening the diffraction peaks and only the most intense ones observed in the bulk structure can be clearly observed and identified in the XRD patterns of NTTiOx and NRTiOx samples. Furthermore, the peaks close to
10° are shifted towards lower 2θ values, indicating an
increase in the interlayer distances because of the curvature effects (in NTTiOx) and ionic balance in the layers. In case of NTTiOx samples the curvature effects induces a unit cell distortion which is one of those responsible for asymmetrical broadening of the peaks as compared with
bulk titanates.29
Vibrational properties
In order to study the vibrational properties of titanate nanostructures we first review the Group Theory Analysis
of vibrations for Na2Ti3O7 and Na2Ti6O13 bulk structures.
Bulk Na2Ti3O7 at room temperature exhibits a lamellar
structure (monoclinic, space group P21/m (C2h2)) with two
formulas per unit cell (Z = 2). Group theory predicts that
Na2Ti3O7 would exhibit 69 vibrational modes distributed
among the irreducible representations as follows: 15 Ag +
20 Au + 15 Bg + 19 Bu. Bulk Na2Ti6O13 at room temperature
has a tunnel-like structure (base-centered monoclinic, space
group C2/m (C2h3)) with two formulas per unit cell (Z = 2),
whose vibrational mode distribution is 12 Ag + 18 Au +
12 Bg + 18 Bu. Both Ag (Au) and Bg (Bu) are Raman (IR)
active representations.
In Figure 4, we show FTIR spectra for titanate (bulk and
nanostructured) samples. The FTIR spectrum of Na2Ti3O7
(curve c) and Na2Ti6O13 (curve d) are distinctively different
from each other and they are in agreement with previous
reports.25,30,31 The FTIR spectrum of Na
2Ti3O7 shows eight
bands and two shoulders (408 and 445 cm-1) which can be
assigned (in order of increasing wavenumber) as being lattice
modes and Na-O-Ti bonds (below 300 cm-1), TiO
6 octahedron
modes (in the 300-1000 cm-1 range). Besides a less intensity,
the spectrum of Na2Ti6O13 shows five broad bands whose
assignment is similar to that of Na2Ti3O7. It is clear that
the number of vibrational bands observed for Na2Ti3O7 is
larger than for Na2Ti6O13, in agreement with group theory
prediction. The FTIR spectrum ofNTTiOx (curve a) is
characterized by three broad bands located at about 287, 470
and 895 cm-1 and two shoulders at 340 and 520 cm-1. The
spectrum of NRTiOx (curve b) shows five bands located at
about 297, 338, 465, 673 and 905 cm-1 and shoulders in 780
and 845 cm-1. NTTiOx and NRTiOx bands are very close in
energy to those of bulk Na2Ti3O7 except for the bands located
at about 338 cm-1 (for NRTiOx). The differences between the
nanoparticles (NTTiOx and NRTiOx) and Na2Ti3O7 can be
attributed to the diameter of a few nanometers, the curvature effects, unit cell distortion in the [010] direction and the stress placed on the surface of the nanometric particles. The FTIR bands of NTTiOx and NRTiOx are closer in energy density to the trititanate spectrum, but they cannot be appointed as
having similar structure to the Na2Ti3O7 bulk based in FTIR
measurements.11,14,32
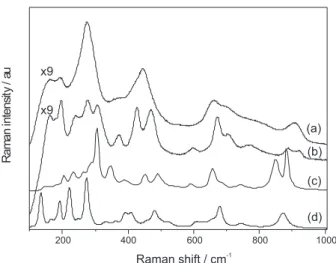
In Figure 5, we show Raman spectra for both nanostructured and bulk titanate samples. The Raman spectra for nanostructured samples are much weaker in intensity than for bulk samples. The Raman spectrum of
bulk Na2Ti3O7 (curve c) and Na2Ti6O13 (curve d) are similar
to those reported in the literature.33-35 Again the relative
number of modes observed for Na2Ti3O7 and Na2Ti6O13
are in agreement with group theory predictions. We observed that both NTTiOx and NRTiOx have different Raman spectra with respect to the number of bands, but they are similar with regard to location of energy bands. The differences can be understood through the following statements. First, the bands are broader in NTTiOx and this can be understood in terms of size-induced effects
which break the q ca. 0 momentum conservation rule that
allow phonons from the interior of the Brillouin zone to contribute to the Raman response. Second, disorder and curvature effects which induce unit cell distortion would also contribute to such broadening. Based on Raman spectroscopy and on these statements we can state that the structure of NTTiOx and NRTiOx are similar, differing only by the definition of their Raman bands. The Raman spectrum of NTTiOx exhibits vibrational frequencies at
about 156, 193 and 276 cm-1 which can be assigned to lattice
modes and Na-O-Ti modes. Bands at about 445, 656 and
781 cm-1 are assigned to vibrations from TiO
6 octahedron
while the band at about 905 cm-1 is related to terminal
Ti-O bonds (stretchings) either directed to the interlayer
space or to the outer surface of the nanotube.20,36-42 In the
Raman spectrum of NRTiOx the peaks are more defined than those for NTTiOx because of their larger size and less distortion of the layers (no curvature effect) thus showing a better atomic ordering in the layers. Different from the NTTiOx, the Raman spectrum of NRTiOx presents
more vibrational peaks and this is related to the better crystallinity which allows more modes to be solved in the Raman spectrum. The assignment of the modes is similar to what was proposed for NTTiOx. The Raman mode at
about 920 cm-1 which is assigned to terminal Ti-O bonds,
is also observed in NRTiOx. The relative intensity of this mode for both NRTiOx and NTTiOx is higher than for
bulk Na2Ti3O7, which is consistent with the morphology
since low dimensional structures would have larger surface
to volume ratios.36,38,41 Furthermore, this band is more
pronounced for NTTiOx than for NRTiOx, thus indicating that, for nanotubes, there are more Ti-O terminal bonds because they can be directed either inward or outward from the layer. We cannot determine with good precision the structure of the NTTiOx and NRTiOx through vibrational spectroscopy at room temperature. Thus, in the next section we studied the behavior of the NRTiOx through it thermal decomposition and the structural changes facing the thermal treatment can be determined with greater precision.
Thermal decomposition behavior
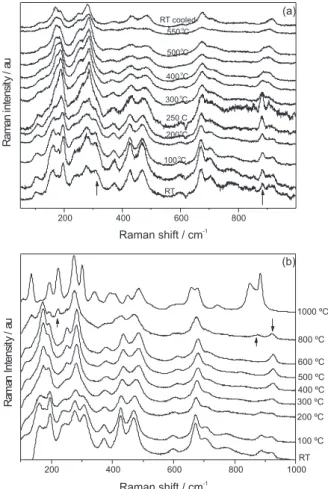
In Figure 6a, we show the in situ Raman spectrum
of NRTiOx with the temperature varying from room temperature (RT) up to 550 °C. Changes in the Raman bands for the NRTiOx are observed for temperature close
to 200 °C. Two well resolved bands (175 and 200 cm-1)
become broader collapsing to an asymmetric band. These results point to the structural water release, which is consistent with DTA-TGA measurements (not shown here). By further increasing the temperature, we note gradual changes in the Raman bands regarding the broadening of the peaks. However, close to 300 °C we can observe that the structural water release induced a structural disorder in
Figure 4. FTIR spectra for as-prepared (a) titanate nanotubes (NTTiOx), (b) titanate nanoribbons (NRTiOx), (c) bulk Na2Ti3O7 and (d) bulk Na2Ti6O13.
the system. This can be associated to the onset of a gradual phase transformation at higher temperatures. It is clear that heating to 550 °C introduced changes in the sample structure. We show at the top of Figure 6a the Raman spectrum of the NRTiOx at room temperature after cooling (RT cooled). It is clear that the structure of the sample has been modified because the peaks marked with arrows in the spectrum of the as prepared sample are absent in the
annealed sample. This issue is further addressed by ex situ
Raman data for which the samples were treated at higher temperatures, as we discuss next.
In Figure 6b, we show ex situ Raman data, for which
samples were annealed in the 100 to 1000 °C temperature range. We can also observe changes in the Raman bands close to the annealing temperature of 200 °C, related to structural water release. This water release probably generates changes in the structure of the samples that were affected by this phenomenon. In the 300-600 °C temperature range annealing we can observe only slight changes that can be related with release of hydroxyl groups adsorbed on the surface of the titanate nanoribbons, these same slight changes were observed in the titanates
nanotubes.19 In the Raman bands from the sample heated
to close to 800 °C we can notice a remarkable change in the Raman spectrum (marked by up arrows), indicating
a partial phase transformation to bulk Na2Ti6O13. In the
same temperature range was complicated to observe the
emergence of the bands related to the bulk Na2Ti3O7 because
of the superposition of bulk bands. The spectral features
of bulk Na2Ti6O13 and Na2Ti3O7 gain intensity close to
1000 °C, indicating that NRTiOx were converted to bulk structures. This is further confirmed by the disappearance
of the 920 cm-1 peak (see down arrows) which is a spectral
signature of NRTiOx morphology. This peak can be used to identify the titanate morphology and its changes upon thermal treatment.
In order to support this conclusion we also investigated the thermal decomposition behavior of NRTiOx using XRD. From the X-ray diffraction patterns shown in Figure 7 the release of structural water from the NRTiOx structure at about 200 °C is clearly observed. Water removal for samples treated at 200 and 300 °C caused the diffraction peak at
10° to be shifted toward larger 2θ values, thus indicating an
interlayer contraction. For samples treated at 300 °C (see up arrow) we can observe the appearance of a peak close
to 2θ= 12° which is typical of the bulk Na2Ti6O13 structure
and a sharp drop in the relative intensity of the peak at about
2θ = 10° which is typical of a Na2Ti3O7 phase. This can
confirm that NRTiOx sample, which has structure close to
Na2-xHxTi3O7, when thermally treated between 200 °C and
300 °C some of the nanoribbons loose interlayer water. This
water releasing allowed a gradual phase transformation to occur in the nanoribbons leading to structure which
is similar to the Na2Ti6O13 bulk for temperatures higher
than 600 °C. The rest of the nanoribbons which are anhydrous or contains a small amount of water due to a higher Na concentration does not undergo both phase and morphological changes up to 600 °C. This behavior leads to
diffraction pattern to be dominated by peaks from Na2Ti6O13
bulk, because they have a higher long range order than the NRTiOx nanoparticles. It is observed that in the 300-600 °C temperature range a structural disorder develops in the XRD pattern and it can be understood as being due to structural rearrangements of the part of NRTiOx as a consequence of water and hydroxyl release which possibly induce morphological changes in the nanoribbons. At 800 °C a strong change in the NRTiOx X-ray pattern is observed in agreement with Raman spectroscopy data. The NRTiOx X-ray pattern changes to a pattern that resembles that
of a phase mixing of bulk Na2Ti3O7 and Na2Ti6O13. This
assertion is based on the appearance of the diffraction peaks
close to 2θ = 10° and 26° (marked with x) which are typical
of bulk Na2Ti3O7 as well as the appearance of three peaks
Figure 6. Raman spectra (a) in situ for NRTiOx for the room temperature
(marked with o in Figure 7) close to 12°, 25° and 31° that
are typical of bulk Na2Ti6O13. At 1000 °C the peaks become
well defined and we clearly identify Na2Ti3O7 (marked
with x) and Na
2Ti6O13 (marked with o) phase mixing. It
is observed that the amount of bulk phase Na2Ti3O7 is
larger than that of Na2Ti6O13. This could be indicative
of the gradual conversion of a portion (lower portion) of the NRTiOx nanoparticles after dehydration to the bulk
Na2Ti6O13 from 300 °C and the conversion of the remaining
NRTiOx nanoparticles to bulk phase Na2Ti3O7 from about
800 °C, as discussed for NTTiOx in the literature.23 The
thermal decomposition of titanate nanotubes leads to similar results, which confirm that both nanoribbons and nanotubes have similar layer structures and compositions
at room temperature.19,25-28,30,43,44 Papp et al.25 studied the
thermal evolution of the Na2Ti3O7 bulk, and they observed
that as temperature increase the Na2Ti3O7 structure is
partially dymerized to form the Na2Ti6O13, which is similar
to what we observed for NRTiOx samples. This provides further evidence that the atomic arrangement in the layers
of NRTiOx is similar to Na2Ti3O7 bulk.
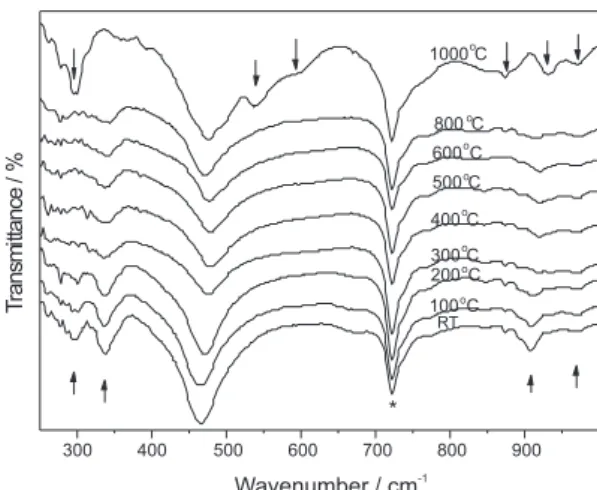
In Figure 8, we show ex situ FTIR spectra of NRTiOx
thermally treated in the 100 to 1000 °C temperature interval. From room temperature up to 800 °C the FTIR spectra do not exhibit any significant changes (up arrows) that might be observed. At 1000 °C we can verify (down arrows) the direct phase transformation which results in a phase mixing
of bulk Na2Ti3O7 and Na2Ti6O13 for the thermally treated
NRTiOx sample.
In Figure 9a we show SEM images of as-prepared NRTiOx and in 9b samples treated at 800 and in 9c at 1000 °C. We can clearly observe that thermal annealing at 1000 °C induced morphology changes thus indicating the formation of large rods (bulk-like) with a phase
mixing of bulk Na2Ti3O7 and Na2Ti6O13. By comparing
the results obtained from Raman, FTIR, and XRD we can see that Raman spectroscopy can track the structure and morphology changes very clearly. Since these experiments are simpler, less time consuming and non-destructive, we can use Raman spectroscopy for investigating both structure and morphology of titanates nanostructures.
Figure 7. Ex situ XRD patterns for NRTiOx in the 100-1000 °C
temperature range. (x) and (o) stand for Na
2Ti3O7 and Na2Ti6O13 phases,
respectively.
Figure 8. Ex situ FTIR spectra for NRTiOx thermally treated in the 100-1000 °C temperature range. (*) Nujol absorption band.
Conclusions
We have discussed the structural, morphological and vibrational properties of titanate nanostructures (nanotubes and nanoribbons). The vibrational spectra of NTTiOx and NRTiOx exhibit clear signatures which mean that both the morphology and the size of these nanostructures play key roles in the vibrational modes, allowing the use of both Raman and FTIR to identify the morphologies of the titanates nanostructures.
We also have studied the thermal decomposition properties of titanate nanoribbons obtained via the hydrothermal method. The thermal annealing of these titanate nanostructures at increasing temperatures leads to several structural modifications. At about 200 °C the interlamelar water is released and the interlayer distance is reduced. At about 300 °C and with the release of the water the material starts to undergo a gradual phase transformation
to the bulk Na2Ti6O13, observed in both Raman and X-ray
data, which show that the samples get disordered. Part of the nanoribbons (the dominant fraction) does not undergo any phase transformation up to 600 °C, and after this
temperature they change directly to Na2Ti3O7 bulk. By
further increasing the annealing temperature the structural changes become prominent and at about 800 °C the presence
of bulk Na2Ti3O7 and Na2Ti6O13 phase mixing is observed.
For samples treated at 1000 °C we observed an increase in
the amount of NRTiOx transformed in bulk Na2Ti3O7 phase.
This may be related to a greater concentration of interlamellar sodium in each NRTiOx, generating a greater stability with the increase of the treatment temperature. Besides the structural changes of the nanoribbons samples thermally treated are directly related to changes in their morphology that evolves to large rods are also observed. Both structural and morphological properties that have changed with thermal treatment were clearly captured in Raman spectra, thus suggesting that this technique can be used to precisely monitor the thermal behavior of titanate nanoribbons. Finally, this paper contributes to improve the understanding of titanate nanostructures through an assessment of their thermal decomposition behavior. The NTTiOx and NRTiOx have similar layer structures that corroborate with the
Na2-x HxTi3O7 composition already mentioned.
Acknowledgments
Financial support from the Brazilian funding agencies CNPq, CAPES, FUNCAP and FAPESP is gratefully acknowledged. A.G.S.F. acknowledges CNPq (grant 306335/2007-7) for financial support. The authors are indebted to Dr. Carlos A. P. Leite for assistance with the
TEM images and to Prof. C. H. Collins (IQ-UNICAMP, Brazil) for English revision. Bartolomeu C. Viana thanks to the Laboratório Nacional de Luz Sincrotron (LNLS) for training in transmission electron microscope. This is a contribution of Millennium Institute of Complex Materials (PADCT/MCT) and the Rede Nacional de Pesquisa em Nanotubos de Carbono-CNPq/MCT.
References
1. Remskar, M.; Adv. Mater. 2004, 16, 1497. 2. Tenne, R.; Nat. Nanotechnol. 2006, 1, 103.
3. Chen, X.; Mao, S. S.; Chem. Rev. 2007, 107, 2891.
4. Idakiev, V.; Yuan, Z. Y.; Tabakova, T.; Su, B. L.; Appl. Catal., A 2005, 281, 149.
5. Li, J. R.; Tang, Z. L.; Zhang, Z. T.; Electrochem. Commun.
2005, 7, 62.
6. Kuang, D.; Brillet, J.; Chen, P.; Takata, M.; Uchida, S.; Miura, H.; Sumioka, K.; Zakeeruddin, S. M.; Gratzel, M.; ACS Nano
2008, 2, 1113.
7. Fang, D.; Huanh, K.; Liu, S.; Huang, J.; J. Braz. Chem. Soc.
2008, 19, 1059.
8. Ferreira, O. P., PhD Thesis, Universidade Estadual de Campinas, Brazil, 2006.
9. Lee, C. K.; Liu, S. S.; Juang, L. C.; Wang, C. C.; Lyu, M. D.; Hung, S. H.; J. Hazard. Mater. 2007, 148, 756.
10. Kasuga, T.; Hiramatsu, M.; Hoson, A.; Sekino, T.; Niihara, K.;
Adv. Mater. 1999, 11, 1307.
11. Wang, Y. Q.; Hu, G. Q.; Duan, X. F.; Sun, H. L.; Xue, Q. K.;
Chem. Phys. Lett. 2002, 365, 427.
12. Yao, B. D.; Chan, Y. F.; Zhang, X. Y.; Zhang, W. F.; Yang, Z. Y.; Wang, N.; Appl. Phys. Lett. 2003, 82, 281.
13. Zhang, S.; Peng, L. M.; Chen, Q.; Du, G. H.; Dawson, G.; Zhou, W. Z.; Phys. Rev. Lett. 2003, 91, 2561031.
14. Bavykin, D. V.; Parmon, V. N.; Lapkin, A. A.; Walsh, F. C.;
J. Mater. Chem. 2004, 14, 3370.
15. Zhang, S.; Chen, Q.; Peng, L. M.; Phys. Rev. B: Condens. Matter Mater. Phys. 2005, 71.
16. Chen, Q.; Du, G. H.; Zhang, S.; Peng, L. M.; Acta Crystallogr., Sect. B: Struct. Sci. 2002, 58, 587.
17. Yuan, Z. Y.; Su, B. L.; Colloids Surf., A 2004, 241, 173. 18. Wei, M. D.; Qi, Z. M.; Ichihara, M.; Honma, I.; Zhou, H. S.;
J. Nanosci. Nanotechnol. 2007, 7, 1065.
19. Ferreira, O. P.; Souza, A. G.; Mendes, J.; Alves, O. L.; J. Braz. Chem. Soc. 2006, 17, 393.
20. Menzel, R.; Peiro, A. M.; Durrant, J. R.; Shaffer, M. S. P.; Chem. Mater. 2006, 18, 6059.
21. Cao, J.; Choi, J.; Musfeldt, J. L.; Lutta, S.; Whittingham, M. S.; Chem. Mater. 2004, 16, 731.
22. Horvath, E.; Kukovecz, A.; Konya, Z.; Kiricsi, I.; Chem. Mater.
23. Morgado, E.; de Abreu, M. A. S.; Pravia, O. R. C.; Marinkovic, B. A.; Jardim, P. M.; Rizzo, F. C.; Araujo, A. S.; Solid State Sci.
2006, 8, 888.
24. Wu, D.; Liu, J.; Zhao, X. N.; Li, A. D.; Chen, Y. F.; Ming, N. B.; Chem. Mater. 2006, 18, 547.
25. Papp, S.; Korosi, L.; Meynen, V.; Cool, P.; Vansant, E. F.; Dekany, I.; J. Solid State Chem. 2005, 178, 1614.
26. Andersson, S.; Wadsley, A. D.; Acta Crystallogr.1961, 14,
1245.
27. Andersson, S.; Wadsley, A. D.; Acta Crystallogr.1962, 15,
194.
28. Ramirez-Salgado, J.; Djurado, E.; Fabry, P.; J. Eur. Ceram. Soc.
2004, 24, 2477.
29. Andreev, Y. G.; Bruce, P. G.; J. Am. Chem. Soc. 2008, 130,
9931.
30. Bobrova, A. M. Z., I.G.;Bragina, M. I.; Fotiev, A. A.; J. Appl. Spectrosc. 1968, 8.
31. Peng, G. W.; Liu, H. S.; Mater. Chem. Phys. 1995, 42, 264.
32. Sun, X. M.; Li, Y. D.; Chem.-Eur. J. 2003, 9, 2229.
33. Bamberger, C. E.; Begun, G. M.; J. Am. Ceram. Soc. 1987, 70,
C48.
34. Su, Y.; Balmer, M. L.; Bunker, B. C.; J. Phys. Chem. B 2000, 104, 8160.
35. Kolen’ko, Y. V.; Kovnir, K. A.; Gavrilov, A. I.; Garshev, A. V.; Frantti, J.; Lebedev, O. I.; Churagulov, B. R.; Van Tendeloo, G.; Yoshimura, M.; J. Phys. Chem. B 2006, 110, 4030. 36. Meng, X. D.; Wang, D. Z.; Liu, J. H.; Zhang, S. Y.; Mater. Res.
Bull. 2004, 39, 2163.
37. Liu, X. Y.; Coville, N. J.; S. Afr. J. Chem. 2005, 58, 110.
38. Ma, R. Z.; Fukuda, K.; Sasaki, T.; Osada, M.; Bando, Y.;
J. Phys. Chem. B 2005, 109, 6210.
39. Bavykin, D. V.; Friedrich, J. M.; Lapkin, A. A.; Walsh, F. C.;
Chem. Mater. 2006, 18, 1124.
40. Qamar, M.; Yoon, C. R.; Oh, H. J.; Kim, S. J.; Kim, D. H.; Lee, K. S.; Lee, H. G.; J. Korean Phys. Soc. 2006, 49, 1493.
41. Zarate, R. A.; Fuentes, S.; Wiff, J. P.; Fuenzalida, V. M.; Cabrera, A. L.; J. Phys. Chem. Solids 2007, 68, 628.
42. Morgado, E.; de Abreu, M. A. S.; Moure, G. T.; Marinkovic, B. A.; Jardim, P. M.; Araujo, A. S.; Mater. Res. Bull. 2007, 42,
1748.
43. Yu, H. G.; Yu, J. G.; Cheng, B.; Zhou, M. H.; J. Solid State Chem. 2006, 179, 349.
44. Sun, X. M.; Chen, X.; Li, Y. D.; Inorg. Chem. 2002, 41, 4996.
Received: August 4. 2008
Web Release Date: November 28, 2008