A
r
ti
c
le
0103 - 5053 $6.00+0.00
*e-mail: [email protected]
Development and Application of LC-UV Method for the Quantification of the
Anti-inflammatory Thiazolidinone PG15 in Rat Plasma
Flávia D.T. Uchôa,a Vitória B. Cattani,b Maria C.A. Lima,a Suely L. Galdino,a
Ivan R. Pittaa and Teresa Dalla Costa*,b
aUniversidade Federal de Pernambuco, Departamento de Antibióticos, 50732-270 Recife-PE, Brazil
bUniversidade Federal do Rio Grande do Sul, Programa de Pós-Graduação em Ciências Farmacêuticas,
90610-000 Porto Alegre- RS, Brazil
Um método rápido e simples de cromatografia líquida com detecção por ultravioleta foi desenvolvido e validado para quantificação, em plasma de rato, do composto (5Z,E )-3-[2-(4-clorofenil)-2-oxoetil]-5-(1H-indol-3-ilmetileno)-tiazolidina-2,4-diona (PG15). Uma coluna em fase reversa C18 foi utilizada para separação do analito, seguida por detecção em UV a 385 nm. O método utilizou a precipitação do PG15 a partir do plasma e eluição isocrática com metanol:água (90:10, v/v). O tempo total da corrida foi 7,5 min. O método proposto foi validado e mostrou-se linear entre 62,5 e 4000 ng mL-1. A precisão intra- e inter-dia, expressa como desvio padrão relativo, foi menor que 15 e 10%, respectivamente, para todas as concentrações investigadas. A exatidão, medida através dos controles da qualidade, ficou entre 86,1-114,9 %. A aplicabilidade do método validado foi testada no estudo farmacocinético pré-clínico do PG15.
A simple and rapid liquid chromatography–ultraviolet detection (LC–UV) method has been developed and validated for quantifying (5Z,E)-3-[2-(4-chlorophenyl)-2-oxoethyl]-5-(1H -indol-3-ylmethylene)-thiazolidine-2,4-dione (PG15) in rat plasma. A C18 reversed phase column provided chromatographic separation of the analyte which was followed by UV detection at 385 nm. The method involves precipitation of PG15 from plasma and isocratic elution with methanol:water (90:10, v/v). Total elution time was 7.5 min. The proposed method was validated and showed linear correlation in the range of 62.5 to 4000 ng mL-1. The within- and between-day precision, expressed as the relative standard error, were found to be less than 15 and 10 %, respectively, for all the concentrations investigated. The accuracy, measured using the quality control samples, was in the range of 86.1-114.9 %. The applicability of the validated method was tested in a pre-clinical pharmacokinetic study of the thiazolidinone PG15.
Keywords: PG15, LC–UV, rat plasma, pharmacokinetics
Introduction
Anti-inflammatory drugs are widely used to treat pain, fever, and inflammatory acute and chronic conditions. The clinical use of non-steroidal anti-inflammatory drugs (NSAIDs) is associated with significant toxicity particularly
in the gastrointestinal tract and kidney.1 In the past 15 years
cyclooxygenase-2 (COX-2) inhibitors have been used to relieve inflammatory diseases symptoms without exhibiting the classical side effects of regular NSAIDs, especially the
gastric complications.2 In contrast, some COX-2 inhibitors
expose patients to increased risk of cardiovascular adverse
effects.3 As far as synthesis of new effective and safer
anti-inflammatory drugs is concerned, new molecules have been synthesized aiming to bind COX enzymes or reach anti-inflammatory activity by others mechanisms.
Novel 5-indol-thioxothiazolidinones and 3-benzyl thiazolidinones have been synthesized and exhibited
anti-inflammatory activity.4-6 Besides the anti-inflammatory
activity by COX pathway, some thiazolidines have been described as peroxisome proliferator-activated receptor ligands (PPAR) which are capable of suppressing
inflammatory process.7 A 5-indol substitution on the central
thiazolidinic ring and the absence of a sulfonyl moiety are the two structural features of the chemical series obtained
NSAID indomethacin as well as to the anti-diabetic PPAR-activator thiazolidinones, as roziglitazone (Figure 1). Previous docking studies in our laboratory showed that
indol-thiazolidinones were capable of binding to COX-2.9
These results were confirmed by in vitro inhibition of
purified ovine COX-1 and COX-2 measured using a
colorimetric assay.8 One of the compounds of this series, the
drug candidate (5Z,E
)-3-[2-(4-chlorophenyl)-2-oxoethyl]-5-(1H-indol-3-ylmethylene)-thiazolidine-2,4-dione (PG15)
(Figure 1), demonstrated an important activity in leukocyte migration evaluated by carragenin-induced inflammation in
the murine air pouch model. PG15, orally given (3 mg kg-1),
exhibited a 67.2 ± 4.6% inhibition of the leukocyte
migration to the inflammatory site 6 η after the beginning of
the experiment compared to the control group.8,10 This result
could be due to PF15 inhibition of COX-2 isoenzymes present in the air pouch tissue or to PPAR activation which
is associated to a reduced leukocyte migration.11-12
The success of PG15 in animal models, such as carragenin-induced inflammation in air pouch and
peritonitis,8 using very low doses, lead to the need of
investigating its pharmacokinetics in rodents.
Because PG15 is an original compound, no analytical method has been previously reported in literature for monitoring its plasma levels. In this context, the aim of this work was to develop and validate a rapid, specific and sensitive LC-UV analytical method to quantify PG15 in rat plasma viewing to investigate its pharmacokinetics.
Experimental
Chemicals
PG15 was obtained by synthesis as described by
Uchoa.8,10 High purity water was prepared in-house using
a Milli-Q water purification system. HPLC grade methanol and acetonitrile were purchased from Tedia (Brazil). Ethyl acetate, dichloromethane and ammonium phosphate monobasic were of analytical grade, purchased form Merck (Germany).
Standard solutions preparation
PG15 concentrated standard solution was prepared in methanol:ethyl acetate (80:20, v/v) at concentration of
400 µg mL-1. Sequentially, standard solutions were prepared
from this concentrated standard solution by dilution with water:methanol (50:50, v/v). These diluted working standard solutions were used to prepare the analytical curve and the quality control samples. The analytical curve
concentrations ranged from 62.5 to 4000 ng mL-1. Quality
control samples were prepared at three concentration levels:
low concentration (LQC) (80 ng mL-1), intermediate (IQC)
(400 ng mL-1) and high (HQC) (3200 ng mL-1).
Sample preparation
The standard curve of PG15 and the QC samples were prepared by spiking 100 µL of blank rat plasma with 10 µL of each standard curve solution. These spiked plasma samples were vortexed for 10 s and 200 µL of ice-cold methanol was added in each sample. The samples were vortexed for 30 s and centrifuged at 6800 g for 10 min. The supernatants were separated and 50 µL were injected into the LC-UV system. Blank plasma samples were prepared as described, without the drug, and 50 µL were injected.
LC-UV system
Chromatographic separation was carried out in Waters
Alliance® 2695 LC separation module with a 2487
UV-detector. A NovaPak® C18 column (4 µm, 150 × 3.9 mm)
preceded by a Phenomenex® C18 guard column (5 µm,
3.0 × 4.0 mm) was used. The mobile phase consisted of methanol:water (90:10, v/v) and it was used with a flow rate
of 1 mL min-1. The auto-injector temperature was kept at
15 oC and the column was kept at room temperature. PG15
was detected at 385 nm.
Validation procedure
To validate the method developed, three calibration curves with seven calibration points ranging from 62.5 to
4000 ng ml-1 were prepared in triplicate and analyzed on
two consecutive days. Three sets of quality control samples were also prepared and analyzed each day, according to
FDA guidelines.13 The method was validated for selectivity,
sensitivity, linearity, precision, and accuracy. Selectivity was evaluated by comparing the chromatograms obtained from the samples containing PG15 with those obtained from blank plasma samples. Furthermore, the chromatograms of the experimental samples obtained after intravenous (i.v.) administration of PG15 to Wistar rats were compared to the analytical curve standard chromatograms in order to detect interfering peaks. The sensitivity was determined by the lower limit of quantification (LOQ). The response to the LOQ was at least three times greater than the response of any interference at the retention time. Linearity of analytical curves based on peak-area weighted (1/y) as function of the nominal concentration was assessed by least square regression using the computer program
Scientist for WindowsTM (MicroMath®). Slopes, intercepts
and determination coefficients were calculated. Intra- and inter-day precision and accuracy of the analytical method were shown by processing and analyzing triplicate samples of each QC concentration. Precision was calculated as the relative standard deviation (RSD) of the experimental concentrations and accuracy as the comparison between the experimental and nominal samples concentration. The criteria for data acceptance included accuracy within ± 15% deviation from the nominal values and precision within ± 15% RSD, except for the lower limit of quantification (LOQ), where it should not exceed 20% of
RSD.13 Recovery experiments (extraction efficiency) were
performed by comparing the analytical results for LQC and
HQC extracted plasma samples (n = 3/each) with aqueous
standard solutions of the drug at the same concentrations that were subjected to the same processing procedure.
Stability study
PG15 short-term and medium-term stabilities in plasma were evaluated, as well as stability after freeze-thaw cycles
and stability of the processed sample. Spiked quality control
samples of 80 ng mL-1 (LQC) and 3200 ng mL-1 (HQC)
were used to assess stability. The short-term stability was performed by keeping the PG15 QC plasma samples at room temperature for 3 and 6 h, before processing for protein precipitation. The medium-term stability study was carried out by storing the plasma QC samples at −20 ºC for 4 or 8 days before analysis. The freeze-thaw stability study was conducted by analyzing the QC samples after 3 cycles (−20 ºC and room temperature). Processed samples stability was conducted by analyzing recently prepared QC samples and samples kept on the auto-injector for 3 and 6 h before injection.
Preliminary pharmacokinetic study
The applicability of the LC-UV method developed for pharmacokinetic studies was tested using plasma samples obtained after intravenous administration of PG15 to Wistar rats. Animal study protocol was approved by the Ethics in Research Committee of the Universidade Federal do Rio Grande do Sul (#2006608, UFRGS, Porto Alegre–RS). Animals were kept under 12 hour-controlled-light-dark cycle during the acclimation period and had access to water
and food ad libitum.
Male Wistar rats (n = 3) purchased from FEPPS
(Fundação Estadual de Produção e Pesquisa em Saúde, Porto Alegre-RS) received a single intravenous dose of
15 mg kg-1 of PG15. The drug suspension for administration
was prepared in 5% glucose solution with 10% of polysorbate 80. Blood samples (0.25 mL each) collected into heparinized tubes were obtained from the lateral tail vein sequentially at 0.083, 0.17, 0.25, 0.5, 1, 2, 4, 6, 8, 10 and 12 h post-dosing. Plasma (100 µL) was immediately separated by centrifugation (4 ºC, 6800 g, 10 min) and stored at –20 ºC until being analyzed, as described previously. Individual and average profiles were evaluated by non-compartmental and compartmental approaches viewing to estimate the pharmacokinetic parameters
using Excel® 2007 (Microsoft®) and Scientist® v. 2.01
(MicroMath®), respectively.
Results and Discussion
Method development
method development, based on PG15 physico-chemical properties (MW = 396; logP 4.05, calculated by Tekto’s
method,14 UV
max = 256 and 392 nm in acetonitrile, and 256
and 388 nm in methanol:water). PG15 is insoluble in water; partially soluble in methanol, ethanol and diethyl ether and soluble in ethyl acetate and acetone.
Optimization of the chromatographic conditions was conducted to obtain better peak resolution, shorter runtime, higher sensitivity and more accurate peak symmetry, according to FDA requirements for an LC method for drug quantification in biological fluids.
Mobile phases consisting of acetonitrile or methanol in different proportions with water or ammonium phosphate monobasic ammonium phosphate buffers with diverse pH were tested. Initially, acetonitrile was used due to its better UV transmittance, lower viscosity and better capability of PG15 solubilization than methanol. All mobile phases tested with acetonitrile, independently of their proportion or pH investigated, resulted in chromatograms with
double peaks due to PG15 E/Z configuration. Because an
isomeric separation is not intended at this stage of the drug development, the organic solvent was switched to methanol, which produced a symmetrical single peak. A mobile phase consisting of water:methanol (30:70, v/v) in a flow rate of
1 mL min-1 was selected. Methanol proportions higher than
70% led to PG15 peak elution close to plasma interferents. Mobile phases with more than 30% of water resulted in better peak symmetry, but longer retention times.
The wavelength selected for PG15 quantification in plasma, 385 nm, resulted in a higher detectivity than the other maximum of absorbance investigated, 256 nm, with no interference from endogenous substances from rat plasma at the drug retention time.
Sample preparation such as protein precipitation with acetonitrile or methanol at room temperature or ice-cold as well as liquid-liquid extraction using dichloromethane and ethylacetate were tested. No differences in recovery and in peak symmetry were observed between precipitation or liquid-liquid extraction. Precipitation with acetonitrile (1:2 ratio) was acceptable; however, led to an unstable baseline attributable to the composition of mobile phase. Due to the simplicity and efficacy of sample preparation, precipitation with ice-cold methanol (1:2 ratio) was chosen.
Method validation
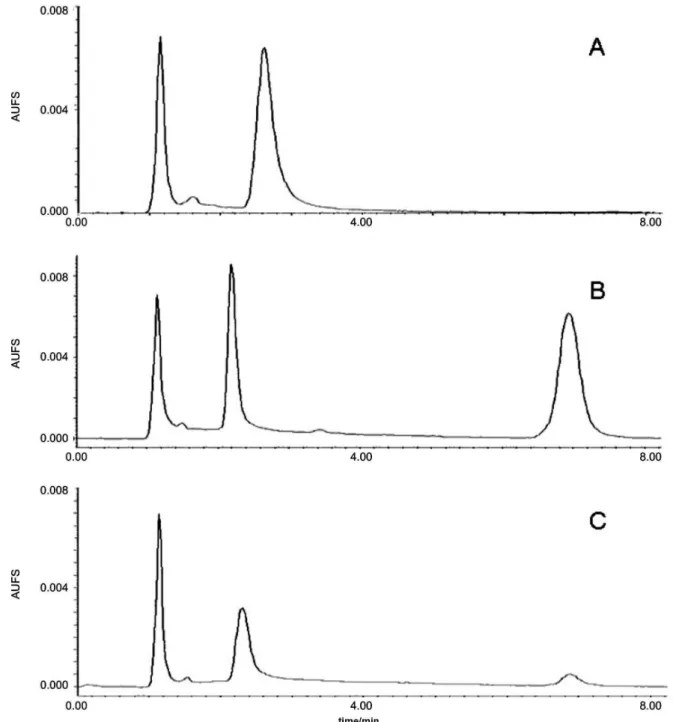
Selectivity and recovery
The selectivity of the analytical method developed can be observed in Figure 2 by comparing representative chromatograms of independent blank plasma and blank
plasma spiked with PG15 (3200 ng mL-1). No additional
peaks due to endogenous substances were observed which could interfere with the detection of the compound of interest. In addition, the experimental chromatograms obtained after intravenous administration of PG15
(15 mg kg-1) to Wistar rats (Figure 2C) did not show
interfering metabolites. The retention time of PG15 was approximately 6.8 min. The extraction recovery of PG15 was, in average, 74 ± 13% for the concentrations
investigated (80 and 3200 ng mL-1).
Linearity
The linearity of the method was observed in the
investigated concentration range (62.5 to 4000 ng mL-1).
PG15 analytical curve parameters determined in two consecutive validation days are shown in Table 1. The mean analytical curve is presented in Figure 3. All analytical curves of weighted (1/y) peak area as function of nominal concentration were linear and presented a determination coefficient greater than or equal to 0.996. The ANOVA evaluation showed no significant intra- or inter-day
variability for the slopes and intercepts (α = 0.05).
Lower limit of quantification (LOQ)
The lower limit of quantification (LOQ) was 62.5 ng mL-1,
which was accepted as the lowest level on the analytical curve that could be determined with the appropriate precision and accuracy under the experimental conditions
of this analytical method (Tables 2 and 3).13
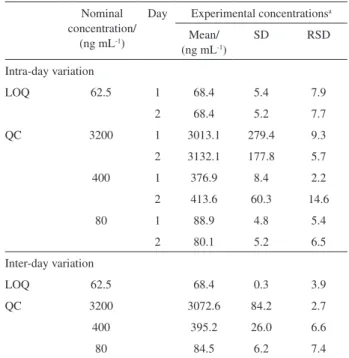
Precision and accuracy
The intra- and inter-day relative standard deviations for PG15 are shown in Table 2. The intra-assay and inter-assay precision (RSD) values for QC samples were less than or equal to 14.6% and 7.4%, respectively. The method showed an accuracy within 15%, which can be observed in Table 3. The results obtained for PG15 LC-UV quantification method were within the acceptable limits stated for FDA
bioanalytical methods validation.13
Preliminary stability study
Preliminary studies showed that PG15 is not a very stable compound. Short-term stability test performed at room temperature showed that low and high QC samples were stable for up to 6 h with recoveries of 97.7 ± 2.8% at 3 h and 93.1 ± 8.3% at 6 h after spiking, without significant difference from time zero samples.
The long- term stability results indicated that PG15 samples were stable at −20 ºC up to 8 days, with an average recovery of 99.0% in 4 days and 96.2% after 8 days.
Figure 2. Representative chromatogram of blank plasma (A), plasma spiked with PG15 3200 ng mL-1 (B) and plasma sample 4 h post-administration of PG15 15 mg kg-1 i.v. (plasma concentration 156 ng mL-1). PG15 retention time was around 6.8 min. Plasma and heparin peaks were observed up to 3.5 min. No interference was observed at PG15 retention time. The chromatographic conditions used were: NovaPak® C18 column, mobile phase of methanol:water (90:10, v/v) at 1 mL min-1 flow rate and UV detection at 385 nm.
cycles and mean recovery was found to be 90.9% for the HQC and 83.0% for the LQC. The stability of the processed sample ready to injection in the auto-sampler was also determined. Result showed that QC samples were stable for at least 4 h at 15 ºC, with losses no higher than 6%.
Considering the preliminary stability results plasma samples were processed and analyzed within 8 days after animal experiments, the samples were subjected to only one freeze/thaw cycle, samples were processed immediately
after thawing and the processed samples were injected no longer than 4 h after processing.
Suitability of the analytical method for pre-clinical pharmacokinetic studies
Table 1. Analytical curve parameters and statistics for thiazolidinone PG15 in rat plasma
Curve Slope y-Intercept Correlation coefficient Day 1
1 32218 −99.8 0.999
2 44119 −1947.0 0.996
3 42106 −1826.8 0.998
Day 2
1 42905 −783.4 0.998
2 33074 −588.7 0.998
3 42810 −303.2 0.998
Mean (n = 6) 39538.7 −686.1
SD a 5385.0 −782.1
RSD (%)b 13.6
aSD, standard deviation; bRSD, relative standard deviation.
Figure 3. Mean PG15 analytical curve in plasma using a LC-UV analytical method. Mean analytical curve equation was y = 39.634x – 958.937 (n = 6 determination).
Table 2. Intra and inter-day variation of thiazolidinone PG15 in rat plasma
Nominal concentration/
(ng mL-1)
Day Experimental concentrationsa Mean/
(ng mL-1)
SD RSD
Intra-day variation
LOQ 62.5 1 68.4 5.4 7.9
2 68.4 5.2 7.7
QC 3200 1 3013.1 279.4 9.3
2 3132.1 177.8 5.7
400 1 376.9 8.4 2.2
2 413.6 60.3 14.6
80 1 88.9 4.8 5.4
2 80.1 5.2 6.5
Inter-day variation
LOQ 62.5 68.4 0.3 3.9
QC 3200 3072.6 84.2 2.7
400 395.2 26.0 6.6
80 84.5 6.2 7.4
a Values (mean and SD represent n = 3 observations).
Table 3. Accuracy for the analysis of thiazolidinone PG15 in rat plasma Nominal
concentration/ (ng mL-1)
Concentration range/ (ng mL-1)
Accuracy range/
(%)a
LOQ 62.5 62.1-72.0 99.5-115.2
QC 3200 2836.0-3335.1 88.6-104.2
400 344.4-455.3 86.1-113.8 80 74.5-91.9 93.2-114.9 an = 6 observations.
of 15 mg kg-1 dose in a pilot pharmacokinetic study
(n = 3). The mean plasma profile obtained is shown in
Figure 4. The average profile shows a rapid plasma decline in concentrations after dosing a prolonged period of constant concentration followed by an elimination phase after 10 h, consistent with a profile of saturation of elimination process. The estimated elimination half-life was found to be 9.5 ± 4.3 h although a compartmental fitting of the profile would be more adequate to describe the elimination process because non-compartmental analyses are not appropriate to describe non-linear pharmacokinetic behavior. A compartmental fitting of the data using models that assume Michaelis-Menten elimination after distribution to one, two or three compartments were unsuccessfully tested because the elimination phase was not completely characterized.
Thus, it was not possible to estimate the pharmacokinetic parameters by non-compartmental or compartmental approaches. These results indicated that the analytical method is suitable to measure plasma concentrations of the
compound in pre-clinical studies when high doses of the drug are administered. For lower doses, a more sensitive method has to be developed which allows for drug quantification in plasma longer than 12 h post-dosing.
Conclusions
A simple, specific and rapid analytical method for the
determination of (5Z,E
)-3-[2-(4-chlorophenyl)-2-oxoethyl]-5-(1H-indol-3-ylmethylene)-thiazolidine-2,4-dione (PG15)
in rat plasma has been developed and validated according to FDA guidelines. The method provided excellent specificity and linearity with concentration range of 62.5
to 4000 ng mL-1. The method showed to be appropriate to
investigate plasma levels of the drug when high doses are used; however, for a proper characterization of smaller doses, a more sensitive assay has to be developed.
Acknowledgments
This work was supported by INOFAR/CNPq-Brazil (Process 420.015/05-1). Flávia De Toni Uchôa thanks CNPq-Brazil for the individual grant.
References
1. Hawkey, C. J.; Lancet1999,353, 307.
2. Mitchell, J. A.; Warner, T. D.; Nature Rev. Drug. Disc. 2006, 5, 75.
3. Zhang, J.; Ding, E. L.; Song, Y.; J. Am. Med. Ass. 2006,296, 1619.
4. Murthy, N. S.; Srinivasa, V.; Indian J. Pharmacol.2003, 35, 61.
5. Góes, A. J. S.; Alves, A. J.; Faria, A. R.; Lima, J. G.; Maia, M. B. S.; Quim. Nova2004, 27, 905.
6. Santos, L.C.; Uchoa, F. T.; Canas, A. R. P. A.; Sousa, I. A.; Moura, R. O.; Lima, M. C. A.; Galdino, S. L.; Pitta, I. R.; Barbe, J.; Heterocyclic Comm.2005,11, 121.
7. Cho, M. C.; Lee, W. S.; Hong, J. T.; Park, S. W.; Moon, D. C.; Paik, S. G.; Yoon, D. Y.; Mol. Cell. Endocrinol. 2005, 20, 96. 8. Uchoa, F. D. T.; PhD Thesis, Universidade Federal de
Pernambuco, Brasil, 2008. http://www.bdtd.ufpe.br/ tedeSimplificado/tde_busca/arquivo.php?codArquivo=3617, accessed in March 2008.
9. Leite, L. F. C. C.; Uchoa, F. D. T; Lima, M. C. A.; Galdino, S. L.; Pitta, I. R.; Hernandes, M. Z; Abstracts of the XII Simpósio Brasileiro de Química Teórica, São Pedro, Brazil, 2005. 10. Costa, P. C. V.; Paula, M. J. D.; Uchoa, F. D. T.; Santos, L. C.;
Silva, T. G.; Lima, M. C. A.; Galdino, S. L.; Pitta, I. R.; Abstracts of The 3rd Brazilian Symposium on Medicinal Chemistry, São Pedro, Brazil, 2006.
11. Seibert, K.; Zhang, Y.; Leahy, K.; Hauser, S.; Masferrer, J.; Perkins, W.; Len, L.; Isakson, P.; PNAS1994, 91, 12013. 12. Tanaka, T.; Fukunaga, Y.; Itoh, H.; Doi, K.; Yamashita, J.;
Chun, T. H.; Inoue, M.; Masatsugu, K.; Saito, T.; Sawada, N.; Sakaguchi, S.; Arai, H.; Nakao, K.; Eur. J. Pharmacol.2005,
31, 255.
13. FDA, Guidance for Industry. Bioanalytical Method Validation. 2001 http://www.fda.gov/cder/guidance/index.htm, accessed in January 2008.
14. Tetko, I. V.; Bruneau, P.; J. Pharm. Sci.2004, 93, 3103.
Received: March 28, 2008
![Figure 1. Chemical structure of indomethacin (A), rosiglitazone (B) and (5Z,E)-3-[2-(4-chlorophenyl)-2-oxoethyl]-5-(1H-indol-3-ylmethylene)-thiazolidine-2,4-dione (PG15) (C).](https://thumb-eu.123doks.com/thumbv2/123dok_br/18992219.461046/2.892.84.397.561.1052/chemical-structure-indomethacin-rosiglitazone-chlorophenyl-oxoethyl-ylmethylene-thiazolidine.webp)