http://dx.doi.org/10.1590/s2175-97902017000216093
A
r
*Correspondence: X. Ying. School of Pharmacy. Liaoning University of Tra-ditional Chinese Medicine, 77 Shengming 1 Road, DD Port, 116600 - Dalian, China. E-mail: [email protected]
Cytotoxicity of hydroxydihydrobovolide and its pharmacokinetic
studies in
Portulaca oleracea
L. extract
Liang Xu, Xiaojun Tao, Yucong Gao, Wenjie Zhang, Yihan Meng, Cuiyu Li, Mingyue Jiang,
Xixiang Ying
*School of Pharmacy, Liaoning University of Traditional Chinese Medicine, Dalian, China
Hydroxydihydrobovolide (HDB) was for the irst time isolated from Portulaca oleracea L. and then its cytotoxicity against SH-SYTY cells was studied. Moreover, a rapid and sensitive ultra-high performance liquid chromatographic (UHPLC) method with bergapten as internal standard (IS) was developed and validated to investigate the pharmacokinetics of HDB in rats after intravenous and oral administrations of extract (POE). The UHPLC analysis was performed on a Diamonsil C18 analytical column, using acetonitrile-water (35:65, v/v) as the mobile phase with UV detection at 220 nm. The calibration curve was linear over the range of 0.2-25 µg/mL in rat plasma. The average extraction recovery was from 90.1 to 98.9%, and the relative standard deviations (RSDs) of the intra- and inter-day precisions were
less than 4.7 and 4.1%, respectively. The results showed that 50 µM HDB had signiicant cytotoxicity
on the SH-SY5Y cells, which was rapidly distributed with a Tmax of 11 min after oral administration and presented a low absolute bioavailability, 4.12%.
Uniterms: Portulaca oleracea L./hydroxydihydrobovolide. Portulaca oleracea L./
hydroxydihydrobovolide/cytotoxicity. Portulaca oleracea L./hydroxydihydrobovolide/pharmacokinetics. Hydroxydihydrobovolide/Ultra-high performance liquid chromatography.
INTRODUCTION
Portulaca oleracea L., a member of family
Portulacaceae, with diffusely branched and succulent stems, is distributed extensively in temperate and tropical regions (Zhu et al., 2009). P. oleracea L., being a popular traditional Chinese medicine recorded in the Chinese Pharmacopoeia is commonly used for removing heat, counteracting toxicity, cooling blood, hemostasia and antidysentery (The Pharmacopoeia PRC, 2015). Pharmacological studies demonstrated that the plant possessed many activities including the neuroprotective
efect (Ahmed, Moneim, 2013), anti-tumor (Zhao et al., 2013), anti-inflammatory (Meng et al., 2016),
wound-healing efect (Rashed et al., 2003), antibacterial (Chan
et al., 2015) and hypocholesterolemic (Movahedian, Ghannadi, Vashirnia, 2007).With its popularity, more and more scholars thus pay more attention to its bioactive components, such as terpenes (Xin et al., 2008), phenolic
acids and coumarins (Awad, 1994), lavonoids (Xu, Yu,
Chen, 2006) and alkaloids (Tian et al., 2014). Also, the
pharmacokinetics of some of the bioactive components of P. oleracea L. (Cheng et al., 2012; Zhang et al., 2015) was reported recently.
In the present study, hydroxydihydrobovolide
(HDB), which belongs to the α-β-unsaturatedγ-lactone
and presenting potent anti-HIV activity (Zhang et al., 2005), was for the first time, isolated from Portulaca oleracea L. with its pharmacokinetics investigated in rat plasma following intravenous and oral administration
using a rapid and speciic UHPLC method, and its absolute
bioavailability was discussed. In addition, the cytotoxicity of HDB on the SH-SY5Y cells was studied.
MATERIAL AND METHODS
Plant materials and chemicals
Liaoning University of Traditional Chinese Medicine. The internal standard (IS), bergapten was provided by Sichuan Weikeqi Biological Technology Co., Ltd (Chengdu, China) (Figure 1b). Methanol and acetonitrile were all of HPLC grade provided by Damao Chemical Reagent Plant
(Tianjin, China). All other reagents were of analytical
grade purchased from Jinfeng Chemical Factory (Tianjin,
China), and the water was puriied with Milli-Q® Biocel Ultrapure Water System (Millipore, Bedford, MA, USA).
Isolation and identification
A sample (80 kg) of the whole herb of P. oleracea
L. was extracted with water twice and each for 2 hours. The crude extract was then concentrated and passed
through a porous-polymer resin (AB-8, Tianjin, China),
eluted with water, 50% and 70% ethanol, successively. The fraction of 70% extraction was evaporated under reduced pressure to obtain the P. oleracea L. extract (POE) of 200 g, and 150 g of the extract was partitioned with ethyl acetate, and subsequently evaporated and adsorbed on a polyamide resin (80-100 mesh, Taizhou LuqiaoSijia Biochemical Plastic Factory, Zhejiang,
China) column. After eluting with water, as well as 30%,
50% and 70% ethanol stepwise, the fraction eluted with 70% ethanol was evaporated and subjected to silica-gel column chromatography with ethyl acetate and methanol as the gradient eluent (10:1, 5:1, 1:1) to obtain 1-100 fractions, and then the fractions of 70-100 were repeatedly subjected to ODS column chromatography under medium pressure and eluted with methanol/water (70:30, v/v) to obtain 10 fractions. The fractions of 6
and 7 were puriied with Sephadex LH-20 and eluted
with methanol-water (70:30) to get the pale yellow oil compound (16 mg) with the purity checked by UHPLC more than 98%. Its molecular formula (C11H18O3) with 3
degrees of unsaturation was deduced from a protonated molecular ion peak at m/z 199.1108 [M + H]+ of
HR-ESI-TOF-MS. 1H-NMR (500 MHz, CDCl
3) δ: 1.96 (1H, br,
H-6a), 1.93 (3H, d, J = 0.75 Hz, H-11), 1.81 (3H, d, J = 0.85 Hz, H-12), 1.77 (1H, br, H-6b), 1.29 (4H, m, H-8, -9), 1.27 (2H, m, H-7), 1.17 (1H, br, OH), 0.88 (3H, t, J = 6.3 Hz, H-10); 13C-NMR (100 MHz, CDCl
3) δ: 172.18
(C-2), 157.80 (C-4), 125.28 (C-3), 107.02 (C-5), 35.99
6), 31.55 7), 22.59 8), 22.42 9), 13.91 (C-10), 10.69 (C-11), 8.42 (C-12). The 1H NMR, 13C NMR
and DEPT spectrum showed 11 carbon resonances, including three methyls (C-10, -11, -12), four methylenes
6, -7, -8, -9) and one carbonyl 2), two oleinic
(C-3, -4) carbons, and one quaternary carbon. The HMBC spectrum showed correlations of H-11/C-3, C-4, C-5, C-12, H-12/C-2, C-3, C-4 and C-11, H-10/C-8, C-9; H-8, H-9, H-10/C-7, H-8, H-9/C-10, H-8/C-9 or H-9/C-8 along with the 1H-1H COSY cross-peaks of H-8 and H-9
with H-10; H-7 with H-10; H-11 with H-12, indicating that there is a structure of oxole with methyl substitute located at C-3, C-4 and a carbon chain fragment attached to the oxole. To satisfy the molecular formula, the presence of one hydroxyl, together with the carbon chain substituted at C-5, was reasonably arranged considering
the downield chemical shift of C-5 (δC 107.02). The relative coniguration of HDB was established by NOE
spectrum, which showed the following correlations: H-6a with H-6b, H-8, H-9 with H-10, H-11 and H-12, H-11 with H-12; H-7 with H-10 and the active hydrogen in hydroxy, as shown in Figure 2. Following the above
evidence, the structure of the compound was conirmed
as shown in Figure 1a, and 1H NMR (500 MHz, CDCl 3)
and 13C NMR (500 MHz, CDCl
3) spectral data were
listed in Table I. The spectral data were consistent with previous report of hydroxydihydrobovolide (Zhang et al., 2014b).
Cell culture
SH-SY5Y cells, which were kindly provided by Prof. Jingxian Yang (Liaoning University of Traditional Chinese Medicine, China), are human neuroblastoma-derived cell line and have neuron-like characteristic. The cells were cultured in DMEM high glucose medium
(Hyclone, USA) supplemented with 10% fetal bovine
serum (Zhejiang Tianhang Biotechnology Co., Ltd.) and
100 U/mL penicillin-streptomycin (Hyclone, USA) at
37°C with 5% CO2.
FIGURE 2 - 1H-1H COSY, key HMBC and NOESY correlations
of hydroxydihydrobovolide.
Cell viability assay
Cell viability was assayed by CCK-8 (Cell Counting Kit-8, Beyotime Co., Ltd., China) according to the manufacturer’s instructions (Li, Zhang, Chen, 2008). In brief, 1.6 ×10⁴ cells/well of SH-SY5Y were seeded in 96-well plates and cultured in 100 µL DMEM medium. After
24 h, the cells were treated with fresh medium containing
diferent concentrations of HDB (0.01, 0.1, 1, 10, 50 µM)
for 48 h, then the cells were washed with PBS three times and incubated in 100 µL DMEM medium with 10%
CCK-8 solution. After incubation at 37°C for 2 h, absorbance at
450 nm was measured with a microplate reader (Mindray, China). The cell viability of % control in different concentration of HDB was plotted as means ± standard deviations (SD) of cell proliferation rate. The data was
analyzed with One-way ANOVA (SPSS software version 11.5, SPSS, Chicago, USA), and statistical signiicance
was considered at p< 0.05 or p< 0.01.
Chromatographic system and conditions
A Shimadzu UHPLC system (Japan) was equipped with a Solvent Delivery Pump (Shimadzu LC-30AD), a vacuum degasser (DGU-20A) a Shimadzu UV-VIS spectrophotometric detector (SPD-20A) and ChemStation
software (Shimadzu). Chromatographic separation of HDB from the IS was achieved on an analytical column (Diamonsil C18, 4.6 mm×150 mm, i.d., 5µm) (Dikma Technologies, Bejing, China) connected with a guard column (KRC18, 35 × 8.0 mm, i.d., 5 µm), (Dalian
Create Science and Technology Co., Ltd, Dalian, China). The mobile phase for UHPLC analysis consisting of acetonitrile-water (35:65, v/v) was passed under vacuum through a 0.22µm ilter membrane and degassed before
use. The analysis was carried out at a low rate of 1 mL/min
with the detection wavelength set at 220 nm and column temperature at 40 °C.
Preparation of calibration standards and quality control samples
The stock solutions of HDB and IS were prepared in methanol to yield the concentrations of 133 µg/mL and 18.2 µg/mL, respectively. The working solutions were prepared by diluting stock solution in series to
concentrations over the range of 0.4-50 µg/mL. All the
solutions were stored at 4°C before use. Seven calibrators (0.2, 0.5, 1.0, 2.0, 4.0, 10.0, and 25.0 µg/mL) of HDB and IS were prepared by adding the series of standard working solutions of HDB (50 µL) and the IS (0.91 µg/mL, 20µL)
to 100 µL of drug-free rat plasma. Quality control (QC)
samples were prepared at three concentrations (low, mid, and high) covering the whole range of the calibration curve. Low concentration (0.5 µg/mL) was 2.5 times of the
lower limit of quantiication, the high concentration (20 µg/mL) was 80% of the upper limit of quantiication and
the mid one (4.0 µg/mL) was near the geometric mean of
them. The whole QC samples were stored at -20 °C until analysis.
Animals and blood sampling
Male Wistar rats (250±20 g) were supplied by
the Laboratory Animal Service Center of Liaoning
Changsheng Biotechnology Co. Ltd. (Benxi, China). They were housed in an environmentally controlled breeding room for 1 week before the experiments and were fed regular chow with standard laboratory food and water ad libitum and fasted 12-16 h prior to the
experiment. All animal studies were carried out according to the requirement of the National Act on the Use of Experimental Animal (China) that was approved by the Committee of Ethics of Animal Experimentation of
Liaoning University of Traditional Chinese Medicine.
For the pharmacokinetics, the two groups of rat (ive rats
per group) were assigned to receive POE solution via intravenous at a single dose of 0.75 mL/kg (equivalent to 5.9 mg/kg of HDB), and oral administration at a dosage of 10 mL/kg (equivalent to 78.9 mg/kg of HDB), respectively. Serial blood samples (0.3 mL) were obtained via the orbitalis vena at times of 3, 5, 8, 11, 15, 20, 25,
TA B L E I - 1H - N M R a n d 1 3C - N M R s p e c t r a l d a t a o f
hydroxydihydrobovolide (500 MHz, CDCl3)
Position δC Type δH (J in Hz)
2 172.18 C=O 3 125.28 C 4 157.80 C 5 107.02 C
6 35.99 CH2 1.96 (1H, br, H-6a)
1.77 (1H, br, H-6b) 7 31.55 CH2 1.27 (2H, m)
8 22.59 CH2 1.29 (2H, m)
9 22.42 CH2 1.29 (2H, m) 10 13.91 CH3 0.88 (3H, t, J = 6.3 Hz)
11 10.69 CH3 1.93 (3H, d, J = 0.75 Hz)
12 8.42 CH3 1.81 (3H, d, J = 0.85 Hz)
30, 45, 60, 90 min after administration and collected into heparinized centrifuge tubes. The blood samples were immediately centrifuged at 3,500 g for 15 min at room temperature. The plasma sample was stored at -20 °C until analysis.
Plasma sample preparation
To 100 µL plasma, 20 µL of IS (0.91 µg/mL) and 0.5 mL methanol were successively pipetted, followed by vortex mixing for 1 min and centrifuging at 3,500 g
for 15 min to precipitate the protein. The supernatant was collected and evaporated to dryness at 40°C under a gentle stream of nitrogen. The dried residue was then reconstituted with 100 µL mobile phase, and centrifuged at 15,000 g for 5 min, and an aliquot (20 µL) of the supernatant was injected into the UHPLC system for analysis.
Method validation
Selectivity
The selectivity was determined by comparing chromatograms of blank plasma obtained from rats prior to dosing with those of corresponding standard plasma spiked with HDB and bergapten, and samples from rats after administration of POE.
Linearity, LOD and LOQ
The evaluation of the linearity was performed with a seven-point calibration curve over the concentration range of 0.2-25 µg/mL. The peak area ratios of the analyte with IS were plotted against standard concentrations to establish calibration curves for HDB. The slope and intercept of the calibration graphs were calculated by weighted (1/c2) least squares linear regression. Limit of detection (LOD) and limit of quantiication (LOQ) via diluting the QC samples stepwise were determined by
S/N=3 and S/N=10 (signal-to-noise ratio), respectively, giving an acceptable accuracy (RE) within 20% and a precision (RSD) that did not exceed 20%.
Precision and accuracy
The intra-day precision and accuracy were evaluated
by determining the QC samples at three concentration
levels with five replicates on the same day, while the inter-day values were assessed in the same way on three consecutive days. The precision was expressed as RSD,
which should be less than 15%, except at the LOQ where
it should not exceed 20%, and the accuracy of the assay was determined by comparing the means of the determined
HDB concentrations with the nominal concentrations. The mean percentage deviation from the nominal values expressed as RE which should be within ± 15% of the
nominal value, except at LOQ where it should not exceed
± 20%.
Extraction recovery
The extraction recoveries of HDB were determined
by comparing the peak area of QC samples that were at
low, mid, and high concentrations to that of the unextracted standard solutions containing the equivalent amount of analytes (n = 6).
Stability
Five aliquots of QC samples at low, mid, and high
concentrations were prepared for stability assessment.
Unextracted QC samples were subjected to the conditions
as follows:short-term stability was determined by
analyzing the QC plasma samples kept at ambient
temperature (25 °C) for 4 h;long-term stability was
determined by analyzing the unextracted QC plasma
samples stored at -20°C for 1 month; freeze-thaw stability was investigated after three freeze (-20 °C)-thaw (room temperature for 2-3 h) cycles; andpost-preparative
stability was assessed by analyzing the extracted QC
plasma samples kept in the autosampler at 4 °C for 12 h. These samples were processed and analyzed and the concentrations obtained were compared with the nominal
values of QC samples.
Pharmacokinetics and statistical analysis
Pharmacokinetic analysis of the data was performed using both compartmental and non-compartmental
methods, with the assistance of DAS program
(Chinese Pharmacology Society, Beijing, China). The compartmental parameters were generated, involving apparent volume of distribution at steady state (Vdss), α half-life (t1/2α), β half-life (t1/2β), and clearance rate (CL). The area under the plasma concentration-time curve
(AUC0→t) was calculated by the trapezoidal method. The
area under the plasma concentration-time curve from
zero to ininity (AUC0→∞) was calculated by means of the trapezoidal rule with extrapolation to ininity with terminal
elimination rate constant. The peak plasma concentration (Cmax) and the peak time were directly obtained from the drug plasma concentration-time profiles. The terminal
elimination rate (λz) was estimated by the least-square
formula t1/2z =0.693/λz. The mean residence time (MRT) was determined by (AUMC)/AUC. AUMC is the area under the irst momentof the plasma concentration-time
curve. It is calculated as . The Clearance
(CL) following dosing was calculated as Dose/AUC0-∞.
The absolute bioavailability (%) was calculated using the following formula:
RESULTS AND DISCUSSION
Effect of HDB on the proliferation of SH-SY5Y cells
To investigate the potential protective efect of HDB
on nerve cells, SH-SY5Y cells were used to evaluate the
efects on cell proliferation. As shown in Figure 3, after
exposure to HDB (0.01, 0.1, 1, 10 and 50 µM) for 48 h, the cell viability of 1 and 10 µM of HDB slightly decreased,
but there wasno statistical diference (P>0.05). When the concentration of HDB was 50 µM, the cell growth was
signiicantly inhibited (P<0.01); while at the concentration less than 0.1 µM, HDB did not showsignificant effect on SH-SY5Y cells (P>0.05). SH-SY5Y cells have
dopamine-β-hydroxylase activity, acetylcholinergic,
glutamatergic and adenosinergic characteristics, so they are often used as in vitro models of neuronal function
and diferentiation (Cho, Song, 2014; Ma et al., 2015). Meanwhile, SH-SY5Y cells also maintain their cancerous nature (Zhang et al., 2014a), and are often used as a human neuroblastoma cell line for anti-tumor research. In this
study, HDB did not show signiicant neuroprotective or promoting proliferation efects when lower than 50 µM,
but it may have growth-inhibiting orcytotoxic efects in
SH-SY5Ycells when higher than 50µM. Therefore, HDB may have anti-tumor activityat concentrations higher than 50 µM, its anti-tumor activity and mechanism needfurther study with more modelsin vitro or in vivo.
Method development and optimization
In consideration of the poor water-solubility of HDB, 10% ethanol was added to prepare the POE solution within safety limit for rats. To obtain perfect peak shape, suitable retention times and good separation among HDB, IS and endogenous substances, the mobile phase was chosen after several trials in various proportions with methanol-water (40:60-45:55, v/v), acetonitrile-water (30:70-40:60, v/v). There wereendogenous substances interfering with the determination of analytes when using methanol-water systems, and therefore
acetonitrile-water was inally adopted. In addition, to deproteinize
completely and extract analyte and IS simultaneously, acetonitrile and methanol have been tried, respectively;
methanol was inally chosen because of its low boiling
point and easy evaporation to dryness and high extraction recoveries of analyte and IS. The maximum absorptions of HDB at 220 nm were set to be the detection wavelength without endogenous interference and it was also found to be suitable for the analysis of IS.
Method validation
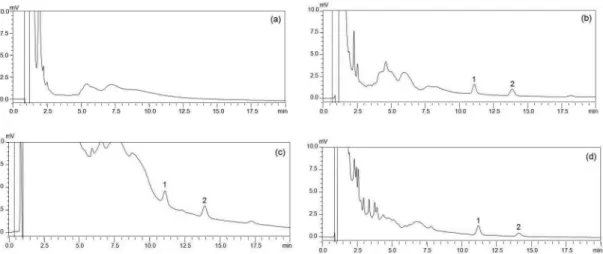
To determine the selectivity of this method, blank rat plasma, plasma spiked with HDB and IS, plasma samples from rats after intravenous and oral doses of POE were analyzed (Figure 4). The chromatograms indicated that there existed no interfering peaks in the region of the peaks of the analyte and IS. The retention times of HDB and IS
were approximately 13.9 min and 11.1 min, respectively. A
complete baseline resolution of HDB and IS with adjacent peaks was obtained from the chromatogram. The total run time was 20.0 min. The regression equation of the calibration curves was typically: y = 1.0852x + 0.0320 (SDslope= 0.044, SDintercept= 0.004) and the linear ranges
for plasma were within 0.2-25 μg/mL with r = 0.9926. The LOD (S/N = 3) and the LOQ (S/N > 10) were 0.045 and 0.2 μg/mL in plasma, respectively. The RSD of three concentrations (0.5, 4.0, 20.0 μg/mL) ranged from 0.9 to
4.7% for intra-day assay and from 1.6 to 4.1% for inter-day assay, respectively. The REs of intra- and inter-inter-day accuracy were within -1.4 to 6.6%, and the data, which conform to the criteria for the analysis of biological sample according to guidance of US Food and Drug
FIGURE 3 - Cytotoxicity of HDB on SH-SY5Y cells. After
Administration (FDA, 2001) were listed in Table II. Mean
extraction recoveries at three concentration levels for HDB ranged from 90.1% to 98.9% suggesting negligible loss during extraction. The short-term, long-term and freeze-thaw stability of HDB in plasma were shown in Table III, indicating that no remarkable degradation occurred during chromatography, extraction and storage processes for plasma samples.
Pharmacokinetic studies
Pharmacokinetic data were processed byDAS
program (Chinese Pharmacology Society, Beijing, China).
According to the AkaikeInformation Criterion (AIC)
and R2, a two-compartment open model (weight=1)
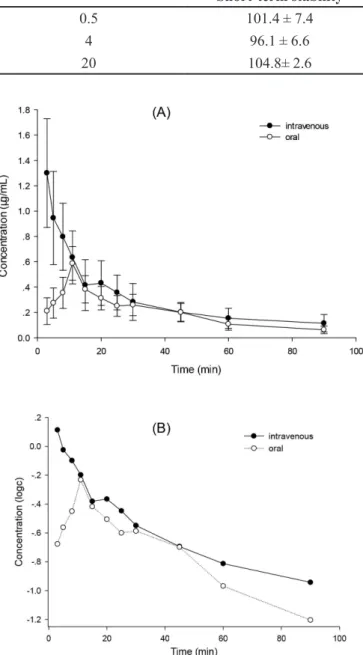
gave the best fit with the intravenous administration and a one-compartment open model (weight=1) for oral administration. The plasma concentration-time profile was shown in Figure 5, and the mean pharmacokinetic parameters of HDB in rats were summarized in Table IV.
After administration of HDB, HDB can be detected up to
1.5 hafter both routes. The maximum concentrations in
plasma after intravenous route (1.300±0.429 µg/mL) was about 2.2-fold higher than oral route (0.587 ± 0.13 µg/mL), as well as the corresponding AUC0→∞ was 37.22 ± 15.7
μg·min/mL of intravenous route larger than 20.52 ± 7.69
μg·min/mL of oral route, suggesting that the intravenous route had a higher absorption than oral route. T1/2α to be 3.67 ± 1.3 min, T1/2β to be 38.69± 13.4 min, the total body clearance to be 0.19 ± 0.09 L/kg·min and MRT0→tto be 25.22 ± 2.99 min after intravenous administration meant that HDB presented in an extremely rapid distribution and elimination pattern, while HDB was rapidly absorbed into blood circulation with peak concentration occurring at 11 min after oral administration, and fastly eliminated from plasma with t1/2 (29.55 ± 5.46 min), MRT0→t (31.72±1.42 min), CL/F (4.40±2.0 L/kg·min), suggesting HDB administrated in two routes showed a little cumulative phenomenon in the body. In non-compartmental approach, the CL/Fof i.v. route (0.190 ± 0.093 L/kg·min) is smaller than that of oral route (4.402±1.98 L/kg·min), indicating that HDB after intravenous administration eliminated slower in the blood than oral administration. The apparent volume of
FIGURE 4 - Representative chromatograms of blank plasma (a), plasma spiked with hydroxydihydrobovolide and IS (b), plasma sample 8 min after the intravenous administration (c) and oral administration (d) of hydroxydihydrobovolide. Peak 1: IS; Peak 2: hydroxydihydrobovolide.
TABLE II - Precisions, accuracy and recovery of hydroxydihydrobovolide in rat plasma and recovery of hydroxydihydrobovolide in rat plasma
Nominal Conc. (µg/mL)
Intra-day Inter-day
Recovery (%) Mean ± SD
(µg/mL)
RSD (%)
RE (%)
Mean ± SD (µg/mL)
RSD (%)
RE (%)
distribution (Vdss/F=170.25±46.3 L/kg) was relatively large after oral administration, suggesting a main distribution of HDB in the tissues and organs rather than plasma. In contrast, Vdss/F=9.025±2.22L/kg after
intravenous administration is very small, showing that HDB distributed mainly in plasma.The bioavailability of
HDB can be calculated from the AUCs when administrated
the extract in the intravenous and oral approaches. That
is, HDB’s absolute bioavailability after oral dosing of
Portulaca oleracea L. Extract was 4.12% calculated via
the formula of (AUCp.o./AUCi.v.)×(Dosei.v./Dosep.o.). Taking
the absolute bioavailability into account, pharmacokinetic parameters (CL, Vdss and terminal t1/2) after i.v. and oral dosing were similar (Table IV).The content of HDB in the extract was 18.67 mg/g determined by UHPLC method.
CONCLUSION
HDB, being the α-β-unsaturatedγ-lactone that
possesses the potential bioactivities anti-bacteria (Ordonez
et al., 2011) and anti-inflammatory (Rungeler et al.,
1999) properties, was irst found in P. oleracea L., and
the efect on cell proliferation and its pharmacokinetics
were investigated. The result showed that 50 µM HDB had cytotoxicity on the SH-SY5Y cells, and HDB could be rapidly absorbed and distributed in rats after i.v. and oral administrations but with a low absolute bioavailability of 4.12% following the administration of POE.
ACKNOWLEDGEMENT
This study was supported by the Project of National Natural Science Foundation of China (Grant No. 81573546) and the Natural Science Foundation of Liaoning Province (No. 2015020699), China.
REFERENCES
AHMED, E.; MONEIM, A. The neuroprotective effects
of purslane (Portulaca oleracea) on rotenone-induced biochemical changes and apoptosis in brain of rat. CNS Neurol Disord. Drug Targets. v.12, n.6, p.830-841, 2013.
AWAD, N. Lipid content and antimicrobial activity of phenolic
constituents of cultivated Portulaca oleracea L. Bull. Fac. Pharm. Cairo Univ., v.32, n.1, p.137-142, 1994.
FIGURE 5 - Mean plasma concentration-time curves of hydroxydihydrobovolide in rats (n = 5) after the intravenous and oral administration at dose of 5.9 mg/kg and 78.9 mg/kg,
respectively. Figure A: c-t; Figure B: logc-t.
TABLE III - Stabilities of hydroxydihydrobovolide in rat plasma at three QC levels (n = 5)
Added conc. (μg/mL) Accuracy (%, mean ± SD)
Short-term stability Long-term stability Freeze-thaw stability
CHAN, B.C.; HAN, X.Q.; LUI, S.L.; WONG, C.W.; WANG, T.B.; CHEUNG, D.W.; CHENG, S.W.; IP, M.; HAN, S.Q.; YANG, X.S.; JOLIVALT, C.; LAU, C.B.; LEUNG,
P.C.; FUNG, K.P. Combating against methicillin-resistant
Staphylococcus aureus-two fatty acids from Purslane (Portulaca oleracea L.) exhibit synergistic effects with erythromycin. J. Pharm. Pharmacol., v.67, n.1, p.107-116,2015.
CHENG, Z.Z.; XIE, M.; ZHANG, W.J.; CHENG, L.; DU, Y.; WANG, Y.J.; YING, X.X.; KANG, T.G. HPLC method
for the simultaneous determination of four compounds in rat plasma after intravenous administration of Portulaca oleracea L. extract. Braz. J. Pharm. Sci., v.48, n.1, p.163-170, 2012.
CHO, H.J.; SONG, M.J. A Gammaherpesvirus establishes
persistent infection in neuroblastoma cells. Mol Cells., v.37, n.7, p.518-525, 2014.
FOOD AND DRUG ADMINISTRATION.FDA. Center
for Drug Evaluation and Research (CDER). Guidance for Industry, Bioanalytical Method Validation. US Department of Health and Human Services. 2001.
Available at: <https://www.fda.gov/downloads/drugs/ guidancecomplianceregulatoryinformation/guidances/ ucm070107.pdf>. Access on: March 02, 2016.
LI, X.T.; ZHANG, Y.; CHEN, G.Q. Nanofibrous
polyhydroxyalkanoate matrices as cell growth supporting materials. Biomaterials, v.29, n.27, p.3720-3728, 2008.
MA, N.T.; ZHOU, R.; CHANG, R.Y.; HAO, Y.J.; MA, L.; JIN, S.J.; DU, J.; ZHENG, J.; ZHAO, C.J.; NIU, Y.; SUN, T.; LI, W.; KOIKE, K.; YU, J.Q.; LI, Y.X. Protective efects
of aloperine on neonatal rat primary cultured hippocampal neurons injured by oxygen-glucose deprivation and reperfusion. J. Nat. Med., v.69, n.4, p.575-583, 2015.
MENG, Y.H.; YING, Z.M.; XIANG, Z.; HAO, D.; ZHANG, W.J.; ZHENG, Y.; GAO, Y.C.; YING, X.X. The
anti-inflammation and pharmacokinetics of a novel alkaloid from Portulaca oleracea L. J. Pharm. Pharmacol., v.68, n.3, p.397-405, 2016.
MOVAHEDIAN, A.; GHANNADI, A.; VASHIRNIA, M. Hypocholesterolemic Efects of Purslane Extract on Serum
Lipids in Rabbits Fed with High Cholesterol Levels. Int. J. Pharmacol., v.3, n.3, p.285-289, 2007.
ORDONEZ, P.E.; QUAVE, C.L.; REYNOLDS, W.F.; VARUGHESE, K.I.; BERRY, B.; BREEN, P.J.; MALAGON, O.; SMELTZER, M.S.; COMPADRE, C.M.
Sesquiterpene lactones from Gynoxys verrucosa and
their anti-MRSA activity. J. Ethnopharmacol., v.137, n.2, p.1055-1059, 2011.
PHARMACOPOEIA OF THE PEOPLE’S REPUBLIC OF CHINA. Beijing: China Medical Science and Technology
Press, 2015. Part 1. p.49-50.
RASHED, A.N.; AFIFI, F.U.; DISI, A.M. Simple evaluation of
the wound healing activity of a crude extract of Portulaca oleracea L. (growing in Jordan) in Mus musculus JVI-1. J. Ethnopharmacol., v.88, n.2-3, p.131-136, 2003.
RUNGELER, P.; CASTRO, V.; MORA, G.; GOREN, N.; VICHNEWSKI, W.; PAHL, H.L.; MERFORT, I.;
SCHMIDT, T.J. Inhibition of transcription factor NF-kappaB by sesquiterpene lactones: a proposed molecular mechanism of action. Bioorg. Med. Chem., v.7, n.11, p.2343-2352, 1999.
TIAN, J.L.; LIANG, X.; GAO, P.Y.; LI, D.Q.; SUN, Q.; LI, L.Z.;
SONG, S.J. Two new alkaloids from Portulaca oleracea and their cytotoxic activities. J. Asian Nat. Prod. Res., v.16, n.3, p.259-264, 2014.
XIN, H.L.; XU, Y.F.; HOU, Y.H.; ZHANG, Y.N.; YUE, X.Q.; LU, J.C.; LING, C.Q. Two novel triterpenoids from
Portulaca oleracea L. Helv. Chim. Acta, v.91, n.11, p.2075-2080, 2008.
XU, X.Q.; YU, L.S.; CHEN, G.N. Determination of lavonoids
in Portulaca oleracea L. by capillary electrophoresis with electrochemical detection. J. Pharm. Biomed. Anal., v.41, n.2, p.493-499, 2006.
ZHANG, H.J.; NGUYEN, V.H.; NGUYEN, M.C.; SOEJARTO, D.D.; PEZZUTO, J.M.; FONG, H.H.; TAN,
G.T. Sesquiterpenes and butenolides, natural anti-HIV constituents from Litsea verticillata. Planta Med., v.71, n.5, p.452-457, 2005.
ZHANG, H.; PU, J.; QI, T.; QI, M.; YANG, C.; LI, S.; HUANG, K.; ZHENG, L.; TONG, Q. MicroRNA-145 inhibits
ZHANG, J.; LIANG, Y.; LIAO, X.J.; DENG, Z.; XU, S.H.
Isolation of a new butenolide from the South China Sea gorgonian coral Subergorgia suberosa. Nat. Prod. Res., v.28, n.3, p.150-155, 2014b.
ZHANG, W.J.; LI, D.; LENG, A.J.; AI, J.J.; DU, Y.; MENG, Y.H.; GAO, Y.C.; YING, X.X. Tissue distribution and excretion of the ive components of Portulaca oleracea
L. extract in rat assessed by UHPLC. Braz. J. Pharm. Sci.,
v.51, n.3, p.643-651, 2015.
ZHAO, R.; GAO, X.; CAI, Y.P.; SHAO, X.Y.; JIA, G.Y.; HUANG, Y.L.; QIN, X.G.; WANG, J.W.; ZHENG, X.L. Antitumor activity of Portulaca oleracea L. polysaccharides against cervical carcinoma in vitro and in vivo. Carbohydr. Polym., v.96, n.2, p.376-383, 2013.
ZHU, H.B; WANG, Y.Z.; LIU, Y.X.; XIA, Y.X.; TANG, T. Analysis of lavonoids in Portulaca oleracea L. by UV-Vis
Spectrophotometry with comparative study on diferent
extraction technologies. Food Anal. Meth., v.3, n.2, p.90-97, 2009.