http://dx.doi.org/10.1590/0104-530X2155-15
Resumo: O objetivo deste estudo é o desenvolvimento de um modelo de Balanced Scorecard de TI sob o enfoque da dinâmica de sistemas – BSCD de TI. Para isso, foi realizada modelagem qualitativa e quantitativa para a construção e simulação do referido modelo, a partir da realização de estudo de caso sobre o processo de gestão estratégica de TI do Sistema de Telemática do Exército Brasileiro – SisTEx. O estudo apoiou-se em análise documental dos BSC e mapas estratégicos das organizações militares que compõem o SisTEx, na condição de observador participante do pesquisador, e no emprego da técnica de simulação conirmatória sobre o modelo desenvolvido, em contexto de prova. Os resultados comprovaram as proposições estabelecidas no estudo, através do estabelecimento de relações de causa e efeito e consideração de tempos de espera entre os objetivos estratégicos, viabilizando a simulação do modelo proposto.
Palavras-chave: Balanced Scorecard; Governança de TI; Dinâmica de sistemas; Balanced Scorecard Dinâmico; Balanced Scorecard Dinâmico de TI.
Abstract: This study aimed the development of an IT Balanced Scorecard based on dynamic systems approach – IT DBSC. The research strategy was a single case study about the process of IT strategic management with the use of the BSC in the Brazilian Army’s Telematics System (SisTEx), through qualitative and a quantitative modeling. We performed a BSC document analysis and strategic maps of SisTEx’s military units, as the researcher participative observer and conirmatory simulation on proof context. The results sustained the established study propositions, according to causal and effect relationships and delay times considered between strategic objectives, which allowed the simulation of the proposed model.
Keywords: Balanced Scorecard; IT Governance; System dynamics; Dynamics Balanced Scorecard; IT Dynamic Balanced Scorecard.
Application of dynamic Balanced Scorecard in the
Brazilian Army information technology governance
Aplicação do Balanced Scorecard Dinâmico na governança da informação do Exército Brasileiro
Luciano da Silva Bastos Sales1 Luís Kalb Roses2 Hercules Antônio do Prado3
1 Programa de Pós-graduação em Sistemas Mecatrônicos, Departamento de Engenharia Mecânica, Universidade de Brasília – UNB,
Campus Darcy Ribeiro, Asa Norte, CEP 70910-900, Brasília, DF, Brazil, e-mail: [email protected]
2 Subsecretaria de Planejamento, Orçamento e Administração, Esplanada dos Ministérios, Ministério da Fazenda, Anexo P, Bloco A,
4o andar, Sala 411, CEP 70000-000, Brasília, DF, Brazil, e-mail: [email protected]
3 Programa de Pós-graduação em Gestão do Conhecimento e da Tecnologia da Informação, Setor de Grandes Áreas Norte, Universidade
Católica de Brasília – UCB, Quadra 916, Módulo B, Sala A138, Av. W5 Norte, CEP 70000-000, Brasília, DF, Brazil, e-mail: [email protected] Received Aug. 5, 2015 - Accepted Dez. 11, 2015
Financial support: None.
1 Introduction
One of the reasons why organizations face dificulties in the deployment of their strategies is the use of inadequate gauging tools for a dynamic economy dominated by intangible assets (Costa, 2004). Kaplan & Norton (1997) developed Balanced Scorecard (BSC), a strategic management system that complements the traditional measures with focus on the inancial dimension, past performance and tangible assets, with new indicators, based on future performance and distributed in learning and growth perspectives; internal processes; and clients.
This context is relevant to the Information Technology (IT) area, as it supplies the essential infrastructure and the strategic applications that complement human capital for the promotion of an outstanding performance of the organizational themes (Kaplan & Norton, 2004). It is important to point out that IT-Business strategic alignment is one of the main organizational concerns (Luftman & Ben-Zvi, 2011) and one of the chief areas of IT governance foccus (ISACA, 2012).
IT governance seeks desirable behaviors in the use of IT through speciication of decision rights and accountability models (Weill & Ross, 2006). Models of this governance, such as COBIT 5 – a comprehensive model that focuses on auditing and IT process control (ISACA, 2012) – and ITIL V3 (TCO, 2011) – a model with the best practices for IT service management used by providers of these services (TCO, 2011) –, recommend BSC to align IT strategic objectives with those of the business area.
In spite of the success and recognition achieved by BSC even in IT governance, it presents some serious structural problems associated to its development (Barnabè, 2010; Lyell & McDonnell, 2007; Costa, 2004; Fernandes, 2003), three of which are of interest in this study. The irst one derives from the unidirectional cause and effect relations between the strategic objectives of the four perspectives, without any feedback. Thus, there is a relative simpliication in the strategic map, as all the causality relationships must point in the direction of the inancial perspective.
The second structural problem, still related to the strategic maps, occurs due to disregard of the possible delays and the different development velocities between the cause and effect relations (Nielsen & Nielsen, 2013; Fernandes, 2002). After all, time and velocity are disregarded in the development of causality relations between the strategic objectives, giving the impression that all the planning will provide results at the same time. This can lead to mistakes in decision-making, as managers can interpret the results of variables that evolve at different velocities as errors in the planning process.
The third structural problem is the result of the two previous problems. The lack of temporal representation, the unidirectionality and differences between the response velocities of the strategic objectives make the development of simulations dificult, impeding the understanding of future modelling of consequences regarding organizational strategy through the traditional BSC (Fernandes, 2003). After all, this strategy will not be true to the systemic reality of the business environment and, consequently, will prevent the assumption that a strategic decision will provide the impact foreseen on future performance (Fernandes, 2003).
In light of this, when incorporated into the IT governance models such as COBIT 5 and ITIL V3, for example, the traditional BSC may contaminate them with their structural issues, negatively inluencing the decision-making process and the IT-Business strategic alignment. In order to avoid this, the suggestion is to incorporate the system dynamics with more accurate results for the organizations (Kozena et al., 2011) through the Dynamic BSC – or DBSC. The DBSC is a strategic management system that uses the essential concepts from the traditional BSC; however, it incorporates modelling tools and simulations of system dynamics (Capelo & Dias, 2010).
In this context, the following research question will be dealt in this study: How can DBSC be applied in IT governance? To answer it, the objective of this study is the development of an IT BSC model through system dynamics perspective – or IT DBSC.
2 System dynamics
System Dynamics (SD) is an area of knowledge recently applied within the managerial context and its concepts are within the scope of System Theory, which tries to improve the understanding of a system over time by modelling its behavior (Nielsen & Nielsen, 2013; Vitor et al., 2007). The delays between actions, their consequences and the feedback mechanisms that inluence the system’s behavior and deine its structure are considered in this modelling (Barnabè, 2010; Lyell & McDonnell, 2007; Costa, 2004; Fernandes, 2003).
Thus, SD seeks to map organizational or social structures, aiming at understanding the intrinsic power relations that operate in these structures and studying them as part of an integrated process (Nielsen & Nielsen, 2013). Furthermore, it uses the simulation technique to understand how these processes evolve over time, as well as how the impacts from the changes in parts of these structures can affect in the overall behavior of the sytsem (Bastos, 2003).
2.1 Feedback, reinforcement and balance loops
A feedback cycle system is inluenced by its own previous behavior, based on a closed circuit where the results obtained in the outlows of a process can inluence its inlows, thereby creating a causality without a unique direction (Kronmeyer, 2006). The feedback cycle system is the basis of the dynamic strategic map (non-linear) proposed by Fernandes (2003), where the strategic objectives of the BSC perspectives have feedback in their causal relations.
considered, there is a feedback loop (feedback cycle). These loops are responsible for reinforcement (positive) or balance (negative) mechanisms, which inluence the system’s behavior (Fernandes, 2003). In a closed cycle (loop), this results in enhanced behavior of a certain variable, as from the inluence of other variables in the cycle, or even reduction or stagnation of a certain behavior.
The reinforcement loops have a more predictable behavior, as the variables reinforce or accelerate the initial change, and have an exponential behavior, either increasing or decreasing, which can occur in an undeined manner, unless limiting variables are introduced (Costa, 2004). The balance loops occur when there is a relation or when an odd numer of loop relations are negative. Thus, the balance loops limit the initial direction of the change in the variables (Bastos, 2003).
2.2 Qualitative and quantitative modelling System modelling can be classiied as soft, which is more subjective and focused on the qualitative aspect and on systemic learning, through the causal-looping diagrams; and hard, with a quantitative focus directed at simulation and decision-making (Capelo & Dias, 2010; Costa, 2004; Fernandes, 2003), through stock and low diagrams. The integration of these two modelling approaches allows for better understanding of the internal dynamics of a certain system and projects the impact of decisions over time, suggesting that the soft modelling precedes the hard one in
providing better understanding of the simulation model (Vitor et al., 2007).
2.2.1 Causal-looping diagrams
Also known as causals (or of inluence, feedback or loop), causal-looping diagrams allow for greater understanding through their construction simplicity and representation (Vitor et al., 2007; Costa, 2004). They represent the variables of the model and the cause and effect relations between them, enabling us to identify interactions and their inluences in the dynamics of the system’s structure. Besides, they have two important purposes, being the irst to serve as an outline for causal hypothesis and the second to simplify the model design (Bastos, 2003).
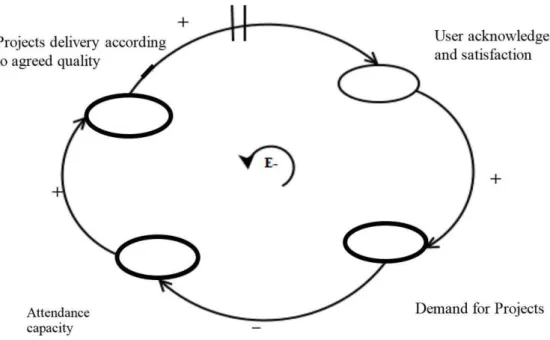
According to Bastos (2003), a loop (or feedback structure) occurs in causal-looping diagrams whenever an action provokes a consequence, which will go back to inluence that action. It can be quick and direct - or even indirect and long term -, which provokes delays according to that illustrated in Figure 1.
2.2.2 Stock and low diagrams
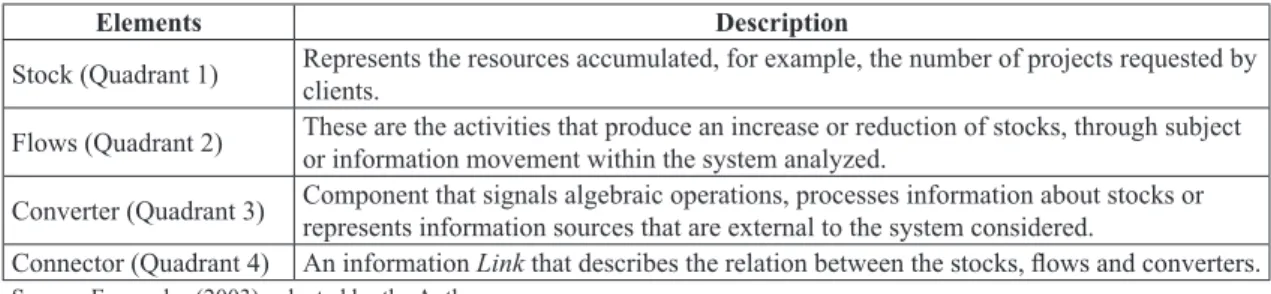
The stock and flowdiagramsallow for the development of mathematical approaches focused on computational simulation, as they demand more thoroughness in the system’s functional behavior (Vitor et al., 2007; Costa, 2004). Any system – natural or artiicial – can be described through a stock and low diagram, which is composed of four elements, described in Chart 1 and illustrated in the quadrants of Figure 2 (Fernandes, 2003).
2.3 Dynamic bsc and strategic map
DBSC allows managers to develop a quantiiable model of the strategic management system developed for the organization, which can explore the effect of feedbacks, delays and emerging properties, as well as the simulation test for a series of strategies before their execution. Therefore, the DBSC construction process forces managers to detail their mental models and share them, challenging internal consistency and aligning them (Akkermans & Oorschot, 2002). This allows managers to think “outside the box” (Rydzak et al., 2004).
Thus DBSC updates the original strategic map with the effects described in the strategic map with lows that occur in the organization, offering more precise and complex information (Capelo & Dias, 2010; Kozena et al., 2011), by means of a dynamic strategic map. Kozena & Chládek (2010) and Fernandes (2003) proposed this map with the same perspectives of the traditional BSC, however with the feedback cycles and the delays of the cause and effect relations foreseen in the SD.
Therefore, the whole causality chain, previously built in a unidirectional manner, begins to complement the feedback between strategic objectives and perspectives, as well as the delays between the strategic results. This complements the original
(traditional) strategic map and relects the dynamics of the strategic variables more eficiently, aiming at management sustainability (Kronmeyer, 2006) with more effective decision-making in terms of organizational reality.
2.3.1 Phases, steps, stages and tasks
In the qualitative modelling phase (soft), aiming at the development of causal-looping diagrams, Fernandes (2003) adopted the following steps, as from Senge (1996): 1) deinition of a situation of interest that must be important and complex for the organization; 2) presentation of the track record of the events, marking those relevant to the situation over the period of time considered; 3) identiication of key factors, with the identiication of those that must be taken into consideration to understand the situation; 4) behavior observation, observing the behavior standards of the key factors; 5) identiication of inluences, with the identiication of causality relations between the factors; and 6) identiication of mental models, aiming at identifying beliefs and prerequisites that can help in the creation of the diagram.
In the quantitative modelling phase (hard), aiming at the transformation of causal-looping diagrams into
Chart 1. Elements of the stock and low diagram.
Elements Description
Stock (Quadrant 1) Represents the resources accumulated, for example, the number of projects requested by clients.
Flows (Quadrant 2) These are the activities that produce an increase or reduction of stocks, through subject or information movement within the system analyzed.
Converter (Quadrant 3) Component that signals algebraic operations, processes information about stocks or represents information sources that are external to the system considered.
Connector (Quadrant 4) An information Link that describes the relation between the stocks, lows and converters.
Source: Fernandes (2003), adapted by the Authors.
stock and low diagrams, Fernandes (2003) used the following four steps suggested by Wolstenholme (1994), whose logical sequence helps to understand this transformation: 1) identify resources contained in the causal-looping diagram factors, observing that resources low through the system in the formation of stocks; 2) identify the state of the resources during the transformation inside the system, giving rise to stocks; 3) identify operations that transform resources between states; and 4) model causal-loopings and other factors, which are not considered resources (stocks) or operations (lows), i.e., the converters.
Vitor et al. (2007) suggest a model for the development of DBSC using ive stages, where the qualitative and quantitative models stand out, according to Chart 2, establishing tasks.
2.3.2 IT DBSC research model
The structural issues found in the traditional BSC are applicable to the IT context, as it is indicated by models recognized by IT governance, such as COBIT 5 and ITIL V3, which can lead the IT area to make mistakes in its strategic dynamics.The solution proposed in this study is the incorporation of system dynamics to the IT BSC, as the lack of feedback and the delays regarding the cause and effect hypotheses distort the understanding of strategic behavior dynamics. Thus, the IT strategic objectives can only be tested during strategy deployment, as the anticipated understanding of strategy formulation errors and issues will be suspended until they emerge (Fernandes, 2003). As a result, the following proposals arise as a guide to this study:
P1: The use of soft modelling of system dynamics mitigates the issue of linear, unidirectional and static cause and effect relations of the IT BSC;
P2: The use of hard modelling of system dynamics allows for a better understanding of organizational dynamics; and
P3: The simulation of IT DBSC allows for the anticipated knowledge of the negative and positive impacts of IT organizational strategy.
The development of an applicability model of DBSC as an IT governance mechanism must follow the DBSC construction steps, however using the structure of the strategic map with the peculiarities inherent to IT behavior. Therefore, this study is based on the ive stages proposed by Vitor et al. (2007), as well as on the steps from Senge (1996) on the construction of causal-looping diagrams (qualitative modelling) and those of Wolstenholme (1994) on the transformation of these diagrams into stock and low diagrams (quantitative modelling), described before, adding three assumptions described in Chart 3, outlined by Fernandes (2003).
3 Methodology
This applied descriptive-exploratory research is developed under a mixed method with the strategy of a single study case.
3.1 Unit of analysis
The unit of analysis of the case is the strategic IT management process with the use of BSC by the Brazilian Army’s Telematics System - SisTEx. Therefore, the location of the research is SisTEx, which is composed of the Army’s Integrated Telematics Center (CITEx) and 12 Telematics Area Centers (CTA). Listed on Chart 4 with their respective locations and coverage areas, these centers are active throughout the national territory with a total of 13 Military Organizations (OM) that provide IT services.
SisTEx has the institutional mission of supplying the physical and logical bases for the working of the systems of interest of the Army’s Command and Control Strategic System (SC2Ex), its integration in the Land Force Command and Control System (SC2FTer) and in the Military Command and Control System (SISMC2). It also explores, maintains and
Chart 2. Stages in DBSC construction
Stages Tasks
Start • Formulation and understanding of the organizational mission and vision.
Construction of the Map • Establishment of strategic objectives in cause and effect relations; and• Deinition of indicators.
Qualitative Modelling
• Identiication of critical variables for the organization; and
• As from these critical variables and the strategic objectives, construct the dynamic strategic map through the causal-looping diagram.
Quantitative Modelling • Construction of DBSC through stock and low diagrams; and• Simulation of the DBSC model.
Analysis of organizational
factors • Analysis of the behavior of critical variables for the organization.
accomplishes the technical management of the Army’s Strategic Communications System (SEC), which provides an adequate level of information security. CITEx is the central coordination and execution unit directly subordinated to the Department of Science and Technology (DCT). SisTEx provided all the data used in this research, through documents, information systems and publications.
3.2 Research stages
The results and analysis of this research were developed in qualitative and quantitative phases, with the use of a protocol that had its identiication (project title, person in charge, sponsoring entity, teams, time frame and location), introduction (objetives and justiications), stages of ield work, ield issues, analysis procedures for data collected and the report structure of the study. It must be highlighted that any pressumption used during the qualitative and quantitative stages was based on documents and/or rules used in SisTEx, which were validated before
used by two strategic level military personnel: the Head of the CITEx Technical Division and the Head of the Planning, Integration and Control Area.
3.2.1 Qualitative
This phase was developed with the analysis of documents and with the researcher’s participant observation. The irst, which consists in identifying, verifying and appreciating documents with the objective of making them more understandable, so that they can be correlated to the other data from other sources (Souza et al., 2011), was done with the BSC and OM strategic maps. The objective was to select BSC and OM strategic maps that clearly showed how IT would contribute towards business expectations, as well as having a complete deinition of the causality chain between the strategic objectives, as this study does not aim at correcting OM strategies.
From the BSC and the strategic map selected from one of the OM of SisTEx, the causal-looping diagram was constructed based on the phases, tasks, steps
Chart 3. Assumptions for the IT DBSC.
Assumptions Description
Indicators • Every measure that composes an indicator must come from the organization processes, either inancial, marketing operational or human resources processes.
Critical variables to business dynamics
• For the construction of the causal-looping diagram, variables that can materialize some condition of state (stock) that have a relevant role in the organizational performanece must be outlined;
• These variables can be extracted from the indicators or from the strategic objectives of the strategic map; and
• This list of variables characterize business dynamics and it is important for them to be able to assume numerical values.
Quantitative Information
• It is necessary to have a quantitative survey of the variables as from the list of variables; and
• Obtain information that makes it possible to observe the behavior of variables over time, without any claim to accuracy in the values.
Source: the Authors, as per Fernandes (2003).
Chart 4. Military organizations of SisTEx.
OM Location Area of Inluence (States)
CITEx Brasília–DF All the national territory
1st CTA Porto Alegre–RS Rio Grande do Sul
2nd CTA Rio de Janeiro–RJ Rio de Janeiro and Espírito Santo.
3rd CTA São Paulo–SP São Paulo
4th CTA Manaus–AM Amazonas, Acre, Rondônia and Roraima.
5th CTA Recife–PE Pernambuco, Paraíba, Rio Grande do Norte and Alagoas.
6th CTA Campo Grande–MS Mato Grosso do Sul and Mato Grosso.
7th CTA Brasília–DF Distrito Federal, Goiás and Tocantins.
11th CT Curitiba–PR Paraná and Santa Catarina.
21st CT Belo Horizonte–MG Minas Gerais
41st CT Belém–PA Pará and Amapá.
51st CT Salvador–BA Bahia and Sergipe.
52nd CT Fortaleza–CE Ceará, Maranhão and Piauí.
and assumptions indicated in this research model (Vitor et al., 2007; Senge, 1996; Fernandes, 2003), with the participation of a representative from Senior Management, a representative from the managerial level and one from the CITEx operational level, as part of the researcher’s participant observation.
3.2.2 Quantitative
The proposed IT DBSC model in this stage was simulated and constructed based on a stock and low diagram arising from the transformation of the causal-looping diagram developed in the qualitative phase, as from stages, tasks and assumptions indicated in this research model (Vitor et al., 2007; Wolstenholme, 1994; Fernandes, 2003). The participants in the stock and low diagram construction process were one representative from Senior Management, one representative from the managerial level and one from the CITEx operation level. The diagram was validated by the Head of the Planning, Integration and Control Area (SPIC) at SisTEx; by army personnel from SPIC with knowledge of the system; by the Heads of the CITEx Technical Division and the 4th CTA; and by military personnel from several operational areas of SisTEx.
After that, IT DBSC was exposed to a conirmatory simulation within a proof context, as it was based on an empirical model and data (Vicente, 2005) with the purpose of proving the theory about inherent structural deficiencies in BSC and their negative consequences for IT governance. The modelling and simulation were developed with the software IThink (Isee Systems, 2012), aiming at evaluating the dynamic model constructed. The results were assessed by specialists in simulation techniques and tools, as well as by key people in the research organization.
4 Results and analysis
The results and analysis of this research are distributed into the qualitative phase, where the causal-looping diagram is developed, and into the quantitative phase, which from this diagram elaborates and submits the model to simulation, discusses the arising results and proposes a model for migration from BSC to DBSC, in the domain of IT governance.
4.1 Qualitative phase
Following the selection criteria deined according to the document analysis and for the development of the causal-looping diagram, the strategic maps and BSC of the 3rd and 4th CTA were previously chosen. However, the documents of the 4th CTA were adopted due to easy access and the familiarity the researcher had with its processes, besides the fact that this Center sent its management model to the Amazon Quality
Program (PQA), which makes its BSC a strategic driver validated annualy by the referred program.
4.1.1 Strategic map, BSC and strategic topics of the 4th CTA
In April 2009, the 4th CTA began the implantation of quality management tools suggested by the National Quality Foundation (FNQ) and of governance and IT management models. This aimed at increasing the quality of IT service delivery and, consequently, improving user satisfaction. Its region of coverage (the Amazon) is characterized by serious logistics and access problems, which create an impact in high cost IT solutions with great dificulties regarding maintenance. In this scenario, the 4th CTA decided to adopt BSC as a way of reducing these dificulties and creating a new culture that values strategic and process management, as well as the planning and development of highly motivated labor guided towards IT services.
The strategic map and the BSC of the 4th CTA are divided into these three strategic topics:
1) Increase the Understanding of the Center’s Mission, which has the objective of increasing the strategic presence of the Center and having the best alignment of its services according to its clients’ needs;
2) Improve the Quality of Delivery and Support of IT services, according to processes that comply with the best practices in IT service management models, such as ITIL V3; and
3) Achieving Maturity in Project Management, aiming at project management culture, quality of management, adequate organizational atmosphere, and optimization of acquisition processes for goods and services.
The division into strategic topics makes the development of causal-looping diagrams easier, using the steps proposed by Senge (1996) described in the model of this research for IT DBSC.
4.1.2 Description of the situation of interest and track record of the events
involved the satisfaction rate of service users that remained stable despite the strategic focus given to addressing their needs.
Considering the logic of the map from Strategic Topic 1 (Increase the Understanding of the Center’s Mission), for example, the support and increase in inancial revenue indicated it was possible to invest increasingly in human capital, which when trained and valued would relect directly on the well-being of the workforce, increasing motivation. The result of a highly trained team, following the logic of causality between strategic objectives on the strategic map, would deliver IT services and projects of high quality, signiicantly increasing user satisfaction. In spite of the enhanced service delivery, as well as speed and quality in the delivery of projects, there was no signiicant increase in user satisfaction.
4.1.3 Identiication of critical variables In the construction of the causal-looping diagram, we must focus on the critical variables of business dynamics that can materialize some condition of state (stock) with a relevant role in the organizational performance, as well as being able to take on numerical values. They can be extracted from indicators or strategic objectives of the strategic map. In this context, it can be observed an implementation error in all the OM BSCs of SisTEx, as the indicators used mostly do not materialize into some condition of state, nor do they follow the strategic causality deined by the strategic map.
We notice that the more resources are passed on to OM, the more strategic competencies will be developed. Mapping this causality sequence is quite simple and even logical to some extent. However, when concentrating on the next two strategic objectives, we note that the indicators used and the existing strategic objectives will not be able to materialize a condition of state. This is explained in the model of this research for IT DBSC with regard to the indicators where every measure that composes an indicator must come from the organization processes, whether they are inancial, marketing, operational or human resources processes, for example.
Due to increased training, which had the objective of contributing towards the motivation of military personnel, the strategy intended to Ensure Alignment of the Main IT Services with User Needs, according to the map of Strategic Topic 3 (Achieving Maturity in Project Management). Satisfaction with the Services Rendered and Satisfaction with the User Service are the two indicators pointed out in the BSC of Strategic Topic 3 as possible measures of this strategy. However, systemic dificulty is determined when making these measurements, taking into consideration the indicator in the previous perspective, i.e., Percentage of Strategic
Competencies Developed. After all, considering the previous perspective, there are no organizational processes that can indicate how this percentage can mathematically inluence the two indexes. There is clear causality between objectives, but not between indicators.
In the absence of an indicator (or measure) that can be transformed into a condition of state, we will not use the BSC indicator and what it intended to measure, but the indicator of what it should measure, obeying an internal organizational process. After all, for the simulation it is more important to enable the observation of the variable’s behavior than outlining its value accurately (Fernandes, 2003). In this sense, considering the action of SisTEx as an IT service provider, the addressing of user needs, via services and projects, is considered a systemic priority.
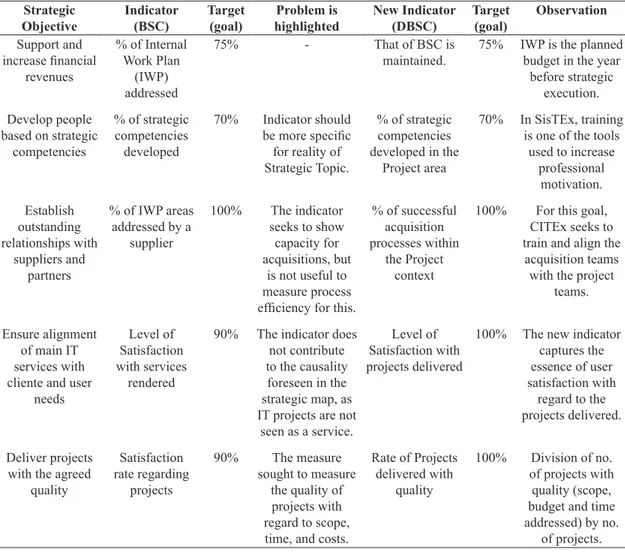
Table 1 presents the indicators of BSC used as reference (that intended to measure) and the new indicators used in the simulation (that should measure) with DBSC, as the mistakes in the construction of the original BSC, due to the lack of perspective of the DS, made the construction of the simulation unfeasible. The strategic CITEx map highlights this priority in its User perspective, where the strategic objective is to Guarantee the Addressing of User Needs. Thus, they decided to deal with the map of Strategic Topic 3 from the 4th CTA, as it included the variables described in the problems presented in the execution of the strategy.
Therefore, these three variables were considered and validated by military personnel from the strategic level, through non-directive interviews: User Satisfaction
(measured through the strategic objective Ensure Alignment of the Main IT Services with Client Needs),
Ensure the Addressing of User Needs (measured through the strategic objective Deliver Projects with the Agreed Quality) and Motivation of Professionals
(measured through the strategic objective Develop People Based on Strategic Competencies).
4.1.4 Causal-looping diagram
As from this deinition, the causality relationship between strategic objectives and/or business variables was developed, according to the diagram showed in Figure 3, which started from the Clients’ perspective and from the strategic objective of Delivering Projects with the Agreed Quality, considering this is the focus of Strategic Topic 3.
Table 1. BSC and DBSC Indicators.
Strategic Objective
Indicator
(BSC) Target (goal) highlightedProblem is
New Indicator
(DBSC) Target (goal) Observation
Support and increase inancial
revenues
% of Internal Work Plan
(IWP) addressed
75% - That of BSC is
maintained.
75% IWP is the planned budget in the year
before strategic execution.
Develop people based on strategic
competencies
% of strategic competencies
developed
70% Indicator should be more speciic for reality of Strategic Topic.
% of strategic competencies developed in the
Project area
70% In SisTEx, training is one of the tools
used to increase professional
motivation.
Establish outstanding relationships with
suppliers and partners
% of IWP areas addressed by a
supplier
100% The indicator seeks to show capacity for acquisitions, but
is not useful to measure process eficiency for this.
% of successful acquisition processes within
the Project context
100% For this goal, CITEx seeks to train and align the
acquisition teams with the project
teams.
Ensure alignment of main IT services with cliente and user
needs
Level of Satisfaction with services
rendered
90% The indicator does not contribute to the causality foreseen in the strategic map, as IT projects are not
seen as a service.
Level of Satisfaction with projects delivered
100% The new indicator captures the essence of user satisfaction with
regard to the projects delivered.
Deliver projects with the agreed
quality
Satisfaction rate regarding
projects
90% The measure
sought to measure the quality of projects with regard to scope, time, and costs.
Rate of Projects delivered with
quality
100% Division of no. of projects with quality (scope, budget and time addressed) by no.
of projects.
most impacting results. The problems in the strategy established will be seen through the balance cycles.
4.2 Quantitative stage
The quantitative stage sought to develop a simulation model based on the Stock and Flow Diagram.
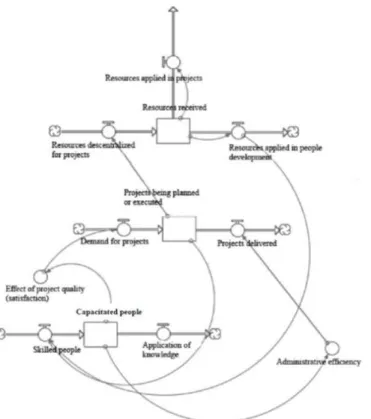
4.2.1 Stock and low diagram
The construction of the stock and low diagram is based on factors deined in the causal-looping diagram and on the elements (resources, states, converters and
connectors) arising from the four steps proposed by Wolstenholme (1994), quoted in the model of this research for the construction of IT DBSC. Figure 4 illustrates the stock and low diagram, through three representation steps.
The irst step (1) is of the balance link E– (1) - professional development - and the factors Develop People Based on Strategic Competencies, Ensure Alignment of the Main IT Services with Client Needs and Deliver Projects with the Agreed Quality. The second (2) is of the balance link E– (1) and Reinforcement link R+ (1) - Increase Financial Revenues, with the addition of the fator Support and Increase Financial
Chart 5. Reinforcement and balance mechanisms.
Link Description
R+ (1)
Results from the delivery of IT projects with quality, generating more demand, increasing the service area and, consequently, there is an increase in inancial revenues that allow for greater development of the workforce.
R+ (2) Results from better control generated by the management systems and reduction of rework. Better solutions will be delivered through projects, increasing the demand for the latter.
R+ (3) Results from revenue increase, as well as use of integrated management systems reduces rework, increasing user satisfaction and demand for projects.
E– (1)
Results from demand increase generated by the constant delivery of high quality projects, which generates a constant allocation of all the technical people in the projects and makes recycling via training dificult.
E– (2)
Results from people’s eficiency in training. There is an increase in acquisition processes, generating more quality in the projects and increasing demand. This generates a constant allocation fo all the technical people in the projects, making recycling via training dificult.
strategic objective Support and Increase Financial Revenues. There is a low of inancial resources towards people development (training) in project management. The more inancial resources are received, the more resources will be accumulated and can be used to hire training services. According to the CITEx inancial track record, the 4th CTA receives on average US$543,000.00 per year for its different activities. On average, 10% of the total value received will be used for training. The rest will be used in the development of projects and daily operational costs. The CITEx makes the resources available in monthly twelfths.
There will be only provision of training resources if there are people who are able to be trained. Furthermore, the projects to be delivered depend a lot on the Center’s administrative eficiency, measured through the strategic objective Establish Outstanding Relationships with Suppliers. The more trained people there are, the greater the eficiency of this factor. All the simulation was based on a period of 36 months (3 years), as this was the period deined in the SisTEx BSC for it to reach its view of the future.
4.2.2 Model simulation
If we compare the results that represent dynamic link E– (1) (see Graph 1) with a possible diagram without feedback (traditional) links (see Graph 2) and the complete causal-looping diagram and its results (see Graph 3), we can observe that the traditional system tends to become increasingly eficient over time. In Graph 1 and Graph 3, as well, we can observe that people are not able to be trained, as the projects are demanded and the ability to address them reaches the organizational limit, as they are involved in planning and execution of the projects.
In other words, through the simulation we can observe a constraining behavior that occurs naturally in organizations. It wouldn’t be possible to note this type of behaviour beforehand without the loop (feedback structure) modelling in the causal-looping diagram and without the attention given to the time variable, two concepts that are not used in the traditional BSC. Revenues to those mentioned before. The third (3),
and last one, of the balance link E– (1), reinforcement link R+ (1) and balance link E– (2) - Eficiency in the Delivery of Projects -, with the added factor Establish Outstanding Relationships with Suppliers.
The strategic objective of Developing People Based on Strategic Competiencies, represented by the lows “Develop people” and “Application of knowledge” and by the stock “Qualiied People”, is enhanced through the inancial resources received, and there is a low of people training. In SisTEx, training is one of the tools to increase professional motivation. In the case of the 4th CTA, there is a team of 12 military personnel in the project management area. If there are inancial resources, there is the formation of a stock of qualiied people. The strategy in this Center is to qualify everyone involved in the projects at least once a year. The minimum target accepted is 70%, according to its BSC. The 4th CTA plans the training of all its project team, at least once a year. For simulation purposes, we consider that after a 12-month cycle, all knowledge needs to be renewed, due to innovations and constant changes in the teams.
Competent people, besides being motivated, tend to develop better organizational processes or Ensure the Alignment of the Main IT Services with Client Needs. The clients who had projects delivered relate this factor to the perception of quality. For the simulation, satisfaction equal to 1 was considered, when the target of training 70% of the personnel was achieved; and 0.5, when up to 50% of the team had been trained. If less than 50% of the project team was trained, satisfaction tended towards zero during the simulation. The higher the client satisfaction, the greater the demand for projects, measured through the strategic objective Delivering Projects with the Agreed Quality. The demand generates a project low, which is stored. The project will only be removed from the stock after it has been concluded. On average, there is one new project request per month in the 4th CTA. The demand can be higher if the user satisfaction increases, or lower if it decreases considerably.
The bigger the number of projects demanded, the more resources are received, according to the
structural BSC failures can be conirmed. In other words, the more qualiied the people, the better the user satisfaction and the more projects can be demanded, in an ininite cycle that goes against the limiting logic of economy itself that requires the enhancement of resources to deal with its scarcity. It is important to highlight that simulations were only possible as from the traditional BSC, using the information from the DBSC.
4.2.3 Discussion of results
Therefore, the three propositions established in this research could be conirmed, as the use of soft modelling for system dynamics mitigated the problems with regard to cause and effect in It is important to highlight that in the real world it
is dificult for the behavior of an organizational variable (or of all the variables) to become more eficient in an unlimited manner, according to that shown in Graph 2.
Following up on the evolution of Graph 3, we can see that over time customer satisfaction begins to diminish due to bottlenecks in the delivery, demotivation of the project teams and knowledge obsolescence in the teams. As a result, the number of projects demanded diminishes considerably. It is natural for an organization that intends to deliver high quality IT projects to not be able to support itself for a long time when it admits to this disastrous cycle.
According to Figure 5 and Graph 2, the behavior foreseen in the literature review about the results of
Graph 2. Behavior of target variables in BSC.
Graph 3. Behavior of target variables in the complete Dynamic BSC.
and effect relations, and the waiting periods between strategic objectives, it was possible to project the negative and positive impacts of the organizational strategy in the referred military institution.
The results of this research can be considered advances in the theoretical and practical aspects linked to BSC. In the theoretical point of view, it was presented the proposal of constructing the IT DBSC, aiming at mitigating structural problems of the BSC in IT governance. In the practical point of view, the results were relected in the strategic culture of SisTEx itself, as it coincided with the development of new Strategic Planning for this System and provided the use of many of the proposals and advances in the work. This highlighted the migration of its BSC towards a dynamic focus and correction of the strategic indicators. This allows for evolution in the maturity of applying BSC in SisTEx.
Among the constraints of this research, we ind those inherent to a case study, such as the impossibility of generalizing the results in the population, in spite of the possibility of theoretical generalization, according to Yin (2001). Besides, the case study was limited to a military context and was based only on a strategic topic for traditional BSC used by one of 13 military organization of SisTEx. More research in other organizational contexts, also in the private sphere, will allow for external generalization.
This research suggests possible future work, such as: validation of the migration model proposed for BSC to DBSC in the IT and the business areas; a survey of the softwares used in the market about BSC and possible improvements in them so as to incorporate the Dynamic BSC; and, also, a proposal of enhancements in the COBIT 5 indicators with the use of Dynamic BSC.
References
Akkermans, H., & Oorschot, K. V. (2002). Developing a Balanced Scorecard with System Dynamics. In: Proceedings of the 20th International International System Dynamics Conference. Palermo: Technische Universiteit Eindhoven.
Barnabè, F. (2010). A system dynamics–based Scorecard to support strategic decision making: insights from a case study. International Journal of Productivity and Performance Management, 60(5), 446-473. http:// dx.doi.org/10.1108/17410401111140383.
Bastos, A. A. P. (2003). A dinâmica de sistemas e a compreensão de estruturas de negócio (Dissertação de mestrado em Administração). Universidade de São Paulo, São Paulo.
Capelo, C., & Dias, F. J. (2009). A System Dinamic-based simulation experiment for testing mental model and performance effects of using the balanced scorecard.
the traditional strategic map, making them more dynamic and taking into consideration the waiting period between the factors considered. The waiting periods and the existing feedback loops in the DBSC dynamic relations of cause and effect allowed for a simulation of the IT organizational strategy, using hard modelling. It was thus possible to project the impacts of decisions over time, as well as anticipate knowledge about positive and negative impacts in the IT organizational strategy.
A serious problem seen in this research is the lack of a systemic view in the choice of strategic indicators used in BSC. According to Kaplan & Norton (1997), many executives believe they already have a BSC because they complement the inancial measures with non-inancial measures, such as customer satisfaction and marketshare. However, if these measures do not offer suficiently speciic guidance for the future, with an adequate bases for allocation of resources, formulation of strategic initiatives and binding of the annual budgets, they will only be generic measures, as they do not describe a unique winning strategy.
A deployment error was observed in all the BSCs of SisTEx - most of the indicators used did not materialize into a condition of state, and they did not follow the logic of strategic causality deined by the strategic map. For Kaplan & Norton (2008), the targets of the strategic objectives should not be deined separately, as they must be related to the targets of the other strategic objectives in a chain of causality. This seems to be quite evident for the system dynamics; it doesn’t seem to be when the traditional BSC is deployed.
If the choice of the indicators does not represent the real dynamics speciic to organization and strategy, following the causality deined in the strategic map and resulting from organization processes, the construction of BSC becomes generic. This makes the follow up of the strategy unfeasible, as there will be a decoupling between the strategy foreseen, the actions developed and the indicators that measure these actions. As a solution, when the indicators are developed, they must incorporate the causality mechanism foreseen in the strategic map and must arise from an organizational process so that it will be possible to measure them.
5 Final considerations
System Dynamics Review, 25(1), 1-34. http://dx.doi. org/10.1002/sdr.413.
Capelo, C., & Dias, F. J. (2010). Balanced Scorecard Dinâmico: uma proposta de modelação da dinâmica das organizações. In R. Pereira. A dinâmica das ciências econômicas e empresariais: contributos para uma visão abrangente (pp. 95-122). Lisboa: Escolar.
Costa, B. S. R. (2004). O Balanced Scorecard em Xeque? Análise das suas limitações e propostas de novas interações através de um estudo de caso em uma indústria automobilística brasileira (Dissertação de mestrado em Engenharia de Produção). Universidade Federal do Rio de Janeiro, Rio de Janeiro.
Fernandes, A. C. (2002). Mapas estratégicos do Balanced Scorecard: contribuições ao seu desenvolvimento. Rio de Janeiro: Universidade Federal do Rio de Janeiro.
Fernandes, A. C. (2003). Scorecard Dinâmico: em direção à integração da Dinâmica de Sistemas com o Balanced Scorecard (Tese de doutorado em Engenharia de Produção). Universidade Federal do Rio de Janeiro, Rio de Janeiro.
Information Systems Audit and Control Association – ISACA. (2012). COBIT 5: enabling process. Rolling Meadows: ISACA.
Isee Systems. (2012). Stella: IThink, version 10: system thinking for business. Lebanon: Isee Systems.
Kaplan, R. S., & Norton, D. P. (1997). A estratégia em ação: Balanced Scorecard. Rio de Janeiro: Campus.
Kaplan, R. S., & Norton, D. P. (2004). Mapas estratégicos. Rio de Janeiro: Campus.
Kaplan, R. S., & Norton, D. P. (2008). A Execução Premium. Rio de Janeiro: Campus.
Kozena, M., & Chládek, T. (2010). Balanced scorecard: surpassed method? Scientiic Papers of the University of Pardubice, 15(17), 113-122.
Kozena, M., Chládek, T., Striteska, M., & Svoboda, O. (2011). Dynamic balanced scorecard: model for sustainable regional development. WSEAS Transactions on Environment and Development, 7(7), 211-221.
Kronmeyer, O. R. (2006). Pilotagem de empresas: uma nova abordagem no desdobramento, implementação e monitoramento da estratégia (Tese de doutorado em Engenharia de Produção). Universidade Federal do Rio Grande do Sul, Porto Alegre.
Luftman, J., & Ben–Zvi, T. (2011). Key issues for IT executives 2011: cautious optimism in uncertain economic times. MIS Quarterly Executive, 10(4), 203-212.
Lyell, D., & McDonnell, G. (2007). A Dynamic Balanced Scorecard for Managing Health Systems Performance. In Proceedings oh the 25th International Conference of the System Dynamics Society and 50th Anniversary Celebration. New York: System Dynamics Society. Recuperado em 22 de novembro de 2013, de http:// www.systemdynamics.org/conferences/2007/proceed/ papers/LYELL277.pdf
Nielsen, S., & Nielsen, E. H. (2013). Transcribing the balanced scorecard into system dynamics: from idea design. International Journal of Business and System Research, 7(1), 25-50. http://dx.doi.org/10.1504/ IJBSR.2013.050618.
Rydzak, F., Magnuszewski, P., Pietruszewski, P., Sendzimir, J., & Chlebus, E. (2004). Teaching the Dynamic Balanced Scorecard. In Proceedings of the 22nd International Conference of the System Dynamics Society. Oxford: Keble College. Recuperado em 22 de novembro de 2013, de http://www.systemdynamics.org/conferences/2004/ SDS_2004/PAPERS/295RYDZA.pdf
Senge, P. M. (1996). A Quinta Disciplina: arte, teoria e prática da organização de aprendizagem. Rio de Janeiro: Best Seller.
Souza, J., Kantorski, L. P., & Luis, M. A. V. (2011). Análise documental e observação participante na pesquisa em saúde mental. Revista Baiana de Enfermagem, 25(2), 221-228.
The Cabinet Office – TCO. (2011). ITIL Core Books: Service Strategy. Norwich: TCO.
Vicente, P. (2005). O uso de simulação como metodologia de pesquisa em ciências sociais. Cadernos EBAPE, 3(1), 1-9. http://dx.doi.org/10.1590/S1679-39512005000100008.
Vitor, J., Añez, M., & Veras, M. (2007). Modelagem e simulação de negócio: método scorecard dinâmico aplicado à formulação de estratégias. Sistemas & Gestão, 2(2), 232-247.
Weill, P., & Ross, J. W. (2006). Governança de Tecnologia da Informação. São Paulo: M. Books.
Wolstenholme, E. F. (1994). A systematic approach to model creation. In J. D. W. Morecroft & J. D. Sterman. Modeling for learning organizations (pp. 175-194). Portland: Productivity Press.