http://dx.doi.org/10.1590/0104-530X2333-15
Resumo: A inovação é um processo organizacional que contribui para o desempenho competitivo de empresas e setores da economia, sendo que a disposição para sua adoção tem ligação com a orientação estratégica estabelecida pela alta gestão dos negócios. O objetivo deste artigo foi identiicar evidências da orientação estratégica adotada no contexto da indústria de transformação brasileira, por meio da análise de dados agregados sobre atividades inovativas deste setor econômico. Buscou-se, também, identiicar possíveis inluências da orientação estratégica sobre componentes do desempenho deste setor. Para tanto, foram utilizados dados da Pesquisa de Inovação – PINTEC, em suas várias edições, que trazem dados agregados sobre a indústria de transformação brasileira. Os resultados sugerem que a orientação para o mercado está presente no contexto desta indústria, contribuindo para a reduzida disposição ao investimento em atividades inovativas e desestimulando o aprimoramento de capacidades para inovar. Os resultados sugerem que a orientação para o mercado representa uma forma de resposta do setor industrial à instabilidade e descontinuidade que prevalecem no ambiente, com relexos importantes no investimento para o desenvolvimento dos recursos internos e capacidades inovativas empresariais.
Palavras-chave: Atividades inovativas; Orientação estratégica; Orientação para o mercado; Inovação; PINTEC. Abstract: Innovation is an organizational process that contributes to the competitive performance of companies from various sectors of the economy, and willingness to adopt it is connected with the strategic orientation set by senior management. The aim of this article was to identify evidence of the strategic orientation adopted in the context of the Brazilian manufacturing industry by analyzing the aggregate data on innovative activities in this economic sector. To this end, we used data from various issues of Innovation Survey (PINTEC), which includes aggregate data on the Brazilian manufacturing industry. The results suggest that market orientation is present in the context of this industry, inluencing the decreasing willingness to invest in innovative activities and discouraging the improvement of capabilities for innovating. The results suggest that market orientation represents a form of response from the industrial sector to the instability and discontinuity that prevail in this environment, with important relections on investment in the development of internal resources and innovative capabilities.
Keywords: Innovative activities; Strategic orientation; Market orientation; Innovation; PINTEC.
Strategic orientation and innovative activities: an
analysis using the PINTEC data from 1998 to 2011
Orientação estratégica e atividades inovativas: uma análise a partir dos dados da PINTEC no período de 1998 a 2011
Adalberto de Ramos Cássia1
Silvia Novaes Zilber1
1 Programa de Pós-graduação em Administração – PPGA, Universidade Nove de Julho – Uninove, Av. Francisco Matarazzo, 612, CEP 05001-100, São Paulo, SP, Brazil, e-mail: [email protected]; [email protected]
Received May 27, 2015 - Accepted Oct. 1, 2015 Financial support: None.
1 Introduction
Innovation is an organizational process that can aid the competitive performance of a company (Gatignon & Xuereb, 1997; Narver & Slater, 1990). Companies that allocate resources and capabilities to improve their innovation processes tend to boost their chances of competing successfully in the markets in which they operate (Day, 1997; Gatignon & Xuereb, 1997; Narver & Slater, 1990). The innovation process encompasses innovative activities by companies in their search for products and processes improvements (Greenley, 1995). These innovative activities sustain the organizational effort towards innovation.
In addition to Research and Development (R&D), other activities unrelated to R&D that help to improve the innovative capability are involved. These include the introduction of technological innovations to the market, training and the purchase of machinery and equipment (IBGE, 2013). The data produced by the Brazilian Institute of Geography and Statistics (IBGE) through the Technological Innovation Industrial Survey (PINTEC-IBGE) show that some innovative activities integrate efforts to improve the innovation process,
but also show the inluence of external factors that
As demonstrated in several theoretical and empirical studies, innovative activities favor the innovation process in the context of the company (Ngo & O’Cass, 2012; Bodlaj et al., 2012; Küster & Vila, 2011; Cambra-Fierro et al., 2011).
However, despite the knowledge that has been built on the relationships between innovation and business performance, many gaps remain concerning how these relationships are established and how companies can take advantage of innovation to renew their strategic orientations and face an increasingly
unpredictable environment that is dificult to understand
(Atuahene-Gima, 1995).
The willingness of companies to adopt innovation and make it a central activity appears to be linked to strategic orientation, which influences the top management when it comes to determining directives and decision-making (Chang et al., 2014; Atuahene-Gima, 1995).
Strategic orientation involves the guiding principles that shape the managerial decision-making of a
company, the coniguration of its resources and
its interaction with the market in which it operates (Chen et al., 2014; Song & Parry, 2009; Gatignon & Xuereb, 1997).
Especially in unstable environments, strategic orientation appears to be an effort by a company to address shortages of resources and capabilities
and overcome obstacles and dificulties by using
innovative activities to enrich its innovation process (Day, 1997).
Strategic orientation constitutes a determining factor in ensuring that innovative activities produce positive results for a company (Ozkaya et al., 2015). The behavior required to satisfy the needs and
expectations of customers inluences the innovative
activities that can help to enhance business performance, particularly in environments in which changes are rapid and discontinuous (Zhou et al., 2005; Greenley, 1995).
Market orientation, which is derived from strategic orientation, includes the generation and dissemination of marketing intelligence in the organizational environment, providing means for understanding the current and future needs of customers and aiding the understanding of environmental variables that can aid business decisions (Deshpandé et al., 2012; Kohli & Jaworski, 1990). In the context of
industry, market orientation may be relected in the
efforts toward innovation, showing the environment
inluence over the perception of importance of some
innovative activities and in the resources allocation to these activities.
This type of orientation is closely related to the innovative activities of a company, as they can be enriched by information from the external environment
that can help to improve the company’s knowledge. Consequently, the company will respond more quickly
and eficiently to competitive challenges, protecting
itself against adversities resulting from changes in the environment caused by technological changes,
intensiication of government regulations and the
growing volatility of demand (Day, 1997).
Therefore, the aim of this article was to identify evidence in the strategic orientation adopted in the Brazilian industrial context by analyzing aggregate data on innovative activities in this economic sector.
The article also sought to identify possible inluences
of strategic orientation on the performance components of this sector.
By examining aspects of the strategic orientation
adopted in the industrial sector and its inluence on
performance, it is possible to gain a better understanding of the motives that explain the corporate behavior of the manufacturing industry. It is also possible to explain the proposition for stimuli for the growth and development of new capabilities that help to increase the competitive capacity of this sector of the Brazilian economy, especially measures to increase interest in innovative activities to boost the innovation process.
In this sense, observing a sector of the economy exposed to an unstable environment can help to identify evidence of the strategic orientation and its impact on performance. Thus, the use of public
data on innovation in this speciic sector is a feasible
alternative in the effort to achieve this goal. One of the sectors that has been affected by the instability, unpredictability and discontinuity of the environment is the manufacturing sector. It has been addressed in studies on innovation and its impacts (Fagerberg et al., 2007; Varum & Pinho, 2007; Vázquez et al., 2001), and this opens up the possibility for conducting studies considering the available data.
The source of data chosen for the analyses conducted in this study was the various editions of the Innovation Survey (PINTEC) (2000, 2003, 2005, 2008 and 2011) of the Brazilian Institute of Geography and Statistics (IBGE). The PINTEC provides an idea of the behavior of the manufacturing industry over time.
It is important to point out that a number of studies (Tironi, 2005; Kato et al., 2008; Rocha & Dufloth, 2009; Cavalcante & De Negri, 2010) have analyzed aggregate PINTEC data that are available for consultation and have reached conclusions on the different aspects related to innovation in Brazilian industry as a segment. It is important to highlight that the articles that have made use of the PINTEC as a source of innovation indicators normally use
only one of the editions available. We did not ind
analysis. This is an important contribution of the present study.
Tironi & Cruz (2008) claim that studies such as those conducted by the different versions of the PINTEC provide better knowledge on the innovation process, while Kato et al. (2008) claim that increasingly greater importance is attributed to industrial sectors. This corroborates the approach of the present study, which uses secondary data from the PINTEC through tables published by the IBGE, “thereby constituting documentation belonging to a public agency and exempt from any analytical treatment”. Thus, an initial observation has to do with the data extracted from this source, which, aggregated at the level of the manufacturing industry, do not permit an analysis at the level of a corporate unit. Therefore, the analyses conducted are relative to the group of the industrial sector as a whole.
2 Theoretical framework
2.1 Strategic orientationStrategic orientation corresponds to the guiding principles that shape managerial decision-making in
a company, the coniguration of its resources and its
interaction with the market in question (Chen et al., 2014; Song & Parry, 2009; Gatignon & Xuereb, 1997). Regarding innovation, a strategic orientation
inluences and directs the development of innovative
activities by a company to make its relationship with its customers more dynamic (Zhou et al., 2005).
The strategic orientation relects the beliefs
and values that are deeply rooted in the company
and deine its focus for achieving a competitive
advantage, constituting a determining factor for the
coniguration of the resources required to achieve
this goal (Scott-Kennel & Giroud, 2015; Gatignon & Xuereb, 1997; Day, 1994). As it is found in the framework of the organizational system, the strategic
orientation relects the managers’ focus of attention
and the extent to which they are dedicated to it (Chen et al., 2014; Gatignon & Xuereb, 1997).
Market orientation is associated with the implementation of the marketing concept and the organization oriented for the market, where actions are coherent with the concept of marketing (Kohli & Jaworski, 1990; Narver & Slater, 1990).
Studies on market orientation seek to understand the various dimensions of the concept, with a special focus on two components that characterize the focal points of a company (Ozkaya et al., 2015; Aminu & Shariff, 2015; Chen et al., 2015). One component has to do with customers and the continuous need of the company to satisfy their needs and expectations to ensure a market share and gain value from differentiated products and services. The other component is
associated with competitors. The company seeks detailed knowledge of what is happening in the market, the potential reaction to the adversities of
the environment and the coniguration of resources
maintained by the competition that might erode its competitive advantages (Ozkaya et al., 2015). In these components of the concept of strategic market orientation, innovation stands out because of the possibility of making an effective differentiation in products and services feasible, strengthening the presence of the company in the market and helping
to raise its proit margins (Ford & Paladino, 2013).
Market orientation has been considered one of the main drivers of performance in innovation in corporate contexts, particularly in the performance of product innovation (Wang, 2015; Ford & Paladino, 2013). Market orientation is the behavior of a company that ensures that products and services are developed to meet the needs and expectations of customers (Keelson, 2014; Ford & Paladino, 2013).
2.2 Innovative activities in the manufacturing industry
Innovative activities are the result of corporate decisions that focus on promoting innovation in the context of an entrepreneurial venture. There are two
sets of innovative activities (IBGE, 2013). The irst
set is made up of activities related to Research and Development (R&D), including basic research, applied research or experimental development. The second set includes other activities that are not related to R&D, involving the acquisition of external knowledge, goods and services.
The resources allocated to innovative activities are representative of the company’s efforts to innovate (IBGE, 2013). There is an economic sense in the exercise of innovative activities regarding the use of
resources (inancial, material and human) in order to
promote an economic return for the business. There is also a strategic sense in the context of directives followed by company to conduct activities that are in
tune with the strategic orientation deined and used
by companies to achieve and maintain a competitive advantage in their business (CNI, 2015).
There were two important occasions in the timeline of the Brazilian manufacturing industry between 1947 and 2013. From 1947 to 1985, there was a growth in its relative share of GDP. From 1985 to 2013, this share was reduced to the point that it had dropped to the level of 13.1% by 2013, according to a study conducted by the São Paulo State Federation of Industries (FIESP, 2014).
According to the study by the FIESP (2014), between 1950 and 1985, there was intense growth,
diversiication and consolidation of the Brazilian
of the relative share of GDP (27.2%). From 1986, there was an expressive drop in the share of the manufacturing industry in the nation’s aggregate production, signaling a deindustrialization process (FIESP, 2014, p. 6).
Innovation plays a mediating role in the relationship between market orientation and company performance (Chang et al., 2014).
The effect of market orientation on company performance is stronger for industrial companies than it is for service providers (Chang et al., 2014).
3 Methodological procedures
The data used in this study were extracted from the Innovation Survey (PINTEC) conducted by the Brazilian Institute of Geography and Statistics (IBGE) for the following periods: 1998-2000 (IBGE, 2002), 2001-2003 (IBGE, 2005), 2003-2005 (IBGE, 2007), 2006-2008 (IBGE, 2010) and 2009-2011 (IBGE, 2013).
The environment in question in the PINTEC is Brazilian industry, and this study focuses on the manufacturing industry. The treatment of the data considers an aggregate structure at the national level because the PINTEC publishes data at the national level, with only some data at the state level.
The analysis unit is the Brazilian manufacturing
industry, as deined in the PINTEC, even though the
available data are aggregated at the national level. Relative data were used, presented in percentage form to facilitate the understanding of their share in the set or their evolution between the periods in question.
The study is theoretical and empirical in nature, with a longitudinal approach, seeking to characterize the strategic orientations adopted in the Brazilian manufacturing industry by identifying the innovation activities. An attempt was also made to identify how
this strategic orientation inluenced performance.
4 Discussion of the results
4.1 Behavior of the manufacturingindustry in relation to investment in innovative activities
Strategic market orientation inluences the decisions
of companies regarding innovative activities (Zhou et al.,
2005; Greenley, 1995). Studies have identiied this
association, showing that market orientation facilitates innovation with advanced technologies and offers
signiicant beneits to customers (Zhou et al., 2005). This consideration is relected in the high percentages
of innovative companies that place a great deal of importance on innovative activities, such as the acquisition of machinery and equipment (58%) and training (43%), as shown in Table 1. The numbers are also expressive for innovative companies that have invested in these activities, which are viewed as a benchmark, especially when 81% of innovative companies have invested in innovative activities involving the purchase of machinery and equipment.
This evidence is compatible with the indings of Zhou et al. (2005). These authors identiied a positive
impact of market orientation on technological innovation and emphasized that market orientation facilitates technological innovations that seek to meet the needs of a company’s main customers. This is
also in keeping with the indings of Slater & Narver
(1998, 1999), who claim that market orientation is much more than a concept of orientation concerning the customer. It can also help to identify visible and latent needs of the most important customers, helping companies to achieve a competitive advantage and superior performance.
The percentage of companies that attach a high level of importance to the innovative activities listed in Table 1 was calculated as the ratio between the number of companies that claimed that the development of activities was of great importance and the number of companies that implemented
Table 1. Percentage variation of the number of companies with expenditure on innovative activities for the years 2009-2011.
INNOVATIVE ACTIVITIES
PERCENTAGE OF COMPANIES THAT ATTACH A HIGH DEGREE OF
IMPORTANCE
PERCENTAGE OF COPMANIES WITH
EXPENDITURE
Internal R&D activities 10% 18%
External acquisition of R&D 5% 6%
Acquisition of software 23% 32%
Acquisition of machinery and equipment 58% 81%
Training 43% 29%
Introduction of tech. innovations on the market 20% 25%
Industrial project and other technical preparations 19% 26%
innovations. As shown in Table 1, of the companies that implemented innovations, 10% attached a high degree of importance to conducting internal R&D activities.
The percentage of companies that spend money on innovative activities was calculated as the ratio between the number of companies that invested in a certain innovative activity and the number of companies that spent money on innovative activities. Thus, of the companies that invested in innovative activities, 18% invested in internal R&D activities.
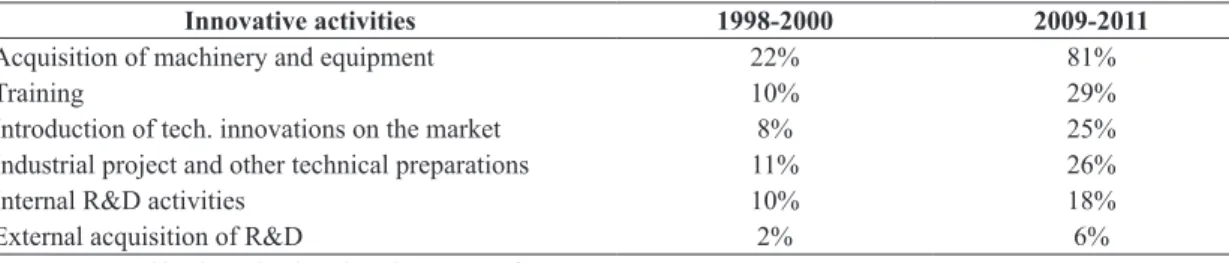
In terms of the evolving importance of certain innovative activities, Table 2 shows that 81% of companies that innovated invested in the acquisition of machinery and equipment between 2009 and 2011, in comparison with the 22% that did so from 1998 to 2000. This innovative activity received the most attention from the innovative companies included in the study.
As shown in Table 2, all the innovative activities included in the survey registered a higher percentage of companies that made some type of investment in innovative activities. This information shows that companies sought to invest in innovation. This evidence resonates in the results of studies by Narver & Slater
(1990), who identiied technological innovations as being representative of the signiicant relationship
between market orientation and the innovative activities of companies, as can be observed in the introduction of technological innovations to the market, which rose from 8% of innovative companies (1998-2000) to 25% (2009-2011).
4.2 Aspects of inancing for innovative
activities
Access to inancial resources means the availability of inancial capital and other inancial services that
are within the reach of the company (Aminu & Shariff, 2015).
Access to inancing has to do with the difference
between the company’s demand for resources and the supply of the necessary resources (Aminu &
Shariff, 2015). It implies the non-existence of inancial barriers and non-inancial barriers or minimum levels
of existence, the costs of which are compatible with the capital structure of the company and its possible reciprocity and guarantees (Aminu & Shariff, 2015).
The data in Table 3 show that the percentage of companies that innovated and resorted to external
resources to inance their innovative activities rose
from 12% in 1998-2000 to 15% in 2009-2011, a sign that there may have been increasing access to
external inancial services, in keeping with the indings
of Aminu & Shariff (2015). On the other hand, the
signiicant use of a company’s own resources, with
88% (1998-2000) and 85% (2009-2011), reveals the other side of the process presented by Aminu &
Shariff (2015). In other words, the cost of inance
is incompatible with the capital structure of the company or it has possibilities of reciprocity and
guarantees that are insuficient to ensure access to inancial services, and their only option is to resort
to resources generated by their own activities or rely on resources belonging to the owners (Aminu & Shariff, 2015).
Table 2. Percentages of companies that invested in innovative activities in the periods covering 1998-2000 and 2009-2011.
Innovative activities 1998-2000 2009-2011
Acquisition of machinery and equipment 22% 81%
Training 10% 29%
Introduction of tech. innovations on the market 8% 25%
Industrial project and other technical preparations 11% 26%
Internal R&D activities 10% 18%
External acquisition of R&D 2% 6%
Source: Prepared by the author based on the PINTEC for 2002-2013.
Table 3. Percentages of companies with their respective sources of resources used for investments in innovative activities for 1998-2000 and 2009-2011.
SOURCES OF RESOURCES USED IN INNOVATIVE ACTIVITIES 1998-2000 2009-2011
Own resources 88% 85%
Third-party resources 12% 15%
Resources obtained from public sources 8% 12%
Resources obtained from private sources 4% 3%
In terms of access to third-party resources, as shown in Table 3, most of the resources are obtained from public sources, with the number of companies using these resources rising from 8% in 1998-2000
to 12% in 2009-2011. Studies on the inancing of
innovative activities in companies (Melo, 2010; Rapini, 2010) found that companies that decided to conduct innovative activities, considered high risk and of uncertain success, could not count fully on
the private inancial system to fund their projects. Therefore, a signiicant number were obliged to obtain their third-party inancing from public resources.
Although public resources tend to be obtained under more favorable conditions in terms of cost, period of amortization, reciprocity and guarantees, these
resources are very dificult to obtain due to excessive
bureaucracy or long administrative procedures prior
to their liberation. This channel to inancial resources
is often incompatible with corporate activities, especially for companies that operate in markets or sectors with a certain level of competition (Melo, 2010; Rapini, 2010; Melo, 2008).
When investigating the association between
strategic orientation and access to inancing, Aminu &
Shariff (2015) found a negative relationship between
strategic orientation and access to inance, speciically
for strategic orientation linked to entrepreneurship, which maintains a strong association with innovative activities (Aminu & Shariff, 2015). Many companies perceive the risk and the hostile environment for businesses that are not promising in terms of high returns on invested capital. Innovative activities are very risky and are not very easy to execute when the
environment is demarcated with signiicant challenges
(Corder & Salles-Filho, 2005). Strategic orientation for entrepreneurship incurs high risks in its constant search for new opportunities, and it cannot guarantee
success, especially in terms of inancial return (Corder
& Salles-Filho, 2005).
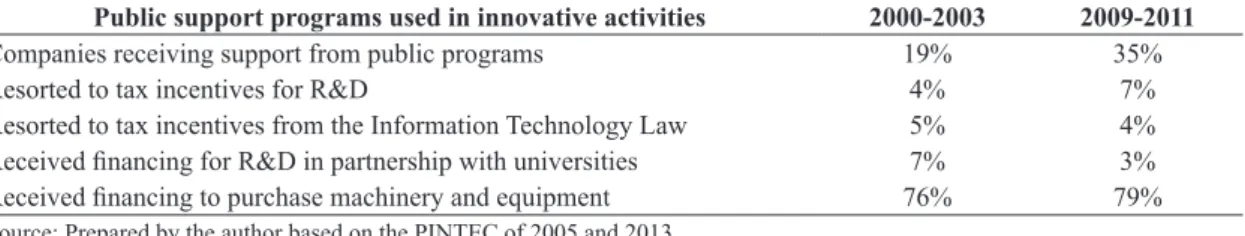
A more detailed examination of public support
achieved by companies, speciically companies
included in the PINTEC, shows a considerable rise in the percentage of companies that received some type of support from public programs, as shown in Table 4. The contingent of companies rose from 19%
(2000-2003) to 35% (2009-2011), suggesting that, for the periods in question, a higher percentage of companies that claimed to have innovated had some
public support when it came to obtaining inancial
resources earmarked for innovative activities. A considerable number of companies that received public support reported that the resources were used to purchase machinery and equipment. This number was 76% in 2000-2003, and rose to 79% in 2009-2011, as shown in Table 4. These values are compatible with the percentage of companies that attached a high level of importance to the innovative activity of purchasing machinery and equipment (58%, as shown in Table 1) and the percentage of companies that invested in acquiring machinery and equ9ipment (81%, as shown in Table 1).
Observing the evolution of the percentages of companies that achieved some type of public support
to obtain inancial resources for their innovative
activities (Figure 1), the most signiicant component
is associated with inancing, which implies the need
to repay the resources obtained, in addition to interest and other charges.
As shown in Figure 1, low percentages of companies have access to tax incentive programs, and few companies obtained grants, i.e., resources that do not involve amortization, interest or other monetary fees. Grants are especially important for companies in their early days, as a grant is a source of necessary resources for making innovation projects and even technology companies feasible (Costa et al., 2013). New technology-based businesses emerge in response to perceived opportunities in the market. They are built around innovations with the power to make a very positive impact on the segments for which
they are intended. However, they also lack inancial
resources and managerial capability when it comes to applying for or using these resources. This means that a grant is a very important alternative, as it is not necessary for the company to repay this sum (Costa, 2013). The low percentage of companies with access to this kind of resource during the two periods in question (2008 and 2011) suggests that other sources of grant could be used by the companies, as is the case of non-governmental organizations that earmark
Table 4. Percentages of companies with respective uses of public support for investments in innovative activities for 2000-2003 and 2009-2011.
Public support programs used in innovative activities 2000-2003 2009-2011
Companies receiving support from public programs 19% 35%
Resorted to tax incentives for R&D 4% 7%
Resorted to tax incentives from the Information Technology Law 5% 4%
Received inancing for R&D in partnership with universities 7% 3% Received inancing to purchase machinery and equipment 76% 79%
increasingly signiicant amounts for the funding of
companies in their early stages. Another source of resources that may be used by new companies may be obtained from institutions that are dedicated to
providing inancial resources to new companies with
a share in the capital. Normally, technology-based companies with a high and rapid growth potential
beneit from such operations, and this form of inancing
becomes an alternative to grants from public programs to support innovation (Andrade, 2009).
Strategic orientation involving and providing
directives for inancial decisions regarding obtaining
resources for a company largely determines its capacity for success (Melo, 2010). Technology orientation directs the attention of the company towards seizing market opportunities, counting on a low-cost strategy,
which inluences the capture of resources in certain
patterns of cost and deadline. This makes the cost of projects compatible with the capture of part of the value created for the customer at levels that might indicate a favorable return for the company (Curi, 2007). Market orientation leads a company to identify
and understand the speciic needs of customers that
may come within the company’s range of action
and allow signiicant shares of the value created for
the customer to be captured through differentiated products (Curi, 2007).
4.3 Consequences of conducting
innovative activities in the context of market orientation
Two sets of strategic decisions (obtaining and
allocating inancial resources) are related to a company’s
performance in terms of innovation (Rapini, 2010). In the context of strategic market orientation, decisions are made as a result of the need for the constant adaptation of the company to the conditions of the external environment (Paladino, 2007; Laforet, 2008).
Consequently, a company can increase or reduce
the inancial resources intended for innovative
activities, as it perceives how these activities can generate a higher or lower return in comparison with other alternatives (Stefanovitz, 2011).
Acting in keeping with the needs and expectations of customers leads to the improvement of mechanisms that are used to generate, capture, treat and disseminate information to enrich the intelligence of the organization and create new knowledge (Curi, 2007).
This new knowledge has a direct impact on innovative activities and results in innovations in products, processes, organization and marketing, ensuring that the projects conducted by the company can help to achieve and maintain a competitive advantage in the markets in which the company operates or intends to become active (Curi, 2007).
Table 5 shows the performance of the set of companies in the Brazilian manufacturing industry involved in the study, exposing a result of a reduced percentage of companies that introduced an innovation in product and/or process (-17%), organization and/or marketing (-44%), in a comparison between the periods of 2000 and 2011. This information suggests behavior in keeping with market orientation, particularly if the effects of the environment context on the behavior of companies are considered. During this observation period, events occurred that made the environment more discontinuous and uncertain. These included a serious economic crisis, drastic technological changes, growing government intervention in the market domain,
signiicant changes in the income of families, with
a heavy impact on demand and product features to meet the more exigent requirements of consumers. Other events included higher levels of bureaucracy and taxation, resulting in losses for companies and the need to expand their control structures (CNI, 2015).
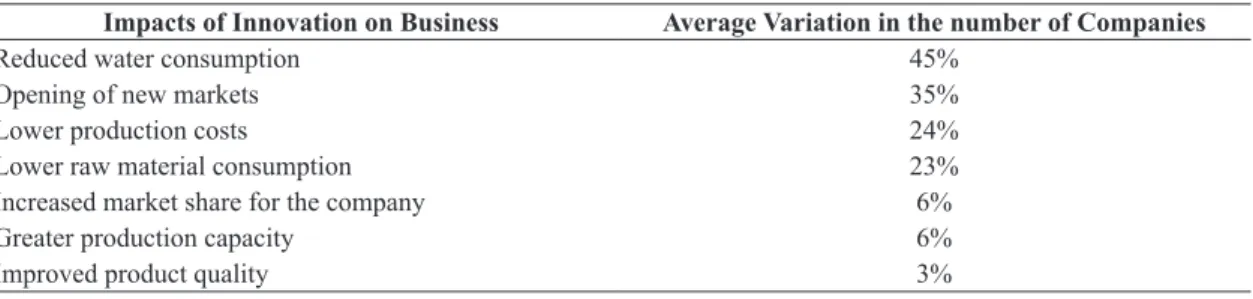
Even with budget constraints on innovative activities, the companies that achieved some form of innovation claimed that they managed to improve important aspects of their businesses. Table 6 shows the average percentages of companies that made some type of impact caused by innovative activities on their administrative, productive and commercial structures.
In terms of market orientation, the numbers showing a growth in the number of companies that successfully achieved the opening of new markets and increasing the number of markets in which they operated is of great importance. Table 6 shows that there was a 35% increase in the number of companies that opened new markets as a result of their marketing actions, including innovative activities. Table 6 also shows an increase in the number of companies that increased their market share (6%).
These data corroborate the indings of studies that
pointed out the proximity between market orientation and innovative activities, leading to a growth in a positive indicator linked to business performance (Sanal et al., 2013).
The study conducted by Sanal et al. (2013) indicates a positive relationship between explorative market orientation, suggesting an emphasis on performance in innovation in comparison with responsive market orientation, which has a closer relationship with improving the innovative strategy that places more
emphasis on inancial performance.
The other impacts identiied in Table 6, despite their effect on the internal structure of the companies, favor performance propelled by market orientation, notably the reduced costs and improved quality of
products, which help to increase proit margins and
value delivered to clients. This, consequently, helps the company to retain part of this value that it created (Kühl & Cunha, 2013; Pereira, 2010).
Although some indicators may show that innovative activities somehow aid business performance, many problems and obstacles remain to be overcome for companies to have innovation on their horizon of action (Kühl & Cunha, 2013; Pereira, 2010).
The focus of market oriented companies on understanding and satisfying the need of customers
often leads to a variety of beneicial results, including
increased sales and market share, improved promotional efforts, services to clients, employee morale and product innovation (Chang et al., 2014).
Companies that succeeded in some form of innovation and companies that did not manage to
innovate both reported highly signiicant problems
and obstacles that put the brakes on the expansion of projects involving innovative activities. Table 7 shows that, for companies that innovated, the costs and risks inherent to these activities remained high,
as did the shortage of staff and sources of inancing
that could be used to strengthen innovation in the context of the companies included in the PINTEC.
Of the problems and obstacles that were identiied
as the most important by the companies that innovated, most are related to strategic market orientation, as they involve elements of the company interacting with its business environment, such as the availability
of qualiied labor on the labor market that can be
used by the companies in their innovation projects. Other obstacles include the lack of external technical services that are compatible with the needs of the companies, problems related to cooperation with other companies and institutions that could help to improve innovation projects. Two fundamental components
relect the market orientation of the companies have
to do with the lack of information on technologies and markets. Another factor that stands out in Table 7 is the weak response from consumers to the new products launched by the companies.
The study by Aminu & Shariff (2015) found that
companies that conigure and use their strategic activities are more likely to have a better cash low, proits and inancial returns. This helps when it comes to obtaining inancial resources from external
sources. They suggest that to achieve more adequate
levels of inancial capital, companies need to improve
Table 5. Variation of the number of companies that sought to innovate in the Brazilian manufacturing industry from 2000 to 2011.
Characteristics Variation in the number of companies
Innovated in product and/or process
-17%
Innovated in organization and/or marketing
-44%
Source: Prepared by the author based on the PINTEC for 2002 to 2013.
Table 6. Variation in the number of companies with the respective impacts identiied in their businesses from 2000 to 2011.
Impacts of Innovation on Business Average Variation in the number of Companies
Reduced water consumption 45%
Opening of new markets 35%
Lower production costs 24%
Lower raw material consumption 23%
Increased market share for the company 6%
Greater production capacity 6%
Improved product quality 3%
their activities on the market and learn more quickly through their market experiences and the development of technology-based products.
The study conducted by Kühl & Cunha (2013) aimed to verify the perception of industrial companies regarding obstacles to innovation. Among the obstacles,
it identiied the lack of qualiied personnel and, mainly,
the lack of information on technology. This result is compatible with the percentages shown in Table 7, registering an increase from 11% (1998-2000) to 14% (2009-2011) among companies that did not innovate. There was a similar increase for those that did innovate, rising from 12% (1998-2000) to 16% (2009-2011) in the number of companies that recognized the lack of information on technology as an obstacle with a high degree of importance.
5 Conclusions
This article set out to identify evidence of strategic orientation adopted in the context of the Brazilian manufacturing industry by analyzing aggregate data on innovative activities in this economic sector.
It also sought to identify possible inluences of this
strategic orientation on performance components in the sector. Using aggregate data extracted from the PINTEC, the study addressed the innovative activities of the manufacturing industry, the expenditure and
the predominant form of inancing of these activities,
in addition to the impact on performance and the obstacles that the sector faces when it comes to innovation. Although the data are aggregate, enabling an approach to the industry as a whole, several aspects are important when identifying the strategic orientation adopted by the companies and manifested in their decisions.
When addressing the innovative activities in industry, it is clear that the activities that focus on
the interaction of elements of innovation with the market are among the main aspects of the companies in question, especially introducing new technological innovations to the market. Other important activities are the ones highlighted in all editions of the PINTEC concerning the acquisition of machinery and equipment, training and, more recently, the acquisition of software.
Expenditure on these activities is highlighted in the results, symbolizing the earmarking of resources and organizational efforts for greater interaction of companies with the markets and closer attention to the needs and expectations of customers. This shows a tendency towards market orientation, as envisaged by Ford & Paladino (2013), with innovation emerging as a way to make the differentiation of products and services feasible.
Regarding decisions on inancing, the sector
shows signs of being in tune with the conditions of the business environment, with a cautious posture concerning the structure of capital used to provide resources for innovative activities. Companies
make signiicant use of its own resources rather
than third-party resources and the incipient use of public programs that support innovation. In terms of access to public programs, the data from the most recent edition of the PINTEC show that little use is made of mechanisms involving tax incentives, funding for R&D activities and grants. Greater use
is made of inancing for the purchase of machinery
and equipment, showing that companies perceive opportunities in the external environment in terms of upgrading and modernizing their infrastructure
to gain eficiency and improve the quality of their
products in keeping with the needs and expectations of their customers, a central point of strategic market orientation.
The restrained willingness to invest in innovative
activities is relected in performance, with percentages
Table 7. Comparative evolution of the percentages of companies that attached great importance to problems and obstacles to innovation in eh Brazilian manufacturing industry during the periods of 1998-2000 and 2009-2011.
Problems and obstacles with high levels of importance
Companies that did not
innovate Companies that innovate 1998-2000 2009-2011 1998-2000 2009-2011
High costs of innovation 66% 56% 60% 52%
Lack of qualiied personnel 16% 41% 20% 49%
Excessive economic risks 48% 44% 49% 42%
Lack of appropriate sources of inancing 45% 39% 47% 42%
Lack of adequate external technical services 11% 19% 10% 24%
Few possibilities for cooperation 13% 13% 16% 21%
Dificulties adapting to standards and norms 11% 16% 9% 19%
Lack of information on technology 11% 14% 12% 16%
Organizational rigidity 7% 13% 6% 15%
Lack of information on markets 9% 10% 10% 14%
Weak response from consumers to new products 8% 10% 8% 12%
that show a reduction in the number of companies introducing innovations in terms of product, process, organization or marketing. This cautious posture is evidence of the association of innovative activities with strategic market orientation, with the sector taking this defensive stance in the face of growing levels of uncertainty in the economic environment in which the manufacturing industry is embedded.
The cautious behavior adopted by the sector shows that it has a market orientation posture and
is relected in the impact that innovative activities
have on business performance. Opening new markets, increasing market share and improving the quality of products are results associated the strategic orientation that focuses on the market as an important factor for the growth of a business. The data suggest less of an impact from innovative activities in these indicators, which is a result of the shrinking expenditure by the industry, showing the presence of market orientation in decisions that take into consideration an environment with diminishing economic activity.
The cautious stance of the industrial sector in terms
of investments and inancing for innovative activities
is in keeping with strategic market orientation, as shown by the indicators of the most serious obstacles
to companies. Notably, dificulties involving the cost
of innovative activities and the excessive economic
risks involved in obtaining inancial resources for innovation projects are signiicant factors in the
strategic decisions of companies in the manufacturing industry.
The evidence gathered by observing some factors linked to the decisions of companies in relation to innovative activities and the results of these decisions indicate that the companies adopt strategic market orientation. In a restrictive environment with a high degree of uncertainty concerning economic
perspectives and the dificulties associated with investments and inancing for innovative activities, the
industry follows a cautious orientation and monitors the market very closely.
Limitations regarding the aggregate data prevented a more in-depth study at the company level and precluded a more detailed statistical analysis of the relationships between the variables used in this study. Suggestions for future studies on this topic include addressing the association between innovative activities and the strategic orientation of companies that operate in the manufacturing industry.
References
Aminu, I. M., & Shariff, M. N. M. (2015). Influence of strategic orientation on smes access to finance in Nigeria. Asian Social Science, 11(4), 1-13.
Andrade, A. Z. B. (2009). Estudo comparativo entre a subvenção econômica à inovação operada pela
FINEP e programas correlatos de subsídio em países desenvolvidos (Dissertação de mestrado). Fundação Getulio Vargas, Rio de Janeiro.
Atuahene-Gima, K. (1995). The influence of new product factors on export propensity and performance: an empirical analysis. Journal of International Marketing, 3(2), 11-28.
Bodlaj, M., Coenders, G., & Zabkar, V. (2012). Responsive and proactive market orientation and innovation success under market and technological turbulence. Journal of Business Economics and Management, 34(4), 666-687. http://dx.doi.org/10.3846/16111699.2011.620143.
Cambra-Fierro, J. J., Hart, S., Mur, A. F., & Redondo, Y. P. (2011). Looking for performance: how innovation and strategy may affect Market orientation models. Innovation: Management, Policy & Practice, 13(2), 154-172.
Cavalcante, L. R., & De Negri, F. (2010). PINTEC 2008: análise preliminar e agenda de pesquisa. Radar: Tecnologia, Produção e Comércio Exterior, 11, 7-15.
Chang, W., Franke, G. R., Butler, T. D., Musgrove, C. F., & Ellinger, A. E. (2014). Differential mediating effects of radical and incremental innovation on market orientation: performance relationship: a meta-analysis. Journal of Marketing Theory and Practice, 22(3), 235-249. http:// dx.doi.org/10.2753/MTP1069-6679220301.
Chen, X., Chen, A. X., & Zhou, K. Z. (2014). Strategic orientation, foreign parent control, and differentiation capability building of international joint ventures in an emerging market. Journal of International Marketing, 22(3), 30-49. http://dx.doi.org/10.1509/jim.13.0013.
Chen, Y., Tang, G., Jin, J., Li, J., & Paillé, P. (2015). Linking market orientation and environmental performance: the influence of environmental strategy, employee’s environmental involvement, and environmental product quality. Journal of Business Ethics, 127(2), 479-500. http://dx.doi.org/10.1007/s10551-014-2059-1.
Confederação Nacional da Indústria – CNI (2015). Competitividade Brasil 2014: comparação com países selecionados. Brasília: CNI.
Corder, S., & Salles-Filho, S. (2005). Aspectos conceituais do financiamento á inovação. Revista Brasileira de Inovação, 5(1), 33-76.
Costa, A. C. (2013). Política de inovação brasileira: análise dos novos instrumentos operados pela FINEP (Tese de doutorado). Universidade Federal do Rio de Janeiro, Rio de Janeiro.
Costa, A. C., Szapiro, M., & Cassiolato, J. E. (2013). Análise da operação do instrumento de subvenção econômica à inovação no Brasil. In Conferência Internacional LALICS 2013. Rio de Janeiro: UFRJ.
Day, G. S. (1994). The capabilities of market-driven organizations. Journal of Marketing, 58(4), 37-52. http://dx.doi.org/10.2307/1251915.
Day, G. S. (1997). Assessing competitive arenas: who are your competitors? In G. S. Day & D. J. Reibstein. Wharton on dynamic competitive strategy (pp. 23-47). New Jersey: Wiley & Sons.
Deshpandé, R., Grinstein, A., & Ofek, E. (2012). Strategic orientations in a competitive context: the role of strategic orientation differentiation. Marketing Letters, 23(3), 629-643. http://dx.doi.org/10.1007/s11002-012-9167-4.
Fagerberg, J., Srholec, M., & Knell, M. (2007). The competitiveness of nations: why some countries prosper while others fall behind. World Development, 35(10), 1595-1620. http://dx.doi.org/10.1016/j.worlddev.2007.01.004.
Federação das Indústrias do Estado de São Paulo – FIESP. (2014). Panorama da indústria de transformação brasileira (5. ed.). São Paulo: FIESP.
Ford, D., & Paladino, A. (2013). Enabling innovation through strategic synergies. Journal of Product Innovation Management, 30(6), 1058-1072. http:// dx.doi.org/10.1111/jpim.12045.
Gatignon, H., & Xuereb, J. (1997). Strategic orientation of the firm and new product performance. JMR, Journal of Marketing Research, 34(1), 77-90. http://dx.doi. org/10.2307/3152066.
Greenley, G. E. (1995). Market orientation and company performance: empirical evidence from UK companies. British Journal of Management, 6(1), 1-13. http://dx.doi. org/10.1111/j.1467-8551.1995.tb00082.x.
Instituto Brasileiro de Geografia e Estatística – IBGE. (2002). Pesquisa Industrial: Inovação Tecnológica 2000. Rio de Janeiro: IBGE.
Instituto Brasileiro de Geografia e Estatística – IBGE. (2005). Pesquisa Industrial de Inovação Tecnológica 2003. Rio de Janeiro: IBGE.
Instituto Brasileiro de Geografia e Estatística – IBGE. (2007). Pesquisa de Inovação Tecnológica 2005. Rio de Janeiro: IBGE.
Instituto Brasileiro de Geografia e Estatística – IBGE. (2010). Pesquisa de Inovação Tecnológica 2008. Rio de Janeiro: IBGE.
Instituto Brasileiro de Geografia e Estatística – IBGE. (2013). Pesquisa de Inovação 2011. Rio de Janeiro: IBGE.
Kato, E. M., Gobara, C., Rossoni, L., & Cunha, S. K. (2008). Padrões de Cooperação Tecnológica entre Setores na Indústria Brasileira: Uma Análise Quantitativa dos Dados da PINTEC 2001-2003. Revista de Administração e Inovação, 5(3), 126-140.
Keelson, S. A. (2014). The moderating role of organizational capabilities and internal marketing in market orientation and business success. Review of Business and Finance Studies, 5(1), 1-18.
Kohli, A. K., & Jaworski, B. J. (1990). Market orientation: the construct, research propositions, and managerial implications. Journal of Marketing, 54(2), 1-18. http:// dx.doi.org/10.2307/1251866.
Kühl, M. R., & Cunha, J. C. (2013). Obstáculos à implementação de inovações no Brasil: como diferentes empresas percebem sua importância. Brazilian Business Review, 10(2), 1-24. http://dx.doi.org/10.15728/bbr.2013.10.2.1.
Küster, I., & Vila, N. (2011). The market orientation – innovation – success relationship: the role of internationalization strategy. Innovation: Management, Policy & Practice, 13(1), 36-54.
Laforet, S. (2008). Size, strategic, and Market orientation affects on innovation. Journal of Business Research, 61(7), 753-764. http://dx.doi.org/10.1016/j.jbusres.2007.08.002.
Melo, L. M. (2008). Financiamento à inovação no Brasil: análise da aplicação dos recursos do FNDCT e da FINEP de 1967 a 2006. Revista Brasileira de Inovação, 8(1), 87-120.
Melo, L. M. (2010). O financiamento das empresas inovadoras: alternativas para discussão. Economia & Tecnologia, 20, 139-148.
Narver, J. C., & Slater, S. F. (1990). The effect of a market orientation on business profitability. Journal of Marketing, 54(4), 20-35. http://dx.doi.org/10.2307/1251757.
Ngo, L. V., & O’Cass, A. (2012). In search of innovation and customer-related performance superiority: the role o market orientation, marketing capability, and innovation capability interactions. Journal of Product Innovation Management, 29(5), 861-877. http://dx.doi. org/10.1111/j.1540-5885.2012.00939.x.
Ozkaya, H. E., Droge, C., Hult, G. T. M., Calantone, R., & Ozkaya, E. (2015). Market orientation, knowledge competence, and innovation. International Journal of Research in Marketing, 32(3), 309-318. http://dx.doi. org/10.1016/j.ijresmar.2014.10.004.
Paladino, A. (2007). Investigating the drivers of innovation and new product success: a comparison of strategic orientations. Journal of Product Innovation Management, 24(6), 534-553. http://dx.doi.org/10.1111/j.1540-5885.2007.00270.x.
Pereira, A. J. (2010). Inovação, aprendizado e desenvolvimento econômico: uma abordagem evolucionária sobre os impactos do comportamento inovativo das grandes empresas estrangeiras na indústria de transformação brasileira (1998-2005) (Tese de doutorado). Universidade Federal do Rio Grande do Sul, Porto Alegre.
Rapini, M. S. (2010). Financiamento aos investimentos em inovação no Brasil (Tese de doutorado). Instituto de Economia, Rio de Janeiro.
de casos (Tese de doutorado). Escola de Engenharia de São Carlos, Universidade de São Paulo, São Carlos.
Tironi, L. F. (2005). Política de inovação tecnológica: escolhas e propostas baseadas na Pintec. São Paulo em Perspectiva, 19(1), 46-53. http://dx.doi.org/10.1590/ S0102-88392005000100004.
Tironi, L. F., & Cruz, B. D. O. (2008). Inovação incremental ou radical: há motivos para diferenciar? Uma abordagem com dados da PINTEC. Rio de Janeiro: IPEA. Recuperado em 30 de agosto de 2015, de http://site.protec.org.br/ uploads/paginas/file/publicacoes/9%20Ipea.pdf
Varum, A., & Pinho, C. (2007). Searching for sectoral patterns of innovation in european manufacturing industry. In European Association for Evolutionary Political Economy (EAEPE) 2007 Conference. Aveiro: Universidade de Aveiro.
Vázquez, R., Santos, M. L., & Álvarez, L. I. (2001). Market orientation, innovation and competitive strategies in industrial firms. Journal of Strategic Marketing, 9(1), 69-90. http://dx.doi.org/10.1080/09652540123013.
Wang, C. (2015). The impact of market orientation on innovation performance: does service innovation matter? Journal of Business Studies Quarterly, 6(3), 1-18.
Zhou, K. Z., Yim, C. K., & Tse, D. K. (2005). The effects of strategic orientations on technology and market based breakthrough innovations. Journal of Marketing, 69(2), 42-60. http://dx.doi.org/10.1509/jmkg.69.2.42.60756. Perspectivas em Ciência da Informação, 14(1), 192-208.
http://dx.doi.org/10.1590/S1413-99362009000100013.
Sanal, M., Alpkan, L., Aren, S., Sezen, B., & Ayden, Y. (2013). Linking market orientation and ambidexterity to financial returns with the mediation of innovative performance. Journal of Economic and Social Research, 5(1), 31-54.
Scott-Kennel, J., & Giroud, A. (2015). MNEs and FSAs: network knowledge, strategic orientation and performance. Journal of World Business, 50(1), 94-107. http://dx.doi. org/10.1016/j.jwb.2014.02.004.
Slater, S. F., & Narver, J. C. (1998). Customer-led and market-oriented: let’s not confuse the two. Strategic Management Journal, 19(10), 1001-1006. http://dx.doi. org/10.1002/(SICI)1097-0266(199810)19:10<1001::AID-SMJ996>3.0.CO;2-4.
Slater, S. F., & Narver, J. C. (1999). Market-oriented is more than being customer-led. Strategic Management Journal, 20(12), 1165-1168. http://dx.doi.org/10.1002/(SICI)1097-0266(199912)20:12<1165::AID-SMJ73>3.0.CO;2-#.
Song, M., & Parry, M. E. (2009). The desired level of market orientation and business unit performance. Journal of the Academy of Marketing Science, 37(2), 144-160. http://dx.doi.org/10.1007/s11747-008-0114-0.