HARMONY SEARCH OPTIMIZATION
FOR UPFC PLACEMENT
A. SAKTHIDASAN Teaching Fellow
Department of Electrical and Electronics Engineering UCEA (A Constituent College of Anna University, Chennai)
Arni, Tamil Nadu, INDIA Email: [email protected]
S. GEETHANJALI
Department of Electrical and Electronics Engineering SRM University
Tamil Nadu, INDIA Email: [email protected]
Abstract :
This article presents a harmony search optimization based method for optimal placement of UPFCs with a view of reducing the network loss. Harmony search optimization is inspired the musical process of searching for a perfect state of harmony. The harmony in music is analogous to the optimization solution vector, and the musician’s improvisations are analogous to local and global search schemes in optimization techniques. The method determines the optimal locations and the parameters of the UPFCs for placement. Test results on IEEE 30 bus system exhibits the superiority of the developed algorithm.
Keywords: harmony search algorithm; FACTS devices; UPFC.
Nomenclature
BW bandwidth
FACTS flexible AC transmission systems
GA genetic algorithm
k
g conductance of the transmission line-k
HM harmony memory
HMCR harmony memory considering rate HMS harmony memory size
HSO harmony search optimization MI maximum number of iterations
k
L number of a line, where kth UPFC is to be located
nf number of UPFCs
nload number of load buses
PAR pitch adjusting rate
PSO particle swarm optimization
PM proposed method
L
P system real power loss
ij
P and Qij active and reactive power flow from bus-i to j respectively )
, (V
P set of real power expressions at PV and PQ buses
sp
P set of specified real powers at PV and PQ buses )
, (V
Q set of reactive power expressions at PQ buses
Gi
Q reactive power generation at bus-i
sp
min Gi
Q and QGimaxlower and upper limit reactive power generation at bus-i respectively Fi
Q reactive power supplied by UPFC at bus-i.
SA simulated annealing
SVC static VAR compensator
STATCOM static synchronous compensator
SSSC static synchronous series compensator
TCPAR thyristor controlled phase angle regulator
TCSC thyristor controlled series compensator
UPFC unified power flow controller
i
V and Vj voltage magnitude at buses-i andj respectively min
i
V and Vimax lower and upper limits voltage magnitude at bus-i respectively 1
w and w2 weight constants
ij
x reactance of the transmission line between buses-i and j
constant
ij
voltage angle between buses-i andj
' ij
x net reactance of the transmission line between buses-i andj along with UPFC
F
x reactance of the UPFC
k
line compensation factor in the range of (-0.8, 0.2) for kth UPFC
i Q
change in reactive power injection at bus-i by a UPFC
1. Introduction
Modern power systems are over expanded and getting complex due to ever-increasing power demand as a result of economic growth and industrial automation. They become very difficult to operate and insecure with unscheduled power flows, higher RPL, which is about 5-13% of the total generated power. The recent developments in power electronics have introduced Flexible AC Transmission Systems (FACTS) that include Thyristor Controlled Series Compensator (TCSC), Static VAR Compensator (SVC), Static Synchronous Compensator (STATCOM), Unified Power Flow Controller (UPFC), Static Synchronous Series Compensator (SSSC), Thyristor Controlled Phase Angle Regulator (TCPAR) etc., These devices can facilitate the control of power flow, increase the power transfer capability, decrease the generation cost, improve the security and enhance the stability of the power systems. They allow the operation of the power systems more flexible, secure and economical through controlling various electrical parameters of transmission circuits. However, the decision on the size, the locations and their parameters is of great significance in obtaining the benefits of the FACTS devices [1].
The placement of FACTS devices can be described as an optimization problem with an objective of minimizing a cost function while satisfying system constraints. The objective may be power loss minimization, reduction of net voltage magnitude deviation and voltage stability enhancement. The constraints may include power flow and security limits under normal and contingent conditions. Due to rigorous constraints, the FACTS placement problem is a most challenging nonlinear optimization problem in power systems.
avoid voltage instability has been developed in [10]. An optimal allocation strategy for FACTS devices for relieving congestion and enhancing voltage stability has been presented in [11].
Recently, a Harmony Search Optimization (HSO) that was conceptualized using musical process of searching for a perfect state of harmony has been suggested for solving optimization problems [12,13]. The HSA does not require initial values for the decision variables and uses a stochastic random search that is based on the harmony memory considering rate (HMCR) and pitch adjusting rate (PAR) so that the derivative information is unnecessary. It requires fewer mathematical computations compared to other meta-heuristic algorithms and can be easily adopted for various types of engineering optimization problems. It has been applied in solving EED problem in [14].
An improved HSO based method for optimal placement of UPFCs with a view of reducing the network loss is proposed in this article. The simulation results of the proposed method (PM) on IEEE 30 bus test system are presented. The article is divided into six sections. Section 1 presents the introduction, section 2 narrates the improved HSO, section 3 describes the PM, section 4 explains the results and section 6 provides the concluding remarks.
2. Improved Harmony Search Optimization
The HSA is based on the musical process of searching for the perfect state of harmony. Musicians, during a rehearsal or a performance, try to create pleasing sounds and approach the ideal state of harmony. HSA is inspired from the improvisation process of music players. Just as the musicians try to improve their music, the HSA seeks for certain values for the decision variables that optimize the objective function while at the same time satisfying the problem constraints. It improves the optimal solution iteration after iteration in the same way as a music band improves rehearsal after rehearsal. It is simple in concept, few in parameters and easy for implementation with theoretical background of stochastic derivative.
In this approach, a Harmony Memory (HM), comprising a number of candidate solutions of the problem at hand, is defined. The HM is initialized with random guesses in the problem space as:
HMS N HMS HMS N N N x x x x x x x x x x x x HM 2 1 3 3 2 3 1 2 2 2 2 1 1 1 2 1 1 (1)
Generating a new harmony is known as “improvisation”. A new harmony vector x'(x1',x2',,xN' ) is generated based on the following mechanisms
Memory considerations: The value for the first decision variable x1' for the new vector is chosen from any of
the values in the specified HM range ( 1 )
' 1
HMS x
x . Values for other decision variables ( , 3', , ' )
'
2 x xN
x are
chosen in the same manner. The HMCR that varies between 0 and 1 is the rate of choosing a value from HM, while (1-HMCR) is the rate of randomly selecting a value from the possible range of values as shown in (2)
if (rand ( ) < HMCR)
) , , , ( ' ' HMS i 2 i 1 i i
i x x x x
x
else
i i
i x X
x' ' end
(2)
where rand ( ) is a uniform random number between 0 and 1 and Xi is the set possible range of values for each decision variable, that is xi(min) Xi xi(max)
if (rand ( ) < PAR) BW rand x
xi' i' ()
else ' '
i i x
x
end
(3)
Where BW is an arbitrary distance bandwidth.
Update harmony memory: If the new harmony vector x'(x1',x2',,xN' ) is better than the worst harmony in the HM, then the worst harmony is replaced by the new harmony.
Convergence Check: The process of generating new harmony vector can be terminated when the number of iterations reaches the maximum number of iterations.
3. Improved Harmony Search Optimization
Appropriate UPFCs should be installed at the best possible locations with optimal parameter settings in order to reduce the network loss. The objective function is developed as the sum of line losses of all transmission line and the constraints comprise the load flow equations and the limits on the UPFC parameters.
Minimize
k
ij j i j
i
ij V V V V
g 2 2 2 cos (4)
Subject to
UPFC device constraints
2 . 0 8
. 0
k (5) MVAR
Q
MVAR Fi 100
100
(6)
Power Flow Constraints
0 )
,
(V Psp
P for PV and PQ buses (7) 0
) ,
(V Qsp
Q for PQ buses (8) The UPFC placement problem, represented through Eqs. 4-8 offers a solution that reduces the network loss by placing UPFCs at appropriate transmission lines. This is achieved by altering the network parameters and injecting or absorbing reactive power at appropriate lines.
3.1.Representation of HSO variables
Each harmony in the PM is defined to represent the locations and parameters of the UPFCs. The locations are to be denoted by integer numbers, while the parameters by real numbers. The HSO generates real numbers and hence are rounded off to the nearest integer values for obtaining values for locations.
3.2.Repair Algorithm
It is undesirable to place two or more UPFCs at a line. During the iterative process, there is a possibility that a harmony contains same line numbers. If this happens, it may be corrected by the following repair algorithm.
Change any one line number by generating a random number to represent another line.
Repeat the above step till no two numbers representing the same location.
3.3.Solution Process
The process of generating a new harmony from the HM, which is generated randomly through memory considerations, pitch adjustment and memory update, may be called an iteration. The iterations are continued till the number of iterations reaches the MI. The iterative process is continued till convergence. The algorithmic steps of the PM is summarized below:
1. Read power system data
3. Randomly generate initial HMconsisting as many randomly generated solution vectors as the HMS
4. Perform the following for each harmony in the HM
Place UPFCs and set the parameters
Run Load flow
Evaluate the objective function value
5. Rank the HM based on the augmented objective function values
6. Set iteration counter t0
7. Increment the iteration counter tt1
8. Evaluate PAR(t) and BW(t)
9. Improvise a new harmony vector 'x based on the probability HMCR
10. Adjust the pitch of each element of the new harmony based on the probability PAR(t)
11. Perform the following for new harmony
Place UPFCs and set the parameters
Run Load flow
Evaluate the objective function value
12. Update theHMby the new harmony, if the new harmony is better than the worst harmony of the HM
13. Repeat steps 7-12 till the number of iterations,t, reaches the maximum number of iterations,MI
14. The best harmony in the HMis the optimal solution.
15. Stop.
4. Improved Harmony Search Optimization
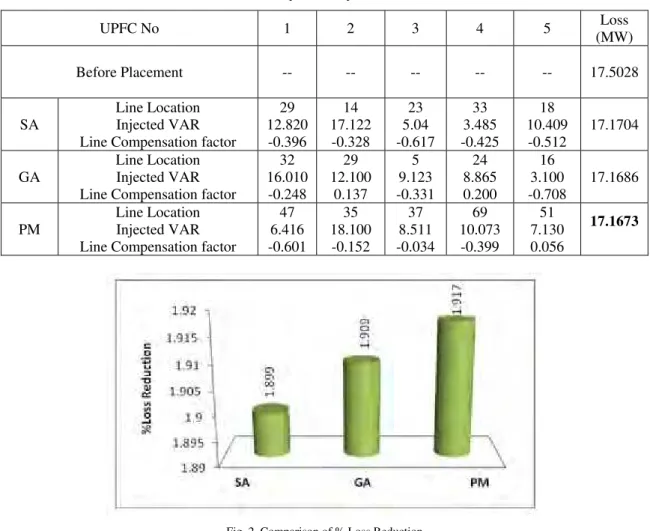
The proposed HSO based strategy is tested on IEEE 30 bus test system. NR technique [16] is used to carry out the load flow during the optimization process. The PM is initially run with different number of UPFCs with a view of choose the optimal number of UPFCs and the resulting Loss is presented in Table 1. It can be observed from this table that the Loss can be considerably reduced from 17.5028 to 17.1673, when five UPFCs. If the number of UPFCs is further increased or decreased by one device, the Loss increases. The number of UPFCs in this study is thus chosen as five. The results of the PM are obtained and compared with those of SA and GA based approaches with same number of UPFCs in order to demonstrate the effectiveness of the PM.
Table 1. Variation of Loss with number of UPFCs
No of UPFCs Loss (MW)
0 3 4 5 6
17.5028 17.2311 17.1960 17.1673 17.1678
Table 2 Comparison of optimal Solutions
UPFC No 1 2 3 4 5 Loss
(MW)
Before Placement -- -- -- -- -- 17.5028
SA
Line Location Injected VAR Line Compensation factor
29 12.820 -0.396
14 17.122 -0.328
23 5.04 -0.617
33 3.485 -0.425
18 10.409 -0.512
17.1704
GA
Line Location Injected VAR Line Compensation factor
32 16.010 -0.248
29 12.100
0.137
5 9.123 -0.331
24 8.865 0.200
16 3.100 -0.708
17.1686
PM
Line Location Injected VAR Line Compensation factor
47 6.416 -0.601
35 18.100 -0.152
37 8.511 -0.034
69 10.073 -0.399
51 7.130 0.056
17.1673
Fig. 2 Comparison of % Loss Reduction
Table 3 Comparison of Execution Time
Time (secs)
SA 23.8 GA 17.6 PM 4.5
5. Conclusion
A new methodology involving improved HSO for solving UPFC placement problem has been developed and studied on an IEEE test system. It determines the optimal values for locations and the parameters. The ability of the PM to produce the global best solution that reduces the loss of the system has been projected. It has been chartered that the new approach fosters the continued use of HSO and will go a long way in serving as a useful tool in load dispatch centre
Acknowledgments
The authors gratefully acknowledge the authorities of Anna University Chennai, University College of Engineering Arni and SRM University, Chennai Tamil Nadu for their continued support, encouragement and the facilities provided to carry out this work.
References
[1] Narain G. Hingorani and Laszio Gyugyi, Understanding FACTS: Concepts and Technology of Flexible AC Transmission Systems, IEEE Press, pp. 1-29, 2000.
[2] Yoshida H., Kawata K., Fukuyama Y. et al., A particle swarm optimization for reactive power and voltage control considering voltage security assessment. IEEE Trans. on Power Systems 15(4) (2000).
[3] Song S.-H., Lim J.-UK, Moon S.-II, FACTS Operation Scheme for Enhancement of power system Security. Bolonga Power Tech Conference, Bolonga, Italy, pp. 23-26 (2003).
[4] Venkataramu P.S., Ananthapadmanabha T., Installation of Unified power flow controller for voltage stability margin enhancement under line outage contingencies. Iranian Journal of Electrical and Computer Engineering 5(2) (2006).
[6] Lin Jineng, Wang Xudong, Zheng Weihong, Reactive power optimization based on adaptive immune algorithm. Proceedings of the International Multi Conference of Engineers and computer scientists, IMECS, Hong Kong, pp. 19-21 (2008).
[7] Liu Hongchao, Peng Jianchun, Rasearch of a new reactive power optimization method consider of the voltage optimization of the whole electric network. IEEE Conference (2009).
[8] Bindeshwar S.R. et.al, Prevention of voltage instability by using FACTS controllers in power systems: A Literature survey. International Journal of Engineering Science and Technology 2(5): 980-992 (2010).
[9] Zhu J., Cheung K., Hwang D., Sadjadpour A., Operation strategy for improving voltage profile and reducing system loss. IEEE Trans.on Power Delivery 25(1) (2010).
[10] Subramanian A., Ravi G., Voltage collapse enhancement and loss reduction by reactive power reserve. International Journal of Computer Applications 12(12) (2011).
[11] Wibowo R.S., Yorino N., Ehbal M., Zoka Y., Sasaki Y., FACTS devices allocation with control coordination considering congestion relief and voltage stability. IEEE Trans. on Power Systems 26(4) (2011).
[12] Geem. Z.W, Kim. J.-.H, Loganathan. G.V. (2001). A new heuristic optimization algorithm: harmony search, Simulation, 76(2): 60-68. [13] Lee. K.S and Geem.Z.W. (2005). A new meta-heuristic algorithm for continuous engineering optimization: harmony search theory and
practice, Comput. Methods Appl. Mech. Engrg. 194(3): 3902-3933.
[14] Sivasubramani. S and Swarup. KS. (2011). Environmental/economic dispatch using multi-objective harmony search algorithm, Electric Power Systems Research, 81(9), 1778-1785.
[15] Kessel, P. and Glavitsch, H. “Estimating the voltage stability of a power system”, IEEE Trans. on Power Deliver, Vol. 1, No. 3, pp. 346-54, 1986.