the current manuscript we described that linoleic acid (LA) caused mitochondrial Ca efflux and peroxynitrite production, along with increased nitrotyrosine levels of cellular proteins in primary human mesangial cells. The peroxynitrite production by LA was found to depend on mitochondrial Ca2+efflux. Downregulation of hsp90b1, which has been previously shown to
be essential for polyunsaturated fatty acid-induced mitochondrial Ca2+ efflux, significantly diminished LA-responsive
mitochondrial Ca2+ efflux and the coupled peroxynitrite generation, implicating a critical role of hsp90b1 in the LA
responses. Our results further demonstrated that mitochondrial complexes I and III were directly involved in the LA-induced peroxynitrite generation. Using the well established type 2 diabetic animal model db/db mice, we observed a dramatically enhanced LA responsive mitochondrial Ca2+efflux and protein nitrotyrosylation in the kidney. Our study thus demonstrates
a cause-effect relationship between LA and peroxynitrite or protein nitrotyrosylation and provides a novel mechanism for lipid-induced nephropathy in diabetes.
Citation:Zhang H-M, Dang H, Yeh C-K, Zhang B-X (2009) Linoleic Acid-Induced Mitochondrial Ca2+
Efflux Causes Peroxynitrite Generation and Protein Nitrotyrosylation. PLoS ONE 4(6): e6048. doi:10.1371/journal.pone.0006048
Editor:Carmine Zoccali, L’ Istituto di Biomedicina ed Immunologia Molecolare, Consiglio Nazionale delle Ricerche, Italy
ReceivedMarch 20, 2009;AcceptedMay 27, 2009;PublishedJune 26, 2009
This is an open-access article distributed under the terms of the Creative Commons Public Domain declaration which stipulates that, once placed in the public domain, this work may be freely reproduced, distributed, transmitted, modified, built upon, or otherwise used by anyone for any lawful purpose.
Funding:This work was partially supported by grants from the American Heart Association (0235065N to BXZ), the National Institute of Health (HL075011 to BXZ) and the Department of Veterans Affairs (to BXZ and CKY). The funders had no role in study design, data collection and analysis, decision to publish, or preparation of the manuscript.
Competing Interests:The authors have declared that no competing interests exist. * E-mail: [email protected]
Introduction
Elevated non-esterified fatty acids (NEFA) have been reported in patients and animal models of type 2 diabetes and shown to be associated with increased reactive oxygen species (ROS) produc-tion from mitochondria [1,2] and nonmitochondrial sources [3]. Theoretically, excessive NEFA may influence mitochondrial ROS production by affecting the regeneration of reduced glutathione, proton gradients and electron transport [1]. Ionic Ca2+
in the mitochondria ([Ca2+
]m) regulates not only substrate oxidation and
ATP production [4,5], but also ROS generation [6], which has been demonstrated to be a major contributing factor to the pathogenesis of diabetic complications including diabetic nephrop-athy [7]. Under normal physiological conditions, Ca2+
diminishes ROS production from both complexes I and III [6]. Whether excessive NEFA contribute to the massive ROS generation in diabetic nephropathy by alterating [Ca2+
]mis currently unknown.
Superoxide interacts with nitric oxide (NO) to form peroxyni-trite, a strong oxidant that attacks various biomolecules and causes functional defects in cells and tissues [8]. Peroxynitrite interacts with and modifies multiple proteins and enzymes at tyrosine residues to form nitrotyrosine. Protein nitrotyrosylation may either up- or down-regulate activities of cellular pathways in a target-dependent manner [8–10]. Increased formation of nitrotyrosine
has been demonstrated in diabetic kidneys [11] and may be associated with the pathogenesis of nephropathy.
In advanced diabetic nephropathy, mesangial cells are major contributors to glomerular mesangial matrix expansion and capillary basement membrane thickening with increased expression of the extracellular matrix components collagen IV, fibronectin, and laminin [12]. Human mesangial (HM) cells grown in high glucose show largely increased mitochondrial membrane potential and ROS production [13]. Elevated ROS generation may activate NF-kB and contribute to increased extracellular matrix accumulation.
NEFA may influence mitochondrial function by altering gene expression [14], metabolism [15], and/or mitochondrial Ca2+
homeostasis [4,16]. We have recently reported that polyunsatu-rated fatty acids (PUFA) induce Ca2+ efflux from mitochondria
[16,17], an action that may disrupt mitochondrial function and influence ROS generation. It has yet to be determined whether PUFA-induced mitochondrial Ca2+
efflux (PIMCE) links to ROS generation. In the current study, we demonstrated that linoleic acid (LA, an 18:2 n-6 PUFA)-responsive mitochondrial Ca2+
Results
LA caused [Ca2+]imobilization, peroxynitrite generation, and protein nitrotyrosylation in HM cells
PIMCE and the indispensable role of hsp90b1 in the process have previously been described in the human teratocarcinoma NT2 cells [17]. To show that PIMCE is a contributing factor to diabetic nephropathy, we determined whether PIMCE occurs in primary cultured HM cells. As demonstrated in Figure 1, LA caused [Ca2+]
i rise in HM cells and the amplitude of the LA
responses was dose dependent (Figure 1A and B) with maximal response observed at 30–60mM. Thus 30mM of LA was used in all subsequent experiments of this study. Furthermore, the [Ca2+
]i
response of LA (30mM) was associated with ROS generation in HM cells (Figure 1C).
Because nitrosative injury as indexed by protein nitrotyrosine was dramatically increased in diabetic nephropathy [11], we wanted to know whether the ROS generated along with LA-induced [Ca2+
]i mobilization in HM cells was peroxynitrite.
Among different types of ROS, 29,79-dichlorodihydrofluorescein diacetate (DCF) preferentially reacts with peroxynitrite [18]. To determine the ROS signal observed in Figure 1C (as indexed by the DCF fluorescent intensity) was peroxynitrite, HM cells were treated with 5,10,15,20-Tetrakis(4-sulfonatophenyl) prophyrinato iron (III) (FeTPPS, 0.5mM), a specific peroxynitrite decomposition catalyst [9,19,20]. Compared to control, pretreatment with FeTPPS did not affect the LA-induced [Ca2+
]i rise, but
significantly attenuated the ROS production (Figure 2A and B; FeTPPS reduced the LA responsive DCF signal to 14.569.2% of control,P,0.001, n = 6), suggesting that the generated ROS were predominantly peroxynitrite. The data also indicated that the LA responsive peroxynitrite generation was either unrelated or occurred downstream of the [Ca2+]
irise.
Since peroxynitrite is formed by the interaction of superoxide and NO, we next measured the generation of the latter two substances along with [Ca2+]
i mobilization by measuring
dihy-droethidium (DHE, a fluorescent indicator of superoxide), and diaminofluorescein-2 diacetate (DAF-2, an indicator of NO) fluorescence, respectively. As shown in Figure 2C and D, LA-induced [Ca2+]
imobilization was associated with the generation of
superoxide and NO. The specificity of DHE, DAF-2, and DCF was further demonstrated by using the exogenous NO donor (S-nitroso-N-acetylpenicillamine, 50mM). The NO donor had no
effect on DHE fluorescence (Figure 2E) but rapidly increased the fluorescent intensity of DAF-2 (Figure 2F). The NO donor also gradually increased DCF fluorescence, indicating the formation of peroxynitrite (Figure 2G).
Peroxynitrite is a strongly reactive oxidant that may interact with multiple proteins and cause nitrosative modification of tyrosine residues to form nitrotyrosine. We next measured the level of nitrotyrosine in cellular proteins of HM cells following LA treatment (30mM, 1 h at 37uC). As shown in Figure 2H and I, LA treatment caused significantly increased nitrotyrosine levels in a spectrum of proteins in HM cells. The MW of these proteins ranged from 18 to 54 kDa (Figure 2H). These results further supported that the LA-induced [Ca2+]
i
mobilization was associated with peroxynitrite generation and the latter leading to cellular protein nitrotyrosylation in HM cells.
LA-induced mitochondrial Ca2+efflux caused peroxynitrite production
Bradykinin (BK) and thapsigargin (TG) are known to induce [Ca2+
]imobilization by activation of Ca2+release from the ER and
store-operated Ca2+influx through inositol-1, 4, 5-trisphosphate
dependent and independent mechanisms, respectively. However, as shown in Figure 3A and B, the [Ca2+
]imobilization induced by both
BK and TG was not associated with any detectable peroxynitrite production. These results indicated that the rise of [Ca2+]
ifrom the
endoplasmic reticulum (ER) Ca2+
release and store-operated Ca2+
influx did not lead to peroxynitrite generation. Even though LA-induced [Ca2+
]imobilization was observed in
the absence of extracellular Ca2+, chelation of extracellular Ca2+
significantly diminished LA-induced [Ca2+
]isignal (Figure 3C and
D), demonstrating that both Ca2+
release from the internal Ca2+
stores and Ca2+
influx were involved in LA responsive [Ca2+
]i
mobilization. The peroxynitrite responses to LA were unaffected by extracellular Ca2+
(Figure 3C–E). Moreover, clamping the [Ca2+
]iwith
1,2-Bis(2-aminophenoxy)ethane-N,N,N’,N’-tetraace-tic acid (BAPTA, a membrane permeable chelator of cytosolic Ca2+
) in the absence of extracellular Ca2+
, abolished LA-induced [Ca2+
]i signal but had no significant effect on peroxynitrite
generation (Figure 3F–H; P.0.05, n = 6), indicating that LA responsive peroxynitrite generation occurred independently of [Ca2+
]irise. Because BAPTA does not prevent Ca2+release from
the internal Ca2+ stores, including ER and mitochondria, these
experiments did not exclude the role of Ca2+
release from the internal Ca2+
stores in peroxynitrite generation. Figure 1. LA-induced [Ca2+]
imobilization and ROS generation. Human mesangial cells were labeled with fura-2 (1mM) alone or together with DCF (1mM) (37uC, 30 min).The fluorescent intensity in the figures was presented as arbitrary unit (AU). (A): Traces represent the [Ca2+]iresponses induced by different concentrations of LA. (B): The curve shows the relationship between the amplitude of [Ca2+]iresponses and the
LA concentrations. (C): Traces represent LA (30mM)-induced [Ca2+
Figure 2. The LA-induced ROS signal was identified as peroxynitrite.(A): HM cells were labeled with fura-2 and DCF and traces represent LA-induced [Ca2+]imobilization (black trace) and ROS generation (red trace); (B): same measurements performed in cells treated with FeTPPS (a specific
peroxynitrite decomposer; 0.5mM, 30 min) prior to LA addition and the treatment inhibited the ROS signal significantly; (C) and (E): HM cells were labeled with fura-2 and dihydroethidium (DHE, 1mM) and traces represent LA (C) or S-nitroso-N-acetylpenilillamine (exogenous NO donor, ExNO, 50mM; E) responsive [Ca2+
]imobilization (black trace) and superoxide generation (red trace); (D) and (F): HM cells were labeled with fura-2 and 4,5-diaminofluorescein diacetate (DAF-2, 0.5 nM) and traces represent LA (D) or ExNO (F) responsive [Ca2+
]imobilization (black trace) and NO generation (red trace); (G) HM cells were labeled with fura-2 and DCF and traces represent ExNO responses in [Ca2+]i(black trace) and peroxynitrite (red trace).
The nitrotyrosine level in the cellular proteins was determined by western blot analysis in vehicle-(control) or LA-treated HM cells usinga-tubulin as the loading control. The image (H) shows a representative experiment. The graphs (I) represent the mean ratio value6SEM of the density of protein band overa-tubulin. *P,0.05, n = 4, LAvscontrol.
Pretreatment of the cells with TG (2mM) in the absence of
extracellular Ca2+ to completely deplete the ER Ca2+ stores (as
indicated by a complete inhibition of the BK-induced [Ca2+]
isignal
following TG treatment, data not shown) only partially reduced the LA-induced [Ca2+]
imobilization and had no significant effect on
peroxynitrite generation (Figure 3I, J, L). These results indicated that additional Ca2+stores other than ER, such as mitochondria,
may be involved in LA-induced [Ca2+]
iresponse.
Interestingly, in the absence of extracellular Ca2+
, pretreat-ment of the cells with carbonyl
cyanide-p-trifluoromethoxyphe-nylhydrazone (FCCP, 4mM), a well-known mitochondrial
uncoupler, completely inhibited LA-induced peroxynitrite production and also attenuated the [Ca2+]
iresponse (Figure 3I,
K, L). FCCP may alleviate LA-induced [Ca2+]
iby collapse of
the mitochondrial proton gradient, which prevents Ca2+uptake
to the mitochondria and thus reduces the subsequent LA-responsive [Ca2+]
mefflux. These data indicated that at least part
of the [Ca2+]
i response to LA resulted from [Ca 2+]
m efflux,
which might be essential to the peroxynitrite generation in HM cells.
Figure 3. Mitochondria played an essential role in LA-induced [Ca2+]
imobilization and peroxynitrite generation.HM cells were labeled with fura-2 and DCF to measure [Ca2+
]imobilization (black traces) and peroxynitrite generation (red traces). (A): Bradykinin (BK, 100 nM) responses; (B): thapsigargin (TG, 2mM) responses; (C) and (F): LA responses measured in the presence of extracellular Ca2+(control); (D): LA responses
measured without extracellular Ca2+
; (G) LA responses measured in cells pretreated with BAPTA (50mM, 30 min) without extracellular Ca2+
. In the absence of extracellular Ca2+
, (I): LA responses (control); (J): LA responses in cells pretreated with TG (2mM, 5 min); (K) LA responses in cells pretreated with FCCP (a mitochondrial uncoupler; 4mM, 5 min). The values in graphs (E, H, and L) represent the mean6SEM of the relative amplitudes of LA-induced [Ca2+
LA had been shown to increase [Ca2+
]i by causing [Ca2+]m
efflux in human teratocarcinoma NT2 cells [17]. We thus evaluated the role of LA-induced [Ca2+]
mefflux in peroxynitrite
generation in isolated mitochondria from HM cells. Isolated mitochondria were labeled with X-rhod-1 and DCF to measure Ca2+
efflux and peroxynitrite generation, respectively. As shown in Figure 4A, LA caused Ca2+ efflux from the mitochondria as
indexed by the reduced X-rhod-1 fluorescence intensity (black trace, Figure 4A). Interestingly, a robust increase in peroxynitrite generation was observed along with the [Ca2+]
mefflux, as indexed
by the enhanced DCF fluorescence intensity (red trace, Figure 4A). Furthermore, chelation of Ca2+
to prevent mitochondria from Ca2+refilling during X-rhod-1 and DCF labeling not only blocked
LA-induced Ca2+
efflux from mitochondria (black trace, Figure 4B) but also significantly inhibited LA-induced peroxynitrite genera-tion (red trace, Figure 4B), indicating that peroxynitrite generagenera-tion was dependent on LA-induced [Ca2+
]mefflux.
Hsp90b1 played a critical role in LA-induced
mitochondrial Ca2+efflux and peroxynitrite generation
Based on the indispensible role of hsp90b1 in PIMCE [17], it is expected that hsp90b1 would be essential for LA-induced peroxynitrite generation if the peroxynitrite response of LA indeed depends on [Ca2+]
m efflux in HM cells. We tested the role of
hsp90b1 in the LA responses by downregulation of hsp90b1 expression with a well-known hsp90 chaperone inhibitor, 17-(dimethylaminoethylamino)-17-demethoxygeldanamycin (17-DMAG), and hsp90b1 RNAi. As shown in Figure 5A, treatment of HM cells with 17-DMAG (90 nM) or the hsp90b1 RNAi for 48 h effectively downregulated hsp90b1 expression. Of particular note, both treatments not only significantly inhibited LA-induced [Ca2+
]mefflux (as indicated by the alleviated [Ca2+]iresponse) but
also attenuated peroxynitrite generation (Figure. 5B). These results indicate that hsp90b1 is critical to LA-responsive [Ca2+]
mefflux
and the coupled peroxynitrite responses.
Mitochondrial complexes I and III were responsible for LA-induced peroxynitrite generation
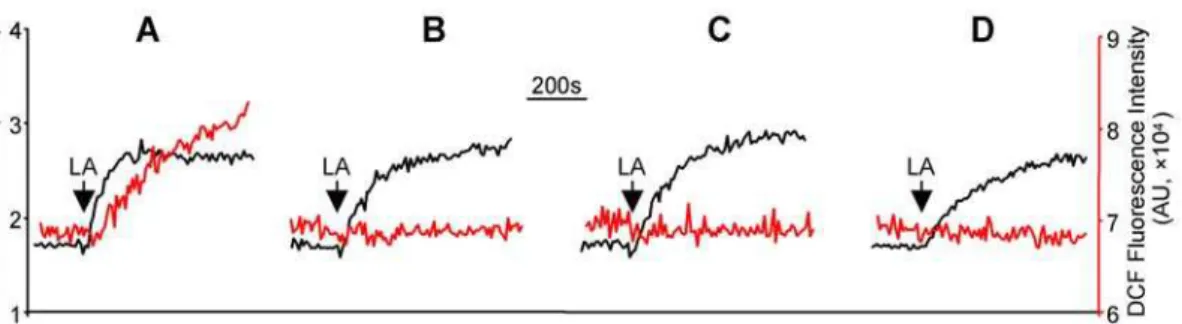
It has been known that in the mitochondria ROS are produced predominantly by complexes I and III [6]. We thus evaluated whether mitochondrial complexes I and III were responsible for the LA-induced peroxynitrite generation in HM cells. Pretreat-ment of HM cells with the complex I inhibitor rotenone (10mM,
20 min) completely diminished peroxynitrite generation (Figure 6A and B;P,0.001, n = 6) without significant effect on LA-induced [Ca2+
]imobilization (P.0.05, n = 6). Blocking complex III with
either antimycin A (1mM, 20 min) or myxothiazol (0.5mM,
60 min) also did not alter the [Ca2+
]iresponses (P.0.05, n = 6) to
LA but inhibited peroxynitrite generation (Figure 6A, C and D;
P,0.001, n = 6). These results indicate that the mitochondrial complexes I and III are responsible for LA-induced peroxynitrite generation.
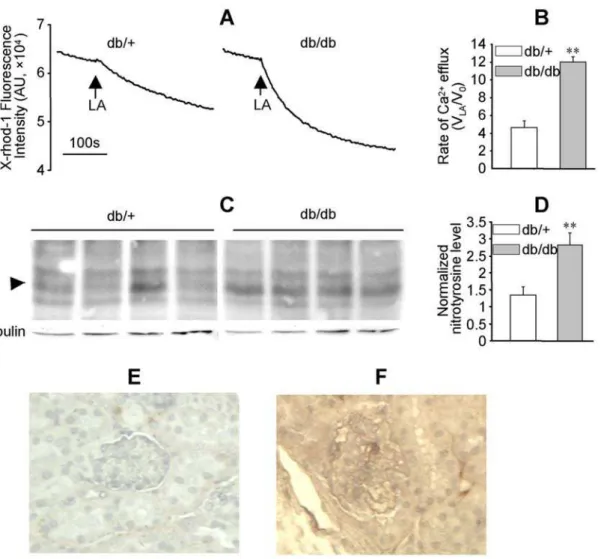
LA-induced mitochondrial Ca2+efflux and protein nitrotyrosylation were enhanced in diabetic mouse kidney
Functional and structural abnormalities were reported in the kidney of db/db mice, a type 2 diabetes model [21]. In mitochondria prepared from the kidneys of 12–16 wk old db/+
(littermate control) and db/db mice, LA caused Ca2+
efflux (Figure 7A and B). Compared to db/+ mice, the rate of LA-induced mitochondrial Ca2+
efflux was significantly enhanced
doi:10.1371/journal.pone.0006048.g004
Figure 5. The effect of hsp90b1 on LA-induced [Ca2+] i
mobilization and peroxynitrite generation.HM cells were treated with vehicle (control), hsp90b1 RNAi, or 17-DMAG for 48 h. (A): Cell lysates were prepared and the alterations of hsp90b1 expression were analyzed by western blot analysis usinga-tubulin as loading control. (B): The alteration of LA-induced [Ca2+
more than two folds in db/db mice (Figure 7B,P,0.01, n = 3). Western blot analysis indicated that nitrotyrosylation in a protein with a MW about 22 kDa was significantly enhanced in db/db mice (Figure 7C and D, P,0.005, n = 4). Analysis of the nitrotyrosine level in kidney sections with immunohistochemistry further confirmed that protein nitrotyrosylation was enhanced in db/db mice kidney (Figure 7E and F).
Discussion
A major role of [Ca2+]
m under physiological conditions is to
stimulate oxidative phosphorylation by activation of multiple dehydrogenases [4] and ATP synthase [22] as well as regulation of other metabolic processes [6]. [Ca2+
]mmay inhibit the generation
of ROS from complexes I and III under normal conditions whereas its overload may promote ROS generation and apoptosis [6]. In our current work, we have demonstrated that LA (an 18:2 n-6 PUFA) induced Ca2+
efflux from mitochondria and caused peroxynitrite production in HM cells. The LA responsive mitochondrial Ca2+
efflux may diminish the inhibitory effect of Ca2+
on ROS production from complexes I or III and thus leads to enhanced peroxynitrite generation (Figures 1–4, 6 and 8). These results revealed a cause and effect relationship between LA-induced [Ca2+]
mefflux and peroxynitrite production.
Our observation uncovered a novel mechanism by which increased NEFA may contribute to the pathogenesis of diabetic nephropathy by increasing peroxynitrite generation. It has been shown that LA is a major NEFA component, and its concentration is significantly elevated in type 2 diabetic patients [23]. Elevated NEFA concentration has also been reported in the db/db mice and other diabetic animal models [24]. In the current work, we observed increased nitrotyrosylation in multiple proteins of LA-treated HM cells (Figure 2), demonstrating that the LA responsive peroxynitrite generation enhanced nitrosative stress. Increased nitrotyrosine levels were also observed in db/db mice along with enhanced LA responsive [Ca2+
]m efflux (Figure 7). Protein
nitrotyrosylation may disrupt the normal functions of mesangial cells and the kidney, leading to abnormalities in the structure and/ or function of diabetic kidney. Indeed, increased nitrotyrosine levels have been reported in the plasma and kidney of diabetic patients [25,26].
Peroxynitrite is a highly reactive oxidant and is formed by the reaction between superoxide and NO. It has been reported that the mitochondrial complexes I and III cause superoxide production [7]. Previous studies described the existence of mitochondrial nitric oxide synthase (NOS), which produced NO in an L-arginine dependent manner [27,28]. We have previously
reported the expression of endothelial NOS (eNOS) and inducible NOS (iNOS), but not neuronal NOS, in rat mesangial cells [29]. The eNOS and iNOS expressed in mesangial cells may be responsible for NO productions induced by G protein coupled receptor agonists and inflammatory stimulators, respectively [29,30]. The expression of iNOS in mesangial cells in response to inflammatory stimulators has been shown to be inhibited by conjugated-LA [30]. All three isoforms of NOS were detected in the kidney homogenates and the expression of NOS proteins was downregulated in aged ZSF1 fatty rats, which was associated with enhanced renal peroxynitrite and other structural and functional abnormalities [31]. The importance of NOS in the pathogenesis of diabetic nephropathy has clearly evidenced by studies from animal models and diabetic patients. However, in HM cells the LA-induced peroxynitrite generation was not inhibited by NG -nitro-L-arginine (0.1–1 mM) or L-NG-monomethyl arginine (0.5 mM) (data not shown), indicating that the LA responsive NO, a required substrate for peroxynitrite generation, was produced in an L-arginine independent manner. Mitochondrial complex III has been shown to possess nitrite reductase activity and is responsible for NO generation in the mitochondria by an L-arginine independent manner [32–34]. Thus the NO involved in LA responsive peroxynitrite generation was more likely to be produced from the nitrite conversion by mitochondrial complex III in HM cells (as depicted in Figure 8). The inhibition of LA responsive peroxynitrite generation by the complex I blocker (rotenone) or complex III blockers (antimycin A or myxothiazol) suggested that complexes I and III may be responsible for the generation of either superoxide or NO, which are the two primary substrates required to form peroxynitrite.
Our previous works had indicated that hsp90b1 played an important role in PIMCE [17]. In the current study, we showed that LA-induced [Ca2+
]mefflux and peroxynitrite generation were
inhibited by 17-DMAG and, more specifically, hsp90b1 RNAi, indicating the hsp90b1 involvement (Figure 5). Based on the observations on the essential role of hsp90b1 in PIMCE, it is likely that hsp90b1 is involved in LA-induced peroxynitrite generation via regulation of [Ca2+
]mefflux.
In addition to diabetes, other pathological conditions have been shown to cause cellular NEFA accumulations. For example, excessive NEFA have been shown to accumulate in the kidney proximal tubules and cardiovascular tissues during ischemia-reperfusion [35,36] and was responsible for sustained mitochon-drial damage. The responses demonstrated in the current work (i.e. activation of [Ca2+
]m efflux and generation of peroxynitrite,
Figure 1–4, and 6) may partially explain the deleterious effects of NEFA under a variety of disease conditions.
Figure 6. Mitochondrial complexes I and III were required for LA-induced peroxynitrite generation.HM cells were labeled with fura-2 and DCF to measure LA responsive [Ca2+]imobilization (black traces) and peroxynitrite generation (red traces). (A): LA responses in untreated cells
(control); (B) LA responses in cells pretreated with rotenone (a mitochondrial complex I inhibitor, 10mM, 20 min); (C) and (D): LA responses in cells pretreated with the mitochondrial complex III blockers, antimycin A (1mM, 20 min; C) or myxothiazol (0.5mM, 60 min; D).
In summary, our work demonstrated that LA-induced [Ca2+]
m
efflux caused peroxynitrite generation and led to increased nitrotyrosine in proteins. The enhanced nitrosative injury in response to LA may disrupt mesangial cell function in the kidney and thus contribute to the pathogenesis of diabetic nephropathy.
Materials and Methods
Cell culture
Primary human mesangial (HM) cells (a gift of Dr. H. E. Abboud, Department of Medicine, University of Texas Health Science Center at San Antonio) were prepared and cultured as previously described [37].
Measurement of [Ca2+]iand superoxide, NO, or peroxynitrite in HM cells
HM cells grown in 100 mm dishes were labeled with fura-2 (1mM) alone to measure [Ca2+]ior together with DHE (1mM),
DAF-2 (0.5 nM), or DCF (1mM) as needed at 37uC for 30 min in
RPMI 1640 medium to measure [Ca2+
]iand superoxide, NO, or
peroxynitrite simultaneously. Loaded cells were harvested and resuspended in PBS1Ca buffer (containing 1 mM KH2PO4, 3 mM
Na2HPO4, 154 mM NaCl, 1 mM CaCl2, 1 mM MgSO4, pH 7.4).
[Ca2+]
imobilization and superoxide, NO or peroxynitrite
gener-ation were monitored in a fluorometer (QM-6, Photon Technology International, NJ) using a cuvette with the temperature stabilized at room temperature. The ratio of fluorescence excited at 340 and 380 nm with emission of 510 nm was recorded and used to index the [Ca2+
]ichange as previously reported [17]. With the multidye
mode of the QM-6 fluorometer, fluorescence excited at 473, 488, or 506 nm and emitted at 595, 515, or 529 nm was measured to index the generation of superoxide, NO, or peroxynitrite in HM cells. The cell density was 1–26106cells/ml in these experiments. The interference of LA to DHE, DAF-2, and DCF fluorescence was calibrated by subtracting the signal resulted from palmitic acid, which does not cause [Ca2+
]imobilization in HM cells.
In experiments in which [Ca2+
]imobilization was measured in
the absence of extracellular Ca2+
, the loaded cells were washed and measured in PBS0Ca buffer (containing 200mM EGTA instead of 1 mM CaCl2as in PBS1Ca).
Figure 7. LA-induced mitochondrial Ca2+ efflux and protein nitrotyrosylation were enhanced in the kidney of db/db mice.
Mitochondria were prepared from fresh kidney tissues of 12–16 wk old db/+and db/db mice and labeled with X-rhod-1 (2mM). (A): LA-induced mitochondrial Ca2+efflux in the kidney of db/+and db/db mice. (B): The ratio of the initial rate of LA-induced mitochondrial Ca2+efflux (VLA;
measured in the first 60 s following LA) to the basal rate (V0; measured prior to LA). The values represent mean6SEM of VLA/V0, **P,0.01, n = 3. (C) and (D): Nitrotyrosine levels in the kidney homogenates of four pairs of db/+and db/db mice were analyzed by western blot usinga-tubulin as loading control. The arrowhead highlights a protein band (,22 kDa) with enhanced nitrotyrosine levels in db/db mice, **P,0.01, n = 4. (E) and (F): Representatives of the nitrotyrosine levels in the kidney sections of db/+and db/db mice as determined by immunohistochemistry.
Measurement of [Ca2+]m and peroxynitrite in mitochondria
Mitochondria were prepared from HM cells or the kidney of 12–16 wk old db/+ or db/db mice as previously described [17] and were suspended in MB1 buffer (containing 250 mM mannitol, 75 mM succinic acid, 0.1 mM EDTA, 0.5 mM EGTA, 10 mM HEPES, pH 7.4). The samples were diluted with nine volumes of HKG buffer (20 mM NaCl, 100 mM KCl, 1 mM CaCl2, 1 mM
MgCl2, 10 mM pyruvate, 20 mM HEPES, pH 7.4) [17], and
labeled with X-rhod-1 (2mM) and DCF (1mM) at 37uC for
30 min. Measurement with loaded mitochondria were performed in PBS0Ca buffer. Alteration of [Ca2+
]m and peroxynitrite
generation were measured with fluorescence excited at 578 or 506 nm and emitted at 602 or 529 nm in a PTI QM-6 fluorometer, respectively. In these experiments, mitochondrial preparations equal to 40mg/ml proteins were used.
In experiments in which LA-induced [Ca2+
]m efflux and
peroxynitrite generation were determined in the absence of Ca2+
refilling, the mitochondrial preparations were suspended in MB1 buffer and diluted with nine volumes of HKG-EGTA buffer (containing 200mM EGTA instead of 1 mM CaCl2as in HKG), then labeled with
X-rhod-1 and DCF and measured as described above.
Downregulation of hsp90b1
HM cells in 100 mm dishes were grown for 24 h in RPMI 1640 supplemented with 14% FBS prior to treatment with hsp90b1 RNAi or 17-DMAG. The three hsp90b1 RNAi sequences used were: 1). UUAGCAAGACGUGUUCGAUUCGAGU; 2). UUCUGCUGGACCCAGCCAUG AAGUA; 3).UCAAACU-GAGGCGAAGCAUUCUUUC (Invitrogen). Cells were treated with vehicle (Lipofectamine RNAi Max alone), a mixture of hsp90b1 RNAi (20mM) and Lipofectamine-RNAi-Max, or
17-Figure 8. Mechanism of excessive NEFA contributing to pathogenesis of diabetic nephropathy.NEFA, such as linoleic acid (LA, an 18:2 n-6 polyunsaturated fatty acid) induces Ca2+efflux from mitochondria by activating a hsp90b1-dependent pathway (PIMCE). The LA responsive
mitochondrial Ca2+
efflux diminishes the inhibitory effect of Ca2+
on superoxide production from complexes I or III and enhances nitrite conversion to NO by complex III, resulting in increased peroxynitrite formation and protein nitrotyrosylation. Protein nitrotyrosylation may disrupt the normal functions of mesangial cells and the kidney, leading to abnormalities in the structure and/or function of diabetic kidney.
kept on ice for 60 min. The mixture was centrifuged at 12,0006g for 15 min at 4uC. Western blot analysis of the proteins in the supernatant was performed with mouse mAb to nitrotyrosine (1:1000, Upstate, Lake Placid, NY) and a-tubulin was used to control protein loading.
The kidneys of 12–16 wk old db/+ and db/db mice were collected, and cleaned slices (10–25 mg) of kidney tissues were homogenized in 1 ml RIPA buffer with a glass-glass homogenizer manually for 30 strokes. The homogenates were centrifuged at 1506g for 15 min at 4uC and the supernatants were collected. The nitrotyrosine levels were determined by western blot analysis.
Immunohistochemistry analysis of nitrotyrosine in kidney sections
The kidneys of 12–16 wk old db/+and db/db mice were fixed in formalin, embedded in paraffin and sectioned (4mm). Paraffin
Results are mean6SEM. Experimental data were analyzed using a two-tailed Student’s t test for comparisons between two groups. A significant difference was defined atP,0.05.
Acknowledgments
We thank Dr. Michael S. Katz for critical review of the manuscript. The permanent address for Dr. Hong-Mei Zhang: Department of Clinical Oncology, Xijing Hospital, the Fourth Military Medical University, Xi’an, China.
Author Contributions
Conceived and designed the experiments: BXZ. Performed the experi-ments: HMZ HD BXZ. Analyzed the data: HMZ HD CKY BXZ. Wrote the paper: HMZ HD CKY BXZ.
References
1. Scho¨nfeld P, Wojtczak L (2008) Fatty acids as modulators of the cellular production of reactive oxygen species. Free Radic Biol Med 45: 231–241. 2. Chinen I, Shimabukuro M, Yamakawa K, Higa N, Matsuzaki T, Noguchi K,
Ueda S, Sakanashi M, Takasu N (2007) Vascular lipotoxicity: endothelial dysfunction via fatty-acid-induced reactive oxygen species overproduction in obese Zucker diabetic fatty rats. Endocrinology 148: 160–165.
3. Lasse`gue B, Clempus RE (2003) Vascular NAD(P)H oxidases: specific features, expression, and regulation. Am J Physiol Regul Integr Comp Physiol 285: R277–R297.
4. Hansford R, Zorov D (1998) Role of mitochondrial calcium transport in the control of substrate oxidation. Mol Cell Biochem 184: 359–369.
5. Jouaville LS, Pinton P, Bastianutto C, Rutter GA, Rizzuto R (1999) Regulation of mitochondrial ATP synthesis by calcium: evidence for a long-term metabolic priming. Proc Natl Acad Sci USA 96: 13807–13812.
6. Brookes PS, Yoon Y, Robotham JL, Anders MW, Sheu SS (2004) Calcium, ATP, and ROS: a mitochondrial love-hate triangle. Am J Physiol Cell Physiol 287: C817–C833.
7. Brownlee M (2005) The pathobiology of diabetic complications: a unifying mechanism. Diabetes 54: 1615–1625.
8. Pacher P, Obrosova IG, Mabley JG, Szabo´ C (2005) Role of nitrosative stress and peroxynitrite in the pathogenesis of diabetic complications. Emerging new therapeutical strategies. Curr Med Chem 12: 267–275.
9. Ali TK, Matragoon S, Pillai BA, Liou GI, El-Remessy AB (2008) Peroxynitrite mediates retinal neurodegeneration by inhibiting nerve growth factor survival signaling in experimental and human diabetes. Diabetes 57: 889–898. 10. Kanski J, Hong SJ, Schoneich C (2005) Proteomic analysis of protein nitration in
aging skeletal muscle and identification of nitrotyrosine-containing sequences in vivo by nanoelectrospray ionization tandem mass spectrometry. J Biol Chem 280: 24261–24266.
11. Drel VR, Pacher P, Stevens MJ, Obrosova IG (2006) Aldose reductase inhibition counteracts nitrosative stress and poly(ADP-ribose) polymerase activation in diabetic rat kidney and high-glucose-exposed human mesangial cells. Free Radic Biol Med 40: 1454–1465.
12. Kanwar YS, Wada J, Sun L, Xie P, Wallner EI, Chen S, Chugh S, Danesh FR (2008) Diabetic nephropathy: mechanisms of renal disease progression. Exp Biol Med (Maywood) 233: 4–11.
13. Manabe E, Handa O, Naito Y, Mizushima K, Akagiri S, Adachi S, Takagi T, Kokura S, Maoka T, Yoshikawa T (2008) Astaxanthin protects mesangial cells from hyperglycemia-induced oxidative signaling. J Cell Biochem 103: 1925–1937.
14. Biden TJ, Robinson D, Cordery D, Hughes WE, Busch AK (2004) Chronic effects of fatty acids on pancreatic beta-cell function: new insights from functional genomics. Diabetes 53: S159–S165.
15. Befroy DE, Petersen KF, Dufour S, Mason GF, de Graaf RA, Rothman DL, Shulman GI (2007) Impaired mitochondrial substrate oxidation in muscle of insulin-resistant offspring of type 2 diabetic patients. Diabetes 56: 1376–1381. 16. Zhang BX, Ma X, Zhang W, Yeh CK, Lin A, Luo J, Sprague EA,
Swerdlow RH, Katz MS (2006) Polyunsaturated fatty acids mobilize intracellular Ca2+in NT2 human teratocarcinoma cells by causing release of Ca2+from mitochondria. Am J Physiol Cell Physiol 290: C1321–C1333. 17. Zhang H, Li ZH, Zhang MQ, Katz MS, Zhang BX (2008) Heat shock protein
90beta1 is essential for polyunsaturated fatty acid-induced mitochondrial Ca2+
efflux. J Biol Chem 283: 7580–7589.
18. Possel H, Noack H, Augustin W, Keilhoff G, Wolf G (1997) 2, 7-Dihydrodichlorofluorescein diacetate as a fluorescent marker for peroxynitrite formation. FEBS Lett 416: 175–178.
19. Duplain H, Sartori C, Dessen P, Jayet PY, Schwab M, Bloch J, Nicod P, Scherrer U (2008) Stimulation of peroxynitrite catalysis improves insulin sensitivity in high fat diet-fed mice. J Physiol 586: 4011–4016.
20. Misko TP, Highkin MK, Veenhuizen AW, Manning PT, Stern MK, Currie MG, Salvemini D (1998) Characterization of the cytoprotective action of peroxynitrite decomposition catalysts. J Biol Chem 273: 15646–15653.
21. HA TS, Barnes JL, Stewart JL, Ko CW, Miner JH, Abrahamson DR, Sanes JR, Kasinath BS (1999) Regulation of Renal Laminin in Mice with Type II Diabetes. J Am Soc Nephrol 10: 1931–1939.
22. Das AM, Harris DA (1990) Control of mitochondrial ATP synthase in heart cells: inactive to active transitions caused by beating or positive inotropic agents. Cardiovasc Res 24: 411–417.
23. Yi L, He J, Liang Y, Yuan D, Gao H, Zhou H (2007) Simultaneously quantitative measurement of comprehensive profiles of esterified and non-esterified fatty acid in plasma of type 2 diabetic patients. Chem Phys Lipids 150: 204–216.
24. Zhou YP, Berggren P-O, Grill V (1996) A fatty-acid decrease in pyruvate dehydrogenase activity is an important determinant of beta-cell dysfunction in the obese diabetic db/db mouse. Diabetes 45: 580–586.
25. Ceriello A, Mercuri F, Quagliaro L, Assaloni R, Motz E, Tonutti L, Taboga C (2001) Detection of nitrotyrosine in the diabetic plasma: evidence of oxidative stress. Diabetologia 44: 834–838.
32. Kozlov AV, Staniek K, Nohl H (1999) Nitrite reductase activity is a novel function of mammalian mitochondria. FEBS Lett 454: 127–130.
![Figure 1. LA-induced [Ca 2+ ] i mobilization and ROS generation. Human mesangial cells were labeled with fura-2 (1 mM) alone or together with DCF (1 mM) (37 u C, 30 min)](https://thumb-eu.123doks.com/thumbv2/123dok_br/18281590.345646/2.918.91.830.89.315/figure-induced-mobilization-generation-human-mesangial-cells-labeled.webp)
![Figure 2. The LA-induced ROS signal was identified as peroxynitrite. (A): HM cells were labeled with fura-2 and DCF and traces represent LA- LA-induced [Ca 2+ ] i mobilization (black trace) and ROS generation (red trace); (B): same measurements performed i](https://thumb-eu.123doks.com/thumbv2/123dok_br/18281590.345646/3.918.91.695.90.886/figure-identified-peroxynitrite-represent-mobilization-generation-measurements-performed.webp)
![Figure 3. Mitochondria played an essential role in LA-induced [Ca 2+ ] i mobilization and peroxynitrite generation](https://thumb-eu.123doks.com/thumbv2/123dok_br/18281590.345646/4.918.90.731.89.792/figure-mitochondria-played-essential-induced-mobilization-peroxynitrite-generation.webp)
![Figure 5. The effect of hsp90b1 on LA-induced [Ca 2+ ] i](https://thumb-eu.123doks.com/thumbv2/123dok_br/18281590.345646/5.918.92.537.93.260/figure-effect-hsp-b-la-induced-ca-i.webp)