AMTD
6, 4313–4332, 2013Quantitative PM10
measurements via X-ray fluorescence
spectroscopy
E. Busetto et al.
Title Page
Abstract Introduction
Conclusions References
Tables Figures
◭ ◮
◭ ◮
Back Close
Full Screen / Esc
Printer-friendly Version
Interactive Discussion
Discussion
P
a
per
|
Dis
cussion
P
a
per
|
Discussion
P
a
per
|
Discussio
n
P
a
per
Atmos. Meas. Tech. Discuss., 6, 4313–4332, 2013 www.atmos-meas-tech-discuss.net/6/4313/2013/ doi:10.5194/amtd-6-4313-2013
© Author(s) 2013. CC Attribution 3.0 License.
Atmospheric Measurement
Techniques
Open Access
Discussions
Geoscientiic Geoscientiic
Geoscientiic Geoscientiic
This discussion paper is/has been under review for the journal Atmospheric Measurement Techniques (AMT). Please refer to the corresponding final paper in AMT if available.
Quantitative measurement of PM
10
by
means of X-ray fluorescence spectra
E. Busetto1, M. Peloi1, L. Rebuffi1, and E. Tefouet Kana2
1
Elettra-Sincrotrone Trieste S.C.p.A., S.S. 14 km 163.5 in Area Science Park, 34139 Basovizza, Trieste, Italy
2
Elettra ICTP Fellows, The Abdus Salam International Centre for Theoretical Physics, Strada Costiera, 11, 34151 Trieste, Italy
Received: 27 March 2013 – Accepted: 30 April 2013 – Published: 14 May 2013
Correspondence to: E. Busetto ([email protected])
AMTD
6, 4313–4332, 2013Quantitative PM10
measurements via X-ray fluorescence
spectroscopy
E. Busetto et al.
Title Page
Abstract Introduction
Conclusions References
Tables Figures
◭ ◮
◭ ◮
Back Close
Full Screen / Esc
Printer-friendly Version
Interactive Discussion
Discussion
P
a
per
|
Dis
cussion
P
a
per
|
Discussion
P
a
per
|
Discussio
n
P
a
per
|
Abstract
We developed an automatic device able to sample and analyze in situ and in real time airborne particulate matter (PM) using the X-ray fluorescence of the chemical species layered on a filter, having atomic numbers between 19 (Potassium) and 82 (Lead). Furthermore, we developed a calibration technique, which gives the parameters for real 5
time automatic determination of the absolute mass of the chemical species present on the sample, with a sensitivity varying from 1 to 100 µg per sample.
Our system could represent a simpler alternative to the complex and sophisticated laboratory measurements, such as Inductively Coupled Plasma Mass Spectrometry (ICP-MS) or Inductively Coupled Plasma-Atomic Emission Spectrometry (ICP-AES), 10
officially used by environmental agencies. A 6 month in-situ test, carried out in collab-oration with the local Regional Environmental Agency, showed that our system gives results comparable with the ones obtained using existing techniques, but with smaller errors. The methodology developed has been submitted for a patent.
1 Introduction
15
In many urban agglomerations of developed countries, industrialization pushes people to live near industrial plants, such as cement factories, ironworks, waste disposal of lead, waste incinerators, which can be sources of airborne particulate matter pollution. Epidemiological studies made over the last 10/15 yr (Cupr et al., 2006; WHO, 2000, 2005, 2006; Tam and Neumann, 2004; Parry et al., 2008), show that airborne pollu-20
tion may cause health problems, such as lung cancer (Parodi et al., 2005; Pauk et al., 2005), Alzheimer disease (Calder ´on-Garcidue ˜nas et al., 2004), and respiratory failure (Kappos et al., 2004). Moreover, it has been demonstrated that the effect of the partic-ulate matter on human health depends on the nature of the particpartic-ulate (WHO, 2000). For these reasons the World Health Organization has fixed some limits related to the 25
AMTD
6, 4313–4332, 2013Quantitative PM10
measurements via X-ray fluorescence
spectroscopy
E. Busetto et al.
Title Page
Abstract Introduction
Conclusions References
Tables Figures
◭ ◮
◭ ◮
Back Close
Full Screen / Esc
Printer-friendly Version
Interactive Discussion
Discussion
P
a
per
|
Dis
cussion
P
a
per
|
Discussion
P
a
per
|
Discussio
n
P
a
per
To determine the concentration (µg m−3) of each chemical species present in air several methods have been developed (Chow, 1995): Atomic Absorption Spectroscopy (AAS), Inductively Coupled Plasma Mass Spectrometry (ICP-MS) or Inductively Cou-pled Plasma-Atomic Emission Spectrometry (ICP-AES), Microwave Induced Break-down Spectroscopy, Laser Induced BreakBreak-down Spectroscopy (LIBS), Spark Induced 5
Breakdown Spectroscopy and X-ray fluorescence.
ICP-MS is a mass spectrometry technique which is able to detect metals and several non-metals at concentrations as low as one part in 1012 (part per trillion). Here, the sample is ionized with inductively coupled plasma and a mass spectrometer is used to separate and quantify the generated ions (Houk et al., 1980; Date and Gray, 1981). 10
ICP-AES, also referred to as inductively coupled plasma optical emission spectrom-etry (ICP-OES), is an analytical technique used for the detection of trace metals. It is a type of emission spectroscopy that uses the inductively coupled plasma to produce excited atoms and ions that emit electromagnetic radiation at wavelengths character-istic of a particular element (Stefansson et al., 2007; Mermet, 2005). The intensity of 15
this emission is a function of the concentration of the element within the sample. Ba-sic steps in AES are: atomization/vaporization of the sample to produce free atomic species (neutrals and ions), excitation of the atoms, detection of the emitted radiation, calibration of the intensity to concentration, determination of the mass of the elements (Miziolek et al., 2006).
20
ICP-MS and ICP-AES are the most common techniques used today to perform this type of analysis even if they are designed for laboratory measurements and cannot be applied in-situ.
X-ray fluorescence (XRF) has been used for the quantitative analysis of airborne particulate matter, since the 1970s.
25
AMTD
6, 4313–4332, 2013Quantitative PM10
measurements via X-ray fluorescence
spectroscopy
E. Busetto et al.
Title Page
Abstract Introduction
Conclusions References
Tables Figures
◭ ◮
◭ ◮
Back Close
Full Screen / Esc
Printer-friendly Version
Interactive Discussion
Discussion
P
a
per
|
Dis
cussion
P
a
per
|
Discussion
P
a
per
|
Discussio
n
P
a
per
|
a device able to automatically sample and analyze lead in air using XRF (US patent No. 4551848, 1985).
More recently, an automated device has been proposed (Cooper et al., 2009) in which a PTFE (Polytetrafluoroethylene) tape is used to collect airborne particulate mat-ter during sampling, and XRF is used for the automatic quantitative analysis, together 5
with an automatic calibration of the measuring device.
Even for quantitative analysis with XRF instruments several methods have been pro-posed (Vanhoof et al., 2003; Richard et al., 2010). In 1999 the United States Environ-mental Protection Agency (US-EPA) developed and released a standard methodology for XRF analysis and absolute mass determination described in Compendium Method 10
IO-3.3 (Kellog and Winberry, 1999). In this description absolute mass values are ob-tained using thin film standards for mass calibration, since they closely resemble a layer of PM on a filter, and considering film surface densities under the XRF irradiated area. PM values are then calculated comparing film standards peak intensities with those of PM filters.
15
In 2003, some researchers of the Flemish Institute for Technological Research de-veloped a new technique to calibrate an XRF spectrometer for quantitative analysis (Vanhoof et al., 2003). This method involves the load of a multi-element aerosol on a filter by means of an ultrasonic nebulizer, and the measurement of the correspond-ing XRF spectrum. Each peak intensity of the XRF spectrum is then associated with 20
the quantity of the corresponding element loaded on the filter determined through the ICP-AES analysis. The mass density (ng cm−2) could be calculated knowing the XRF irradiated area. Similarly, Richard et al. (2010) developed another method for nanogram element quantification using synchrotron radiation as excitation source for XRF analy-sis. The samples used for calibration were obtained by depositing picoliter droplets of 25
a customized solution via an ink-jet printer on thin films and subsequently measuring absolute mass with ICP-OES measurements performed off-line.
AMTD
6, 4313–4332, 2013Quantitative PM10
measurements via X-ray fluorescence
spectroscopy
E. Busetto et al.
Title Page
Abstract Introduction
Conclusions References
Tables Figures
◭ ◮
◭ ◮
Back Close
Full Screen / Esc
Printer-friendly Version
Interactive Discussion
Discussion
P
a
per
|
Dis
cussion
P
a
per
|
Discussion
P
a
per
|
Discussio
n
P
a
per
and a low cost solid state detector with self-cooling Si-PIN. A software procedure has also been developed to automatically analyze XRF spectra and calculate the absolute mass of the chemical species present on the sample, by considering fluorescence peak intensities and comparing them with the reference measurements previously performed with a new mass calibration method.
5
2 Instrumentation and measurement technique
In order to sample and analyze in situ and in real time PM using X-ray fluorescence from the chemical species layered on a filter, we developed an automatic sampling and measurement station (PM-SMS) capable of performing measurements outdoors in all weather conditions, transferring measured data to a central server in which they will be 10
stored ready to be used. All sampling and measurement parameters can be remotely changed at any time since the instrument is equipped with several networking modules (Wifi, Ethernet, GPRS).
The PM-SMS consists of a pumping system that samples environmental air and col-lects the particulate matter on high purity quartz-microfiber discs (hereafter called fil-15
ters) such as those produced by Munktell & FILTRAK GmbH. The sampling parameters are configurable and the system has been designed to comply with atmospheric sam-ple standards set by the EU (Directive 2008/50/EC of the European Parliament). After the sampling, the filter containing PM is exposed to an X-ray tube source with Molybde-num target (produced by Oxford Instruments X-Ray Technology, Inc.) and the emitted 20
fluorescence spectrum is measured using a solid state detector with self-cooling Si-PIN produced by Amptek Inc.
To identify chemical species detectable by the system, the measured XRF spectrum of PM present on the filter has to be compared with the atomic K or L shell emission lines (Janssens, 2005), following the procedure described in the EPA Compendium 25
AMTD
6, 4313–4332, 2013Quantitative PM10
measurements via X-ray fluorescence
spectroscopy
E. Busetto et al.
Title Page
Abstract Introduction
Conclusions References
Tables Figures
◭ ◮
◭ ◮
Back Close
Full Screen / Esc
Printer-friendly Version
Interactive Discussion
Discussion
P
a
per
|
Dis
cussion
P
a
per
|
Discussion
P
a
per
|
Discussio
n
P
a
per
|
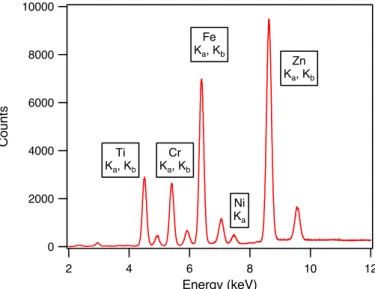
Since atmospheric and environmental conditions could influence the behavior of the multichannel analyzer, an energy calibration is performed by determining the corre-spondence between the analyzer channels and the emission lines of five pure metallic samples of Ti, Cr, Fe, Ni and Zn (see Fig. 1).
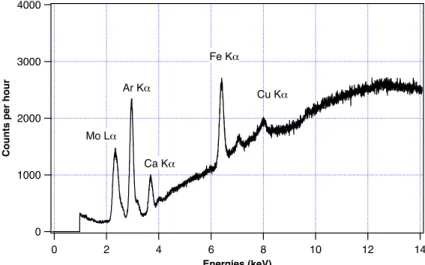
Calibrated XRF spectra in the form of count rate vs. energy, as shown in Fig. 2, 5
are automatically processed by the analysis software, using the following algorithm: fit of the spectrum of the particulate via a polynomial regression, the Savitzky–Golay smoothing filter (Savitzky and Golay, 1964; Press et al., 1992); subtraction of the back-ground spectrum (the “white”) obtained by measuring the X-ray fluorescence spectrum of a clean filter used as reference; deconvolution of this spectrum and automatic iden-10
tification of the chemical species through the comparison of detected peaks with the corresponding K or L shell emission lines (Janssens, 2005). The software algorithm rejects possible spurious peaks of intensity lower than 2 sigma of the noise value of the spectrum calculated as the square root of the peak counts rate at any given energy value. The final determination of the absolute value of the mass of each element is 15
made through the correlation parameter calculated in the mass calibration procedure (see Sect. 3).
Finally a calculation of the absolute concentration in air of PM is done through the normalization of absolute mass chemical element quantities to the measured value of pumped air volume during the sampling. This volume is corrected, in agreement with 20
EU standards (Directive 2008/50/EC of the European Parliament), taking into account the air density calculated considering the temperature and the humidity recorded during PM sampling.
AMTD
6, 4313–4332, 2013Quantitative PM10
measurements via X-ray fluorescence
spectroscopy
E. Busetto et al.
Title Page
Abstract Introduction
Conclusions References
Tables Figures
◭ ◮
◭ ◮
Back Close
Full Screen / Esc
Printer-friendly Version
Interactive Discussion
Discussion
P
a
per
|
Dis
cussion
P
a
per
|
Discussion
P
a
per
|
Discussio
n
P
a
per
3 Absolute mass calibration procedure
To calibrate the instrument we measured the fluorescence spectra of several samples in which there is present a single chemical species, with a known mass quantity, dif-ferent on each sample. The measurement of the intensity of the corresponding peak in the fluorescence spectrum is then directly correlated to this mass quantity, which 5
is assumed to be linear in the range of masses that could be detected by the instru-ment. A simple linear regression gives the correlation parameter, as the slope of the regression line.
Calibrated samples were prepared by depositing, on a polymeric film, known quanti-ties of water solutions containing a salt of the metal to be calibrated. To assure a homo-10
geneous distribution of the solute on the polymeric surface, we treated its surface with a sandblasting process to obtain a micro structured rough surface. Samples with de-creasing quantities of chemical species were obtained by diluting saturated solutions, in order to use the tabulated and certified values of the solubility.
Thanks to the rough surface, after water evaporation, the sample results covered by 15
a salt concretion homogenously distribute in a thin film, with a weight of a few micro-grams, faithfully representing the real particulate deposited on the quartz filter. This mass calibration procedure is designed to be periodic, in order to take into account possible variations due to the exposure of the PM-SMS to different weather condition (i.e. humidity, temperature), or simply due to wear.
20
The calibration method described here is similar to that described by Vanhoof et al. (2003) and Richard et al. (2010) since they use chemically prepared samples for mass calibration. The difference comes from the fact that the masses of chemical elements in the calibrated samples are unknown and the comparison with XRF data is performed by means of an external method such as ICP-AES (Vanhoof et al., 2003) or 25
AMTD
6, 4313–4332, 2013Quantitative PM10
measurements via X-ray fluorescence
spectroscopy
E. Busetto et al.
Title Page
Abstract Introduction
Conclusions References
Tables Figures
◭ ◮
◭ ◮
Back Close
Full Screen / Esc
Printer-friendly Version
Interactive Discussion
Discussion
P
a
per
|
Dis
cussion
P
a
per
|
Discussion
P
a
per
|
Discussio
n
P
a
per
|
and Winberry, 1999). However, since the mass of the standard is obtained by multi-plying thin film density (µg cm−2) by the area illuminated by the X-ray source, a critical issue is its precise determination. In our approach, this problem is overcome since the X-ray beam has a large illuminated area that covers the entire sample deposited on the filter for mass calibration.
5
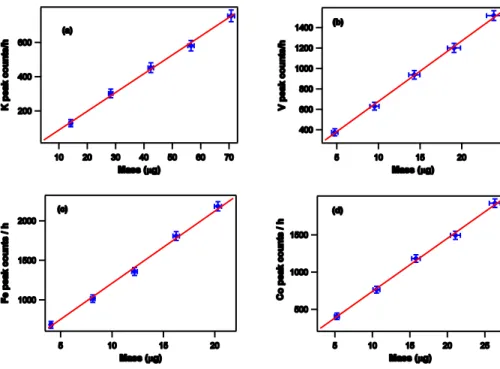
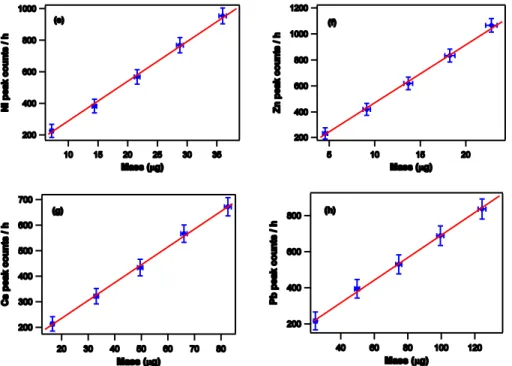
In Fig. 3a and b, the results obtained during mass calibration of elements like Cal-cium, Vanadium, Iron, Cobalt, Nickel, Lead, is presented. These charts show the re-lationship between mass and counts per hour for the analyzed chemical species, which, in the typical range for airborne particulate samplings, can be approximated by a straight line.
10
We also verified that the so called matrix effect (Claisse and Quintin, 1967; Giauque, 1994) is negligible. The calibration curves were re-calculated using samples in which we deposited not only the element under calibration (primary element) but adding one or more elements with a higher atomic number, in order to verify whether their fluores-cence photons, with enough energy to excite the fluoresfluores-cence of the primary element, 15
can produce an increase of the count rate corresponding to the primary element mass. Such an alteration was not observed within the experimental errors.
4 Results and discussion
To test the behavior of PM-SMS in standard operating conditions, we positioned one of our prototypes in the park in front of the Elettra-Sincrotrone Trieste laboratory and we 20
activated the environmental monitoring procedure for a period of 60 days, collecting 30 filters of PM sampled for 48 h following standard sampling rules. We randomly selected a part of those collected filters and analyzed them using ICP-AES method by a certified company, Sangalli Protezioni Ambientali s.r.l. (Italy).
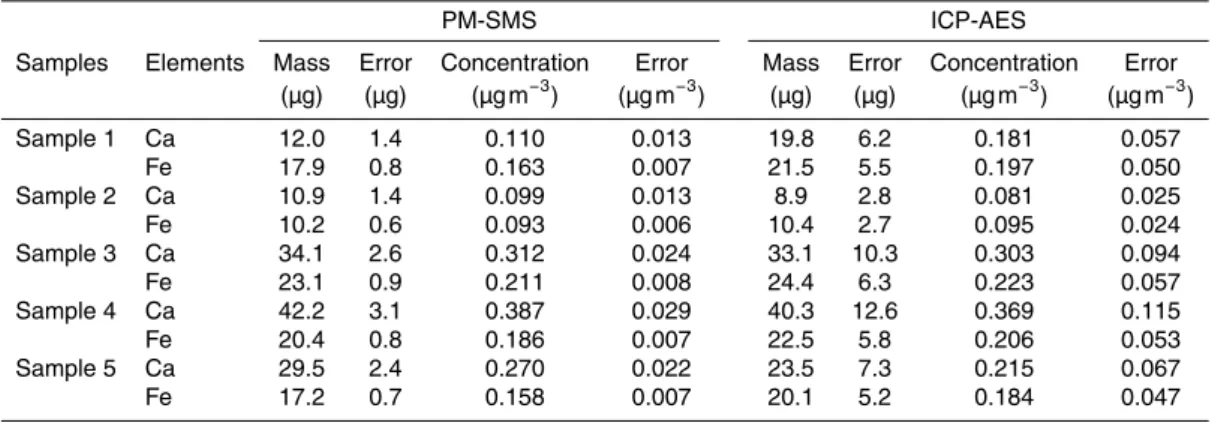
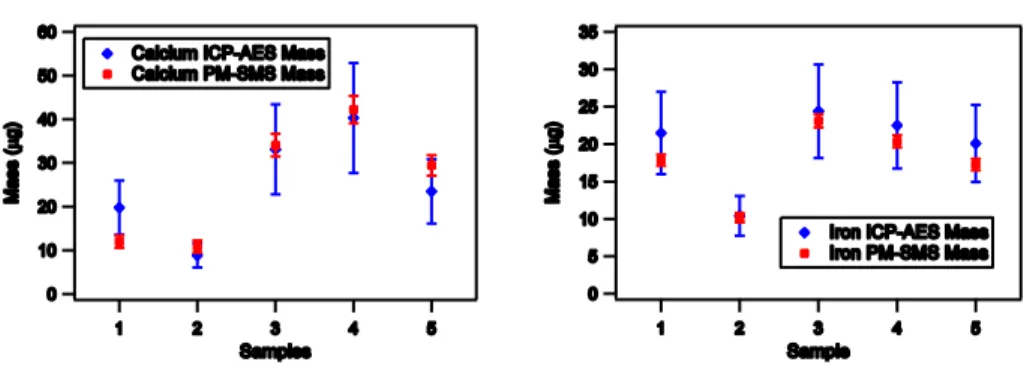
In Table 1, we compare XRF results obtained with the PM-SMS in situ automatic 25
AMTD
6, 4313–4332, 2013Quantitative PM10
measurements via X-ray fluorescence
spectroscopy
E. Busetto et al.
Title Page
Abstract Introduction
Conclusions References
Tables Figures
◭ ◮
◭ ◮
Back Close
Full Screen / Esc
Printer-friendly Version
Interactive Discussion
Discussion
P
a
per
|
Dis
cussion
P
a
per
|
Discussion
P
a
per
|
Discussio
n
P
a
per
in term of mass values and can reach a precision typically 5–6 times better than the traditional method.
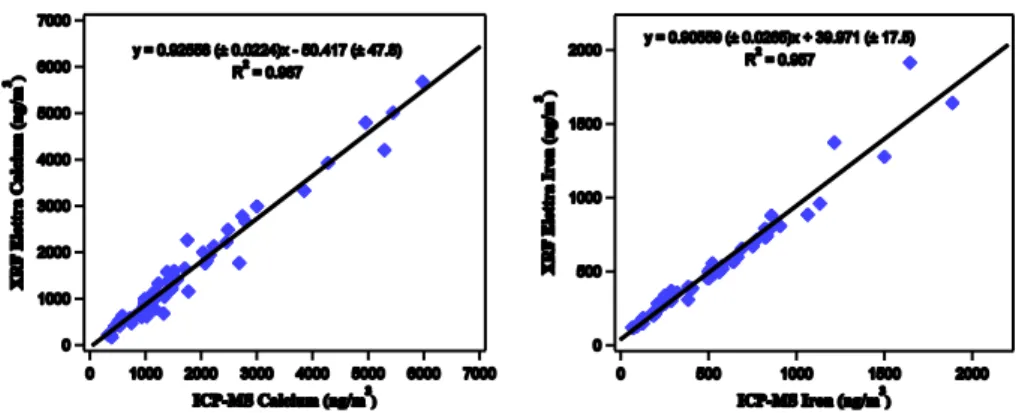
As an additional test, we entered into an agreement with the local environment agency (ARPA-FVG) to complement the traditional measurement stations with PM-SMS, and using the results obtained by ARPA-FVG as a measure of comparison. Two 5
of the locations commonly used by ARPA-FVG for environmental monitoring and pollu-tion control provided with standard sampling PM devices in the surroundings of Trieste (Italy: 45◦39′00′′N, 13◦46′40′′E) were selected and two PM-SMS calibrated proto-types were positioned. The data were collected in 3 measurement campaigns during a period of 6 months (from July to December 2012).
10
As a validation of the method presented in this paper we can see, in Fig. 5, that our measurements (hereafter called XRF Elettra) agree with the ICP-MS analysis made by ARPA-FVG (its reference method).
5 Conclusion
We developed an automatic environmental station for in situ PM chemical speciation, 15
measuring the fluorescence spectrum obtained irradiating the sample with an X-ray source The results obtained were compared with those obtained with the conventional Inductively Coupled Plasma-Atomic Emission Spectrometry (ICP-AES) and Inductively Coupled Plasma-Mass Spectrometry (ICP-MS) methods. We demonstrated that this technique gives results comparable to those of the conventional techniques, with a bet-20
ter precision, adding the availability of real time data analysis. Therefore, PM-SMS can be used not only for the scope described in this paper, but can be a valid tool for en-vironmental safety monitoring and real time alarm systems in places where a risk of heavy metal air contamination could be present.
Acknowledgements. E. Tefouet Kana gratefully acknowledges TRIL Programme in the
25
AMTD
6, 4313–4332, 2013Quantitative PM10
measurements via X-ray fluorescence
spectroscopy
E. Busetto et al.
Title Page
Abstract Introduction
Conclusions References
Tables Figures
◭ ◮
◭ ◮
Back Close
Full Screen / Esc
Printer-friendly Version
Interactive Discussion
Discussion
P
a
per
|
Dis
cussion
P
a
per
|
Discussion
P
a
per
|
Discussio
n
P
a
per
|
Many thanks also to Doriano Lamba for giving to us the access to the Laboratory of Biology at IC-CNR Trieste for sample preparation.
We thank ARPA-FVG for supporting this research activity and Marco Bellini for his kind support during the on-site installation of the PM-SMS in Trieste.
We also thank Consuelo Zemello (ARPAV) for helpful comments on the present work. 5
References
Amptek Inc.: available at: http://www.amptek.com, last access: 21 February, 2013.
Calder ´on-Garcidue ˜nas, L., Reed, W., Maronpot, R. R., Henr´ıquez-Rold ´an, C., Delgado-Chavez, R., Calder ´on-Garcidue ˜nas, A., Dragustinovis, I., Franco-Lira, M., Aragn-Flores, M., Solt, A. C., Altenburg, M., Torres-Jardn, R., and Swenberg, J. A.: Brain inflammation and 10
Alzheimer’s-like pathology in individuals exposed to severe air pollution, Toxicol. Pathol., 32, 650–658, 2004.
Chow, J. C.: Critical review: measurement methods to determine compliance with ambient air quality standards for suspended particles, J. Air Waste Manage. Assoc., 45, 320–382, 1995. Claisse, F. and Quintin, M.: Generalization of the Lachance–Traill method for the correction of 15
the matrix effect in X-ray fluorescence analysis, Can. J. Spectrosc., 12, 129–134, 1967. Cooper, J. A. F., Sarah, C., and Johnsen, B. E.: XRF Analyzer, Cooper Environmental Services
LLC, 10180 SW Nimbus Ave. Suite J6, Portland, OR 97223, US patent 7539282, 2009. Cooper, J., Petterson, K., and Bivins, D.: Field Validation of a Near Real Time
Multi-Metals Fence Line Monitor, US EPA Xact 620 FLM Phase III Presentation, 10 Febru-20
ary 2010, available at: http://cooperenvironmental.com/wp-content/uploads/2010/03/U.S. -EPA-Xact-620-FLM-Phase-III-2010-Presentation.pdf, last access: 21 February, 2013. Cupr, P., Klanova, J., Bartos, T., Flegrova, Z., Kohoutek, J., and Holoubek, I.: Passive air
sam-pler as a tool for long-term air pollution monitoring: Part 2. Air genotoxic potency screening assessment, Environ. Pollut., 144, 406–413, 2006.
25
Date, A. R. and Gray, A. L.: Plasma source mass spectrometry using an inductively coupled plasma and a high resolution quadrupole mass filter, Analyst, 106, 1255–1267, 1981. Giauque, R. D.: A novel method to ascertain sample mass thickness and matrix effects for X-ray
AMTD
6, 4313–4332, 2013Quantitative PM10
measurements via X-ray fluorescence
spectroscopy
E. Busetto et al.
Title Page
Abstract Introduction
Conclusions References
Tables Figures
◭ ◮
◭ ◮
Back Close
Full Screen / Esc
Printer-friendly Version
Interactive Discussion
Discussion
P
a
per
|
Dis
cussion
P
a
per
|
Discussion
P
a
per
|
Discussio
n
P
a
per
Greenwood-Smith, R.: Lead-in-air monitor, Mount Isa Mindes: US patent no. 4551848, 5 November, 1985.
Hammerle, R. H. and Pierson, W. R.: Sources and elemental composition of aerosol in Pasadena, California, by energy-dispersive X-ray, Environ. Sci. Technol., 9, 1058–1068, 1975.
5
Houk, R. S., Fassel, V. A., Flesch, G. D., Svec, H. J., Gray, A. L., and Taylor, C. E.: Induc-tively coupled argon plasma as an ion source for mass spectrometric determination of trace elements, Anal. Chem., 52, 2283–2289, 1980.
Parry, M. L., Canziani, O. F., Palutikof, J. P., Van der Linden, P. J., and Hanson, C. E. (Eds.): Climate Change 2007: Impacts, Adaptation and Vulnerability, Contribution of Working Group 10
II to the Fourth Assessment Report of the Intergovernmental Panel on Climate Change, Cambridge University Press, Cambridge, UK, 976 pp., 2008.
Janssens, K.: Methods 4: elemental analysis, in: Handbook of Spectroscopy, Vol. 1, edited by: Gauglitz, G. and Vo-Dinh, T., Wiley-VCH GmbH Co. KGaA, Weinheim, FRG, 363–420, 2005. Kappos, A. D., Bruckmann, P., Eikmann, T., Englert, N., Heinrich, U., Hoppe, P., Koch, E., 15
Krause, G. H. M., Kreyling, W. G., and Rauchfuss, K.: Health effects of particles in ambient air, Int. J. Hyg. Envir. Heal., 207, 399–407, 2004.
Kellog, B. and Winberry, W. T. J.: Determination of metals in ambient particulate matter using x-ray fluorescence (XRF) spectroscopy, in: Compendium of Methods for the Determination of Inorganic Compounds in Ambient Air, Center for Environmental Research Information, Office 20
of Research and Development, US Environmental Protection Agency, Cincinnati, OH 45268, EPA-625/R-96/010a, 36 pp., 1999.
Mermet, J. M.: Is it still possible, necessary and beneficial to perform research in ICP-atomic emission spectrometry?, J. Anal. At. Spectrom., 20, 11–16, 2005.
Miziolek, A. W., Palleschi, V., and Schechter, I.: Laser Induced Breakdown Spectroscopy, Cam-25
bridge University Press, Cambridge, UK, 640 pp., 2006.
Munktell & Filtrak GMBH: Niederschlag, available at: http://www2.munktell.se/eng/, last access: 21 February, 2013.
Oxford Instruments X-Ray Technology Inc.: available at: http://www.oxford-instruments.com/, last access: 14 May, 2013.
30
AMTD
6, 4313–4332, 2013Quantitative PM10
measurements via X-ray fluorescence
spectroscopy
E. Busetto et al.
Title Page
Abstract Introduction
Conclusions References
Tables Figures
◭ ◮
◭ ◮
Back Close
Full Screen / Esc
Printer-friendly Version
Interactive Discussion
Discussion
P
a
per
|
Dis
cussion
P
a
per
|
Discussion
P
a
per
|
Discussio
n
P
a
per
|
Pauk, N., Kubik, A., Zatloukal, P., and Krepela, E.: Lung cancer in women, Lung Cancer-J. IASLC 48, 1–9, 2005.
Petterson, K. A. and Cooper, J. A.: Operating Experience with a Near-Real-Time Ambi-ent Airborne Metals InstrumAmbi-ent System (Cooper EnvironmAmbi-ental Systems Xact 620), Na-tional Ambient Air Monitoring Conference, Nashville, Tennessee, 2–5 November, available 5
at: http://www.epa.gov/ttnamti1/files/2009conference/wetherell.pdf, last access: 19 February 2013, 2009a.
Petterson, K. A. and Cooper, J. A.: US EPA Final Report on Field Bias and Precision Demon-stration of a Near-Real-Time Multi-Metals Ambient Fence Line Monitor, Cooper Environmen-tal Services LLC, Portland, OR, MACTEC Federal Programs, Research Triangle Park, NC, 31 10
December, available at: http://cooperenvironmental.com/wp-content/uploads/2010/03/, last access: 19 February 2013, 2009.
Petterson, K. A. and Cooper, J. A.: Multi-metals CEMS: A review of currently available tech-nology, Air and Waste Management Association – Symposium on Air Quality Measurement Methods and Technology, 2–4 November 2010, Los Angeles, California, USA, 1, 432–470, 15
2010.
Petterson, K., Cooper, J., Bivins, D., Turner, J., and Wetherell, W.: Evaluation of a near real time metals monitor for measuring fugitive metal emissions, A&WMA Annual Conference and Ex-hibition, Calgary, Alberta, 25 June, available at: http://cooperenvironmental.com/wp-content/ uploads/2010/11/Ambient-Metals-Monitor-2010-AWMA-Presentation.pdf, last access: 19 20
February 2013, 2010.
Press, W. H., Teukolsky, S. A., Vetterling, W. T., and Flannery, B. P.: Numerical Recipes in C: the Art of Scientific Computing, 2nd edn., Cambridge University Press, Cambridge New York Port Chester Melbourne Sydney, 1992.
Richard, A., Bukowiecki, N., Lienemann, P., Furger, M., Fierz, M., Minguill ´on, M. C., Weideli, B., 25
Figi, R., Flechsig, U., Appel, K., Pr ´ev ˆot, A. S. H., and Baltensperger, U.: Quantitative sam-pling and analysis of trace elements in atmospheric aerosols: impactor characterization and Synchrotron-XRF mass calibration, Atmos. Meas. Tech., 3, 1473–1485, doi:10.5194/amt-3-1473-2010, 2010.
Sangalli Protezioni Ambientali s.r.l.: Piazzale Veronica Gambara 7/20, 20146 Milano, available 30
at: www.sangalli-pa.it (last access: 22 April), 2010.
AMTD
6, 4313–4332, 2013Quantitative PM10
measurements via X-ray fluorescence
spectroscopy
E. Busetto et al.
Title Page
Abstract Introduction
Conclusions References
Tables Figures
◭ ◮
◭ ◮
Back Close
Full Screen / Esc
Printer-friendly Version
Interactive Discussion
Discussion
P
a
per
|
Dis
cussion
P
a
per
|
Discussion
P
a
per
|
Discussio
n
P
a
per
Stefansson, A., Gunnarsson, I., and Giroud, N.: New methods for the direct determination of dissolved inorganic, organic and total carbon in natural waters by Reagent-Free Ion Chro-matography and inductively coupled plasma atomic emission spectrometry, Anal. Chim. Acta, 582, 69–74, 2007.
Tam, B. N. and Neumann, C. M.: A human health assessment of hazardous air pollutants in 5
Portland, J. Environ. Manage., 73, 131–145, 2004.
The European Parliament and the Council of the European Union: Directive 2008/50/EC of 21 May 2008 on ambient air quality and cleaner air for Europe, Brussels, Belgium, avail-able at: http://eur-lex.europa.eu/LexUriServ/LexUriServ.do?uri=OJ:L:2008:152:0001:0044: EN:PDF (last access: 8 May 2013), 2008.
10
Vanhoof, C., Cheng, H., Berghmans, P., Corthouts, V., De Brucker, N., and Tirez, K.: A risk assessment study of heavy metals in ambient air by WD-XRF spectrometry using aerosol-generated filter standards, X-Ray Spectrom., 32, 129–138, 2003.
WHO (World Health Organization) Regional Office for Europe: Air Quality Guidelines for Eu-rope, 2nd edn., European Series, No. 91, WHO Regional Publications, Copenhagen, 2000. 15
WHO: WHO Air Quality Guidelines, Global Update 2005, Report on a Working Group meeting, Bonn, Germany, 18–20 October, 2005.
WHO: Air Quality Guidelines Global Update 2005 Particulate matter, ozone, nitrogen diox-ide and sulfur dioxdiox-ide, WHO/SDE/PHE/OEH/06.02, WHO Air Quality Gudiox-idelines, Geneva, Switzerland, 2006.
AMTD
6, 4313–4332, 2013Quantitative PM10
measurements via X-ray fluorescence
spectroscopy
E. Busetto et al.
Title Page
Abstract Introduction
Conclusions References
Tables Figures
◭ ◮
◭ ◮
Back Close
Full Screen / Esc
Printer-friendly Version
Interactive Discussion
Discussion
P
a
per
|
Dis
cussion
P
a
per
|
Discussion
P
a
per
|
Discussio
n
P
a
per
|
Table 1.Comparison between the results obtained by measuring airborne particulate deposited on filters with PM-SMS operating in the park in front of Elettra laboratory and the ICP-AES method by a certified laboratory. The sampling time was 48 h per filter and the average pump flux was 38.33 L min−1.
PM-SMS ICP-AES
Samples Elements Mass Error Concentration Error Mass Error Concentration Error (µg) (µg) (µg m−3) (µg m−3) (µg) (µg) (µg m−3) (µg m−3)
Sample 1 Ca 12.0 1.4 0.110 0.013 19.8 6.2 0.181 0.057
Fe 17.9 0.8 0.163 0.007 21.5 5.5 0.197 0.050
Sample 2 Ca 10.9 1.4 0.099 0.013 8.9 2.8 0.081 0.025
Fe 10.2 0.6 0.093 0.006 10.4 2.7 0.095 0.024
Sample 3 Ca 34.1 2.6 0.312 0.024 33.1 10.3 0.303 0.094
Fe 23.1 0.9 0.211 0.008 24.4 6.3 0.223 0.057
Sample 4 Ca 42.2 3.1 0.387 0.029 40.3 12.6 0.369 0.115
Fe 20.4 0.8 0.186 0.007 22.5 5.8 0.206 0.053
Sample 5 Ca 29.5 2.4 0.270 0.022 23.5 7.3 0.215 0.067
AMTD
6, 4313–4332, 2013Quantitative PM10
measurements via X-ray fluorescence
spectroscopy
E. Busetto et al.
Title Page
Abstract Introduction
Conclusions References
Tables Figures
◭ ◮
◭ ◮
Back Close
Full Screen / Esc
Printer-friendly Version
Interactive Discussion
Discussion
P
a
per
|
Dis
cussion
P
a
per
|
Discussion
P
a
per
|
Discussio
n
P
a
per
10000
8000
6000
4000
2000
0
Counts
12 10
8 6
4 2
Energy (keV) Fe Ka, Kb
Ti Ka, Kb
Zn Ka, Kb
Ni Ka
Cr Ka, Kb
AMTD
6, 4313–4332, 2013Quantitative PM10
measurements via X-ray fluorescence
spectroscopy
E. Busetto et al.
Title Page
Abstract Introduction
Conclusions References
Tables Figures
◭ ◮
◭ ◮
Back Close
Full Screen / Esc
Printer-friendly Version
Interactive Discussion
Discussion
P
a
per
|
Dis
cussion
P
a
per
|
Discussion
P
a
per
|
Discussio
n
P
a
per
|
4000
3000
2000
1000
0
Counts per hour
14 12
10 8
6 4
2 0
Energies (keV)
Fe K_
Mo L_ Ar K_
Ca K_
Cu K_
Fig. 2.Fluorescence spectrum obtained during iron mass calibration: molybdenum (Mo Lα)
peak comes from the X-ray tube scattered photons; argon (Ar Kα) peak comes from the air,
calcium (Ca Kα) and copper (Cu Kα) peaks come from contaminants present in the polymeric
filter holder (positioned behind the filter), iron (Fe Kα) peak comes from the element we
AMTD
6, 4313–4332, 2013Quantitative PM10
measurements via X-ray fluorescence
spectroscopy
E. Busetto et al.
Title Page
Abstract Introduction
Conclusions References
Tables Figures
◭ ◮
◭ ◮
Back Close
Full Screen / Esc
Printer-friendly Version
Interactive Discussion
Discussion
P
a
per
|
Dis
cussion
P
a
per
|
Discussion
P
a
per
|
Discussio
n
P
a
per
|
AMTD
6, 4313–4332, 2013Quantitative PM10
measurements via X-ray fluorescence
spectroscopy
E. Busetto et al.
Title Page
Abstract Introduction
Conclusions References
Tables Figures
◭ ◮
◭ ◮
Back Close
Full Screen / Esc
Printer-friendly Version
Interactive Discussion
Discussion
P
a
per
|
Dis
cussion
P
a
per
|
Discussion
P
a
per
|
Discussio
n
P
a
per
|