0103 - 5053 $6.00+0.00
A
r
ti
c
le
* e-mail: [email protected]
Determination of Ranitidine in Drugs Using a Mercury Coated Platinum
Ultramicroelectrode and Hanging Mercury Dropping Electrode
Andréa R. Malagutti and Luiz H. Mazo*
Instituto de Química de São Carlos, Universidade de São Paulo, CP 780, 13560-970 São Carlos - SP, Brazil
O comportamento voltamétrico da ranitidina foi estudado em meio aquoso utilizando um ultramicroeletrodo de platina com eletro-depósito de mercúrio (Hg-UME) e o eletrodo de gota pendente de mercúrio, HMDE. A voltametria de varredura linear (LSV) mostrou que o composto apresenta duas ondas de redução em pH < 4,0 e somente uma em pH > 4,0, sendo as ondas observadas atribuídas à redução do grupo nitro para hidroxilamina. Foi observada uma relação linear entre a corrente de pico ou corrente limite e a concentração de ranitidina utilizando o HMDE ou o Hg-UME, demonstrando que a LSV com estes eletrodos pode ser utilizada na determinação analítica de ranitidina. Uma metodologia alternativa e mais sensível para determinação analítica de ranitidina utilizando a técnica SWV também foi desenvolvida, com um limite de detecção de 3,5 x 10⁻⁸ mol L-1 (ou 11 µg L-1). Os estudos de recuperação aparente (AR) mostraram a exatidão e precisão da metodologia desenvolvida. Os excipientes encontrados nos comprimidos de marca (Glaxo Wellcome) e genérico (EMS) não interferiram na determinação de ranitidina.
The voltammetric behavior of ranitidine has been studied in aqueous media with a mercury coated platinum ultramicroelectrode (Hg-UME) and by HMDE. The LSV curves for the electroreduction of ranitidine showed that the compound presents two reduction waves in pH < 4.0 and only one in pH > 4.0, the observed waves being attributed to the reduction of the nitro group to hydroxylamine. A linear relation between the current peak or limiting current and the ranitidine concentration using HMDE or Hg-UME was observed, demonstrating that these ultramicroelectrodes can be used in the analytical determination of ranitidine. An alternative and more sensitive methodology for the analytical determination of ranitidine by SWV was also developed, with a detection limit of 3.5 x 10⁻⁸ mol L-1 (or 11 µg L-1). The apparent recovery (AR) studies proved the accuracy and precision of the assay developed. The excipients found in comercial Antak tablets (Glaxo Wellcome) and the generic from EMS do not interfere in the determination.
Keywords: Ranitidine, square wave voltammetry, cyclic voltammetry, ultramicroelectrode
Introduction
Ranitidine, N-(2-{[(5-dimethylamino)methyl]2- furanyl}-methylthioethyl)-N’-methyl-2-nitro-1,1’-ethenodiamine (RNT), is an inhibitor of gastric acid secretion and is used in the treatment of gastric and duodenal ulcers. It competitively inhibits the action of histamine on the H2 receptors of parietal cells.1,2 There are some works in the literature that describe the use of conventional HMDE and DME electrodes to study its electrochemical reduction1,2 and the determination of ranitidine in pharmaceutical formulations,1-4 employing
polarographic techniques, and in biological materials,1,5 employing voltammetric techniques. The use of mercury coated ultramicroeletrodes (Hg-UMEs) is an alternative to the massive use of mercury, allowing the in situ application to biological systems of low dimension of samples which differs the present method from the photometric ones.
Mercury deposition on an ultramicroelectrode has been shown to follow the behavior predicted for a hemispherical diffusional field. The radius (r) of the obtained hemispheric deposit is related to the deposition time by: r= [2MDCt /
ρ]1/2, where M is the atomic weight of mercury, D is the
diffusion coefficient of the mercuric ion, C is the concentration of the mercuric ion, ρ is the density of mercury, and t is the deposition time in seconds.7 The stability of preplated mercury-coated platinum ultra-microelectrodes has been studied.10 It was found that mercury electrodes produced by constant potential deposition were easily made, durable, reproducible and show several applications in heavy metal trace determinations.7 However, this kind of electrode have been little employed to study and to analyze organic compounds.
The present paper, describes the use of a mercury-coated platinum ultramicroeletrode to study the electro-chemical reduction of ranitidine (Figure 1) and its use in determination of this drug in pharmaceutical formulations using cyclic voltammetry (CV) and square wave voltammetry (SWV). The results obtained with the ultramicroelectrode were compared with the results obtained with conventional electrodes and a new, more sensitive and reproducible SWV method using a hanging mercury dropping electrode(HMDE) for the quantitative determination of ranitidine in tablets was developed.
Experimental
Materials
The standard stock solutions (1.0 x 10⁻² mol L-1) of ranitidine hydrochloride, provided by ICN Biomedicals Inc., were prepared by weighting 78.6 mg of the compound and dissolving this in water of Milli-Q quality (Millipore) to obtain 25.0 mL of solution.
Tablets containing 150.0 mg of ranitidine plus excipients were available from the manufacturer (Glaxo Wellcome and EMS). A single tablet of each sample was
weighed and finely powdered, transferred to a 50.0 mL volumetric flask and diluted to volume with Milli-Q water to obtain a 1.0 x 10⁻³ mol L-1 solution.
To study the effect of pH on the electrochemical
behavior of ranitidine, 0.1 mol L-1 phosphate buffer solutions were prepared in the pH range of 1.5 to 7.0. For analytical determinations, a pH 3.0 buffer solution was chosen.
A 0.07 mol L-1 Hg(NO
3)2 stock solution for mercury deposition was prepared by dissolving mercury metal in 1:1 nitric acid, followed by dilution with Milli-Q water.
All chemicals were of analytical grade (Merck).
Apparatus
In the voltammetric experiments using the ultramicro-electrodes, a 10.0 mL electrochemical cell was used in conjunction with an EG & G PAR Model 174-A polaro-graphic analyzer interfaced to a IBM-PC computer. Lab-made software and an instrumentation interface were used to control the experiments.11
The experiments were performed with a two electrode cell in which the working electrode was the Hg-UME obtained by mercury electrodeposition onto an inlaid disk of platinum (φ = 25 µm). The other electrode, functioning as reference and auxiliary, was a Ag/AgCl(s) electrode. The cell was maintained in a shielded Faraday cage made of sheets of aluminum foil to avoid the noise amplification. In the voltammetric experiments using the conventional HMDE electrode, a three electrodes cell configuration was employed using a HMDE Radiometer model MDE 150, a platinum wire counter electrode, and a Ag/AgCl(s) reference electrode. The SWV measurements were registered using a Radiometer Analytical potentiostat Model PGZ 402 Voltalab. The polarographic experiments were performed using an EG & G PAR Model 384 B polarographic analyzer coupled to a dropping mercury (DME) working electrode, a platinum wire counter electrode, and a Ag/AgCl(s) reference electrode.
Conventional voltammetric techniques, mainly CV, LSV and SWV, as well as polarography, were employed throughout this work.
Spectrophotometric measurements were carried out with a HITACHI model 2010 spectrophometer using 1 cm quartz cells. Spectra were recorded between 200 and 400 nm, and quantitative sample measurements were made at 313 nm, for comparison purposes.
Procedures
The platinum microdisk, which served as the substrate for mercury deposition was prepared by sealing a wire of 25
polished surface of the Pt UME was examined by means of a Olympus Metalographic microscope.
Stable deposits were produced in deoxygenated 0.07 mol L-1 Hg(NO
3)2 solution by applying a potential of –800 mV for 60 or 90 seconds.
To obtain the calibration curves by SWV, the standard stock solution was accurately diluted with pH 3.0 phosphate buffer to obtain solutions ranging from 4.98 to 90.90 µmol L-1. The calibration curve was obtained by measuring the second peak of ranitidine reduction (Ep = –0.80 V) at pH 3.0. Other operational conditions were: pulse amplitude (∆Ep) of 50 mV; scan increment (∆Es) of 2 mV and frequency (ƒ) of 100 s-1.
The UV-vis spectrophotometric measurements, carried out for comparative purposes, were carried out by diluting the standard stock solution with pH 3.0 phosphate buffer to obtain concentrations ranging from 4.98 to 74.10 µmol L-1. The calibration curve was obtained by measuring the absorbance at 313 nm.
The voltammetric measurements were carried out in a potential range of -0.2 to -1.6 V. The scan rate was varied from 5 to 1000 mV s-1. Solutions were purged with pure nitrogen for 5 min before each voltammetric or polaro-graphic experiment. The operating conditions for d.c. polarographic experiments were: scan rate 10 mV s-1; drop time 0.5 s; potential range -0.2 to -1.6 V.
The SWV experiments were performed with a hanging mercury drop working electrode (HMDE) with a surface area of 0.012 cm2. The supporting electrolyte was 0.1 mol L-1 phosphate buffer in the pH range 1.5 to 7.0. In the RNT recovery experiments, aliquots of the supernatant of synthetic sample (1.0 x 10⁻³ mol L-1) solutions were used, after the insoluble material had settled out. These aliquots were diluted in 10.0 mL of 0.1 mol L-1 phosphate buffer, pH 3.0. The solutions were purged with pure nitrogen for 10 min prior to the experiments and during 3 min before each scan. Each measurement was performed on separate mercury drops and repeated four times under the same conditions.
Results and discussion
Effect of pH
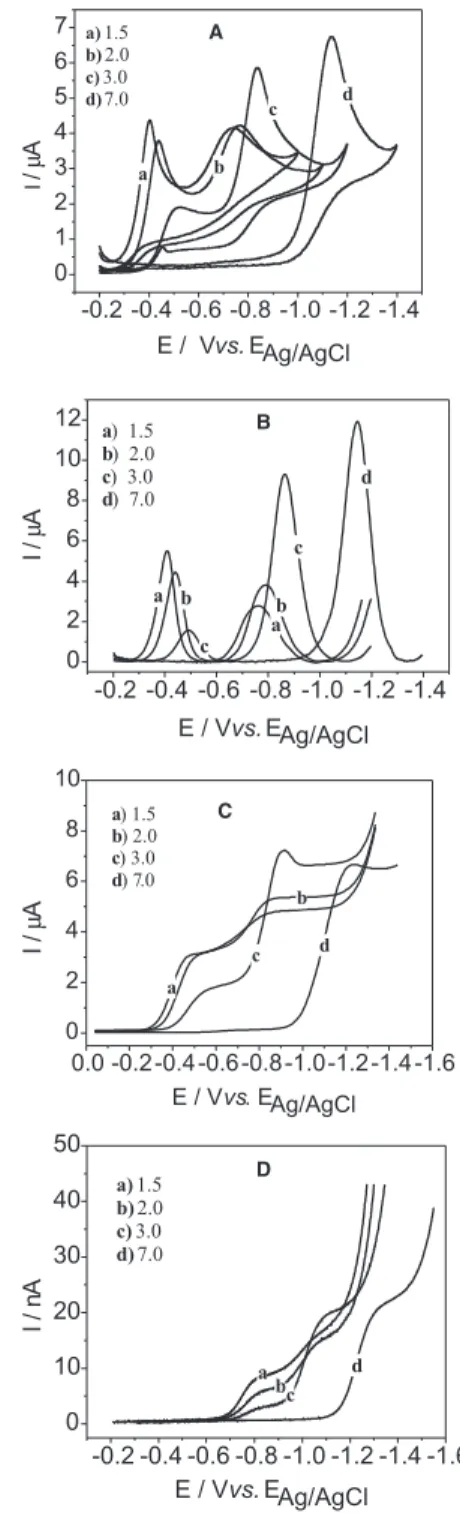
The VC, SWV and d.c.- tast polarography of RNT presents two well-defined peaks (or waves) in the pH range 1.5 to 4.0 and a single, well-defined peak at pH above 4.0. This behavior is characteristic of nitro group reduction in aqueous media, and involves four-electrons and four protons, in an irreversible reaction which leads to the hydroxylamine derivative.13
Figure 2. (A) CV curves registered using HMDE; (B) SWV, f = 50 s-1;
∆Ep = 50 mV and ∆Es = 2 mV; (C) d.c- tast polarograms and (D) LSV curves using Hg-UME for RNT, 0.5 x 10⁻³ mol L-1, v = 50 mV s-1 at different pH.
The LSV, SWV and d.c. polarography curves present the expected behavior for irreversible waves in the pH range studied. The LSV curves registered with Hg-UME show an unexpected potential shift of ca. 200 to 300 mV to more negative values in relation to the LSV or SWV wave potentials, this shift being more pronounced for the first wave. Figure 2D shows the LSV curves recorded for the reduction of ranitidine in aqueous solution at the Hg-UME.
As a way to compare the effect of pH on the d.c. polarographic or Hg-UME LSV waves of ranitidine, the half-wave potentials, E1/2, at different pH were measured (Figures 3A and 3B). In Figure 3A, two breaks and two different straight lines for the first and second peaks are observed. For the first peak at the intercept between the two straight lines, we obtain pKa = 2.8, which is in accordance with the literature,1 while for the second peak, only a slight change in the slope above pH 4.0 is observed. Figure 3B shows that the LSV curves for ranitidine in Hg-UME are more sensitive to pH changes and we can observe three different straight lines with two changes in the slope, at pH 2.8 and at pH 4.0, respectively, denoting drastic changes in reaction mechanisms at these pH values. The relationship between the limiting current and pH is show in the inserts of Figures 3A and 3B. From these
Figures, we can observe that the limiting current for the first wave decreases with increasing pH and that of the second wave increases with the increase of pH, being almost pH-independent above pH 4.0.13
Cyclic voltammetry and LSV
The voltammograms presented in Figure 4A and 4B are representative of the results obtained for RNT in phosphate buffer, respectively, with a HMDE and a Hg-UME. These voltammograms were recorded for the reduction of ranitidine over the range of scan rates from 10 to 500 mV s-1.
A cyclic voltammetric study of ranitidine in phosphate buffer, pH 2.0, using HMDE (Figure 4A), shows two irreversible peaks that shift to more negative potentials when the sweep rate is increased. Furthermore, the peak current increases with increasing sweep rate. From the sharp shape of the voltammograms, an adsorption process seems likely. However, the slope dlogIp / dlogv was 0.43 and 0.59 for peak 1 and peak 2 at pH 2.0, respectively, which leads to the conclusion that the process follows diffusion control at this pH value. The expected theoretical value for this slope is 0.5 for diffusion control and 1 for adsorption control.14
Figure 3. Half-wave potentials and limiting current dependence on pH for 0.5x10⁻³ mol L-1 RNT solutions (A) d.c.- tast polarography and (B) LSV with Hg-UME
The voltammograms registered using the Hg-UME, Figure 4B are well shaped and display the expected sigmoidal behavior for both forward and backward scans, which is expected for ultramicrolectrodes under steaty-state conditions.15 The cathodic scan yields a current plateau, independent of the scan rate. In the Figure, the first cathodic wave shifts towards a more negative potential when increasing the scan rate, but, for the second cathodic wave, this behavior is not seen and the limiting current increases as the scan rate increases. Another aspect that can be observed is that the two reduction waves appear at more negative potentials when we compare them with the results obtained with HMDE.
A diffusion coefficient of 8.24 x 10⁻⁶ cm2 s-1 for RNT in phosphate buffer (pH 7.0) was calculated, comparing the steady state limiting currents at the Hg-UME with a hemispherical deposit of 1.07 x 10⁻³ cm radius, for a 0.99 x 10⁻³ mol L-1 RNT solution and the same solution concentration for ruthenium hexaammine trichloride (Ru(NH3)6Cl3), whose reported diffusion coefficient is 6.0 x 10⁻⁶ cm2 s-1.6 The cyclic voltammograms for RNT and ruthenium hexaammine trichloride are shown in Figure 5.
Ranitidine analysis
The limiting LSV current at the Hg-UME (Figure 6) and the SWV peak current at the HMDE (Figure 7) have kept proportionality with a good range of RNT concen-tration, as shown in the inserts for these Figures.
As shown in Figure 6 the lowest linear concentration range found for the ranitidine determination was (0.10 x 10⁻³ – 0.75 x 10⁻³ mol L-1) when using the first LSV wave and between (0.20 x 10⁻³ – 0.70 x 10⁻³ mol L-1) for the second wave. For SWV, the lowest linear range (Figure 7) corresponds to the concentration range 9.90 x 10⁻⁶ – 90.90 x 10⁻⁶ mol L-1.
From the registered voltammograms and the calibration curves presented in Figures 6 and 7, the following analytical equations are obtained:
LSV: Hg-UME - Second wave: Id(nA)= 0.12701 – 16.75041 [RNT] (mol L-1) (R= 0.9982)
SWV: HMDE- Second wave: Ip(µA)= - 0.1513 + 0.0205 [RNT](mol L-1) (R= 0.9999)
To obtain comparative results, we also used a UV spectrophotometric method, based on the ranitidine absorption band at 313 nm (pH 3.0).1,4 A linear relationship between absorptivity and drug concentration was found, and a linear calibration curve was obtained for
concen-Figure 5. Cyclic voltammograms of (A) 0.990 x 10⁻³ mol L-1 ranitidine and (B) 0.990 x 10⁻³ mol L-1 ruthenium hexaammine trichlo-ride, in 0.1 mol L-1 phosphate buffer, pH 7.0, at a Hg-UME with a hemispherical deposit of 1.07 x 10⁻³ cm radius, v = 5 mV s-1.
Figure 6. LSV curves registered for ranitidine in 0.1 mol L-1 phos-phate buffer at pH 2.0. (a) 0.1; (b) 0.2; (c) 0.3; (d) 0.4; (e) 0.5; (f) 0.6; (g) 0.7; (h) 0.8; (i) 0.9; (j) 1.0 mmol L-1, using a Hg-UME with a scan rate of 50mV s-1. Calibration curves obtained for wave 1 and wave 2 inserted.
trations ranging between 4.97 x 10⁻⁶ mol L-1 and 74.07 x 10⁻⁶ mol L-1. The following equation describes this curve:
A= - 0.0174 + 16.79 x 10³ [RNT] (mol L-1) (R= 0.9999),
Figure 7. SWV curves for ranitidine in 0.1 mol L-1 phosphate buffer at pH 3.0. (a) 4.98; (b) 14.8; (c) 24.4; (d) 33.8; (e) 43.1; (f) 52.1; (g) 61.0; (h) 69.8; (i) 76.3; (j) 86.7; (k) 90.9 µmol L-1, using HMDE, ƒ = 100 s-1, ∆E
p = 50 mV and ∆Es = 2 mV. Calibration curve for peak 2 inserted.
Table 1. Apparent recovery (AR) of ranitidine from different samples
LSV (Hg-UME) SWV (HMDE) Spectrophotometry
Sample Found (mg) % AR Found (mg) % AR Found (mg) % AR
Standard 150.1 ± 7.1 100.1 ± 4.9 150.1 ± 7.1 100.1 ± 4.7 151.0 ± 3.8 100.7 ± 2.5
Antak(Glaxo-Wellcome)a 146.6 ± 0.7 097.7 ± 0.4 151.3 ± 3.7 100.9 ± 2.4 160.9 ± 4.9 107.3 ± 3.1
Generic (EMS)a 163.6 ± 6.6 109.1 ± 4.2 155.3 ± 3.2 103.5 ± 2.3 167.4 ± 1.2 111.6 ± 0.7
Values from an average of four determinations; aRanitidine tablets: declared amount=150 mg. Determination of RNT in tablets
For the analytical determination of RNT in commercial tablets, the second wave of ranitidine reduction (E1/2 = -0.90 V) in 0.1 mol L-1 phosphate buffer pH 2.0 was chosen. The quantitative determination of ranitidine was first carried out using the Hg-UME and the LSV technique, while for the analytical determination of RNT using the SWV technique, the second peak of ranitidine reduction (Ep= -0.80 V) in 0.1 mol L-1 phosphate buffer pH 3.0 was used. The peak height shows a good correlation with ranitidine concentration over the range 9.90 x 10⁻⁶ – 90.90 x 10⁻⁶ mol L-1; with a detection limit of 3.5 x 10⁻⁸ mol L-1 (or 11 µg L-1), determined using the 3s/B criteria. Table 1 shows the apparent recoveries obtained in tests carried out with synthetic samples. The results in Table 1 show that all methods developed present similar accuracy and precision, one of the advantages of the voltammetric methods over the spectrophotometric one is that the excipients do not interfere in the analysis.
Conclusions
The electrochemical reduction of RNT showed that this compound presents two irreversible reduction waves
at pH < 4.0 and only one in pH > 4.0. These waves shifted towards more negative potentials when the pH increased and were attributed to the reduction of the nitro group of RNT to hydroxylamine. The limiting LSV current for the first wave decreased with increasing pH and that of the second wave increased with an increase of pH, being almost pH independent above pH 4.0.
The LSV curves registered with the Hg-UME showed an unexpected potential shift of ca. 200 to 300 mV to more negative values, in relation to the LSV or SWV waves. A study of the reduction reaction of RNT using the Hg-UME at different pH permitted determining a pKa = 2.8, and a diffusion coefficient of 8.24 x 10⁻⁶ cm2 s-1 in phosphate buffer at pH 7.0.
The quantitative determination of RNT using Hg-UME and the LSV technique permitted obtaining an apparent recovery value of 97.7% with a relative standard deviation (RSD) of 0.4 for an Antak (Glaxo-Wellcome laboratories) formulation and an apparent recovery value of 109.1% (RSD=4.2) for the generic (EMSâ laboratories) formulation. A detection limit of 3.5 x 10⁻⁸ mol L-1 using the SWV technique was calculated and the recovery study using the SWV method showed an apparent recovery value of 100.9% (RSD= 2.4) for the Antak and an apparent recovery value of 103.5% (RSD=2.3) for the generic formulation. The comparative results using the UV spectrophotometric method showed an apparent recovery value of 107.3% (RSD=3.0) for the Antak formulation and an apparent recovery value of 111.6% (RSD=0.7) for the generic formulation. Although all the methods developed showed similar accuracy and precision, the advantage of the voltammetric methods over the spectrophotometric one is that the excipients do not interfere in the analysis. From these results, it is possible to conclude that the method developed is sufficiently accurate and precise to be applied to pharmaceutical formulations.
Acknowledgments
References
1. Richter, P.; Toral , M. I.; Vargas, F. M.; Analyst 1994, 119, 1371.
2. Zamarreno, M. D.; Méndez , J. H.; Pérez, A. S.; Anal. Chim. Acta1985, 176, 279.
3. Zuhri, A. Z. A.; Hannon, M.; Alkhalil, S. I.; Hasna, H.; Anal. Lett. 1988, 21, 1845.
4. Squella, J. A.; Zuñiga, L. A.; Lemus, I.; Núñez-Vergara, L. J.;
J. Assoc. Off. Anal. Chem. 1988, 71, 388.
5. Altinöz, S.; Özer, D.; Temizer, A.; Bayraktar, Y.; Anal. Lett.
1992, 25, 111.
6. Björefors, F.; Nyholm, L.; Anal. Chim. Acta1996, 325, 11. 7. Wehmeyer, K. R.; Wightman, R. M.; Anal. Chem. 1985, 57,
1989.
8. Bond, A. M.; Analyst1994, 119, R1.
9. Baldo, M. A.; Daniele, S.; Mazzocchin, G. A.; Electrochim. Acta1996, 41, 811.
10. Nyholm, L.; Björefors, F.; Anal. Chim. Acta1996, 327, 211. 11. Machado, S. A. S; Mazo, L. H.; Avaca, L. A.; J. Braz. Chem.
Soc. 1992, 3, 89.
12. Silva, S. M.; Alves, C. R.; Correia, A. N.; Martins, R. M.; Nobre, A. L. R.; Machado, S. A. S.; Mazo, L. H.; Avaca, L. A.;
Quim. Nova. 1998, 21, 78.
13. Squella, J. A.; Huerta, M.; Bollo, S.; Pessoa, H.; Núñez-Vergara, L. J.; J. Electroanal. Chem. 1997, 420, 63.
14. Bard, J. A.; Faukner, L. R.; Electrochemical Methods,
Funda-mentals and Applications; John Wiley & Sons: New York, 1980.
15. Daniele, S.; Bragato, C.; Argese, E.; Electrochem. Commun. 2000, 2, 399.
Received: October 19, 2002
Published on the web: March 21, 2003