www.nat-hazards-earth-syst-sci.net/11/1303/2011/ doi:10.5194/nhess-11-1303-2011
© Author(s) 2011. CC Attribution 3.0 License.
and Earth
System Sciences
Quantitative assessment of diffuse rock fall hazard along a cliff foot
D. Hantz
Institut des Sciences de la Terre (ISTerre), UMR 5275, CNRS – Universit´e Joseph Fourier, Grenoble, France Received: 1 November 2010 – Revised: 12 April 2011 – Accepted: 13 April 2011 – Published: 11 May 2011
Abstract.Many works have shown that the relation between rock fall frequency and volume is well fitted by a power law. Based on this relation, a new method is presented which al-lows estimating the fall frequency and probability for a wall section in a homogenous cliff, considering all possible rock fall volumes. The hazard for an element located at the foot of the cliff, with a minimal energy, is also estimated. The method has been applied to an itinerary, for which the human risk has also been estimated. Rock fall inventories featuring the location, date, and volume of the falls and the dimensions of the fallen compartments (width, length, and thickness) are needed for better estimating of hazard and risk.
1 Introduction and terminology
In this paper, the term “rock fall” is used in its usual sense, given for example by Cruden et al. (1996). A rock fall can result from a subsequent rock slide or rock topple. For the terms related to hazard and risk assessment, we use the def-initions recommended by the International Society of Soil Mechanics and Geotechnical Engineering (ISSMGE) Tech-nical Committee on Risk Assessment (Fell et al., 2005). Be-fore it occurs, a rock fall can be qualified as a potential dan-ger. The hazard is the probability (between 0 and 1) that it occurs within a given period of time, which may be es-timated in an objective or subjective way. The hazard can also be the probability of the magnitude of a given quan-tity (kinetic energy for example) to be reached. For land-use planning, the period of time which is considered is usually one century (MATE and METL, 1999). The risk is a mea-sure of the probability and the severity of an adverse effect to life, health, property, or the environment. It can be ex-pressed as the probability of an adverse event times the con-sequences if the event occurs. The elements at risk may be
Correspondence to:D. Hantz ([email protected])
population, buildings, infrastructure, environmental features, or economic activities.
The rock fall danger which is considered in this paper is the fact that a given element at risk is reached by a rock mass (consisting of one or several blocks). It results from two events: (a) the detachment of a rock mass from the rock wall due to a failure process; (b) the propagation of this rock mass down to the element at risk.
The rock fall hazard may be defined as the probability of a rock fall of a given magnitude (or kinetic energy) reaching the element at risk, which can be expressed as the probability of detachment (or failure probability) times the probability of the rock mass reaching the element given that it detaches from the rock wall (propagation probability).
The probability of detachment may concern a particular, well defined rock mass (located danger) or a part of the rock wall, from which a rock mass can detach anywhere (diffuse danger). In this paper, only the second case will be consid-ered.
2 Rock fall (failure) frequency
Considering a geological time scale, rock falls are repetitive events and represent one of the main erosion processes. At a human time scale and a particular rock wall spatial scale, only the smallest ones are sufficiently frequent for their fre-quency to be determined from an inventory. Indeed, the size of the spatial-temporal observation window is usually too small for the frequency of larger rock falls to be determined. But in some cases, the shortness of the observation period can be compensated by the extent of the observation area, should the area be sufficiently homogenous. This is the case for some calcareous cliffs, the structure and morphology of which are relatively constant on several kilometers or tens of kilometers. For example, the calcareous cliffs which consti-tute the west side of the large valley called “Sillon Subalpin” near Grenoble have a rectilinear shape, which indicates a uni-form rate of retreat and therefore a relatively homogenous behavior in terms of rock falls.
Many works have shown that the relation between rock fall frequency and volume is well fitted by a power law (for example, Dussauge-Peisser et al., 2002; general review by Picarelli et al., 2005). For a given rock wall, the number of rock falls per unit of time (frequency =F) with volume greater thanV (in m3)is given by:
F=αV−b (1)
whereα= number of rock falls, per unit of time, with volume greater than 1 m3; andb= another constant. The constantα
depends on the size of the considered area and of the geolog-ical and geomorphologgeolog-ical conditions. Concerning the con-stantb, a review by Dussauge-Peisser et al. (2002) and recent work by Dewez et al. (2009) have shownbvalues ranging between 0.4 and 0.7.
For the Grenoble calcarous cliffs (French Alps), the rock fall frequency has been estimated from an inventory car-ried out by a forest service (RTM 38) and completed by the Grenoble University. This inventory concerns rock falls of volume between 102 and 107m3, distributed on a wall area of 200 m in average height and 120 km in length. The obser-vation period considered was 65 yr for the volumes smaller than 105m3, and several centuries for larger volumes (Hantz et al., 2003b). The constantbwas estimated at 0.55 (±0.1) andαat 11 rock falls/yr (between 11×0.5 and 11×2). The volumetric erosion rate of the cliff can be obtained by inte-gration of Eq. (1) (Hantz et al., 2003a), and divided by the wall area to give the linear rate of retreat. The value obtained of 1.5 mm yr−1is compatible with the retreat of the Urgonian seam, which is around 10 km in 107yr. Assuming the rock fall frequency is constant with time, the mean age of the wall can be estimated to 5500 yr. This value is compatible with the first results obtained by cosmic ray surface exposure dat-ing, which give a mean age of 8000 yr (Hantz and Frayssines, 2007).
Fig. 1.Cylindrical slope with rock compartments having the same widthw.
The spatial temporal rock fall frequency (Fst)is the num-ber of rock falls per unit of time and per unit of wall area, with a volume greater than a given value V (in m3), ex-pressed by:
Fst=aV−b (2)
wherea= number of rock falls, per unit of time and area, with volume greater than 1 m3(a=α/wall area).
3 Failure frequency and failure probability in a homogenous rock wall
Let us consider a homogenous rectilinear wall the height of which ish, and define a horizontal abscissax, which is paral-lel to contour lines (Fig. 1). The underlying slope is supposed to be cylindrical. A rock mass falling from this wall in a sin-gle rock fall event will be called a rock compartment. We first assume that the falling compartments have a constant width,
w(defined parallel tox). For a profile of the wall to be af-fected by a rock fall, the centre of gravity of the potentially unstable rock compartment must have an abscissa between (x−w/2) and (x+w/2), i.e. it must be in a vertical wall slice the width of which isw(Fig. 1). This assumption neglects the lateral dispersion which always occurs for an actual rock fall, and then leads to underestimating the frequency. The frequency of the rock falls which affect any profile of the wall is thenFsthw. In the same way, the frequency of the rock falls of width w which affect a slice of the wall of width
visFsth(w+v).
constant anymore and is related to its volume. The rela-tion between the volume and the width of the falling com-partments depends on the internal structure of the rock wall. Frayssines and Hantz (2006) have analyzed the relationship between the width, the length (measured in the movement di-rection), and the thickness of compartments fallen from the calcareous cliffs of the Grenoble area. It appears that the length is about twice the width, which in turn is 4 times the thickness. In a general formulation, the relationship between the volume (V) and the width (w) of the fallen compartments may be written:
V=kw3 (3)
wherekis a shape factor, which equals 0.5 for the calcare-ous cliffs of the Grenoble area. Ifkis unknown, the author recommends using the value of 1.
For compartments the volume of which is betweenV and (V+dV), the fall frequency affecting a profile of the wall can be calculated as below, using Eqs. (2) and (3):
dF =hw|dFst| = −h V
k
1/3
daV−b (4)
=abhk−1/3V−b−2/3dV
The integration of Eq. (4) gives the frequency of the rock falls the volume of which is betweenVminandVmax:
Ff=
3abhk−13 3b−1
Vmin
1 3−b
−Vmax
1 3−b
(5) Note that, asb is higher than 1/3, the limit ofFf, as Vmin approaches 0, is infinite. This is not a problem because we always consider a minimal volume for the rock falls. On the contrary, the limit ofFf, asVmaxapproaches infinity, is not infinite. This allows taking into account the largest rock falls which can occur in the wall considered. The largest possible volume depends essentially on the height of the wall, but is very difficult to estimate. Fortunately, the exponent ofVmax in Eq. (5) is about 0.2 and, consequently, the frequency is not very sensitive to this parameter. It is also not sensitive to the parameterk, the exponent of which is 1/3. Assuming k can range between 0.4 and 2,k1/3varies between 0.74 and 1.26. Considering that the precision which can be hoped for the failure probability is by a factor 10, taking 1 for the value ofkappears to be acceptable.
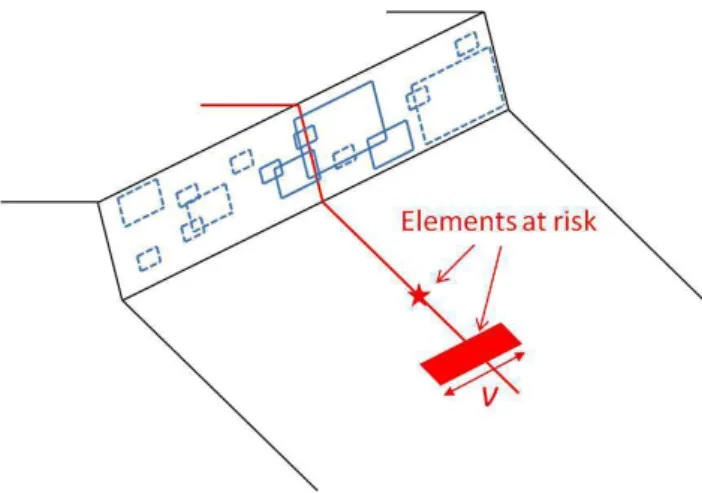
We now consider an element at risk, the width of which is
v. It can be seen in Figs. 1 and 2, that for the element to be affected by a rock fall of widthw, the centre of gravity of the potentially unstable rock compartment must be in a vertical wall slice, the width of which is (v+w). The fall frequency affecting this slice of wall can be obtained by substitutingw
by (v+w) in Eq. (4). Thus, the frequency is:
Ff=
3abhk−13 3b−1
Vmin
1 3−b
−Vmax
1 3−b
(6)
+ahvVmin−b−Vmax−b
Fig. 2. Cylindrical slope featuring both types of elements at risk (punctual and with a widthv) and rock compartments having dif-ferent widths. The compartments threatening the element at risk with widthvare in solid lines.
The problem of the temporal distribution of landslides has been discussed by Durville (2004). Rat (2006) has shown that the occurrence of rock falls on a road in the R´eunion Island is well described by the Poisson’s law, provided one considers time steps of more than 5 days. Assuming the Pois-son’s law to describe the temporal occurrence of rock falls, the probability for a slice of wall the width of which isv, to be affected by at least one rock fall during a period of timet
is:
Pf=1−e−Fft=1−e −Tt
f (7)
whereTf=1/Ffis the return period of the rock falls. If the period considered is small compared to the return periodTf, the failure probabilityPfcan be approximated by:
Pf=Fft=t /Tf (8) Note that the failure frequency and the failure probability given by Eqs. (6) and (7) are estimates of the hazard if the element at risk is close enough to the rock wall so that the probability of propagation equals 1.
4 Frequency and probability of reach by a fall with a minimal energy
We now consider an element at risk, the width of which is
which equals the failure frequency given by Eq. (6). More-over, it is assumed that the kinetic energyE of a compart-ment reaching the foot of the rock wall is given by its initial potential energy:
E=γ V h (9)
whereγ is the specific weight of the rock,V the volume of the compartment, andhits initial height, taking as a refer-ence the height the wall foot.
In the context of risk assessment, the events to consider are rock falls whose kinetic energy exceeds a given valueE0 when they reach the element at risk. This value depends on the type of element at risk. For example, the Swiss federal guidelines (Lateltin et al., 2005) consider that a reinforced concrete wall can resist to an impact energy of 300 kJ.
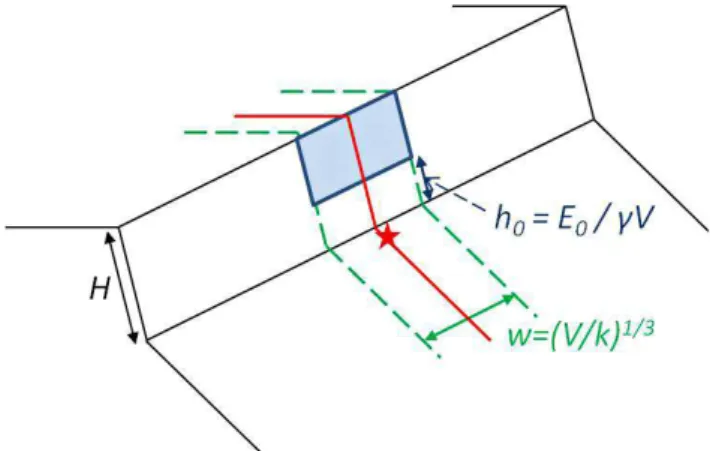
Let us first assume that the falling compartments have the same width (w) and consequently the same volume (V) ac-cording to Eq. (3). For a point located at the foot of the rock wall, at the abscissax, to be reached by a rock fall (the en-ergy of which is higher thanE0), the center of gravity of the falling mass must be initially located at an abscissa between (x−w/2) and (x+w/2), and at a height greater thanh0given by:
h0=min
H,E0 γ V
(10) whereH is the height of the rock wall (Fig. 3). The fre-quency for the point considered, with an energy higher than
E0, is then:
Fr(E0)=Fstw(H−h0) (11) Now considering compartments whose volume is between
V and (V+dV), the frequency for an element at risk whose width isv, with energy higher thanE0, is given by:
dFr=(w+v)(H−h0)dFst (12) This frequency cancels ifγ V his lower thanE0, i.e. ifV is lower thanE0/γ H. Then the integration of Eq. (12) must be done fromVmin=E0/γ H. The frequency which is obtained is lower than the failure frequencyFfgiven by Eq. (6):
Fr=Ff−
3abk−13E0
γ (3b+2)
Vmin−b− 2
3−Vmax−b− 2 3
(13)
− abvE0
γ (b+2)
Vmin−b−1−Vmax−b−1
with
Vmin=E0/γ H (14)
Note that the energy loss due to rebounds on the rock wall is not considered here. So Eq. (13) overestimates the fre-quency.
Assuming the occurrence of the rock falls is given by Pois-son’s law, the hazardPris given by the expression:
Pr=1−e−Frt=1−e− t
Tr (15)
Fig. 3.Cylindrical slope with a punctual element at risk (star). The solid rectangle represents the wall area to be considered for a rock volumeV to have a minimal potential energyE0. γ: the specific
weight of the rock;k: shape factor.
5 Discussion
5.1 Homogenous rock wall
The initial hypothesis of a homogenous rock wall may be oversimplified in some cases. If the failure frequency varies along the wall, it is the same for the hazard. In the case of a fix element at risk (a house for example), the hazard depends on its abscissax (Fig. 1). However, the method presented allows estimating the order of magnitude of the hazard in the cases where it is not possible to distinguish particularly hazardous sections of the wall.
When the element at risk is moving (a vehicle for exam-ple), the hazard during the time the risk element traverses the whole wall is not affected by thex variations of the failure frequency (the most hazardous sections are compensated by the least ones).
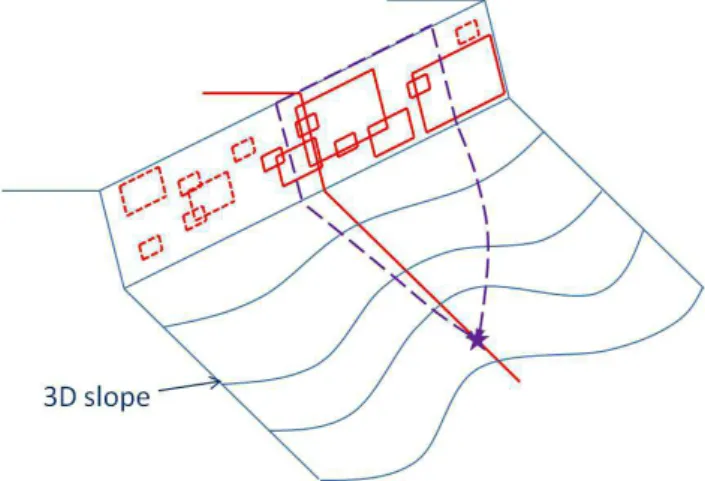
5.2 Cylindrical slope
Fig. 4.3-D slope with a punctual element at risk (star). The dashed line represents the area where a rock compartment must start to threaten the element at risk.
5.3 Fragmentation of the rock falls
The impact frequency given by Eq. (13) concerns rock falls with very different sizes, which can imply one or several blocks. For rock falls implying several blocks, the element at risk does not receive all the energy. This leads to an over-estimation of the hazard with a given energy. For a better es-timation, the individual block frequency rather that the rock fall frequency must be considered. A method to derive the block frequency from the rock fall event frequency is given by Corominas (2005), based on the analysis of the distribu-tion of block volumes on talus slopes. This kind of informa-tion should be very useful in the future rock fall inventories. Note that when the considered minimal energy is low (as in the following application), most of the rock falls considered are small and consist of single blocks.
6 Application to a hiking track at the foot of a cliff
6.1 Hazard assessment
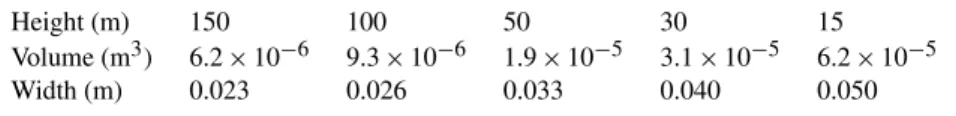
The method has been applied to the hiking track which stretches over 1 km along the base of the Saint-Eynard cal-careous cliff, near Grenoble (Fig. 5). The height of the cliff is about 150 m. The spatial temporal failure frequency is well described by Eq. (2), where the parameters a and b have been determined from an inventory concerning 120 km of cliff (Sect. 2). The width of the element at risk (hiker) was set to 0.5 m. The minimal energy considered (0.025 kJ) was de-rived from climbing helmet tests. To reach this energy level, the rock compartments detaching from the top of the cliff must have a minimal volume of 6×10⁻⁶m3(Sect. 4), which corresponds to a width of 2.3 cm (Eq. 3). This minimal vol-ume increases when the detachment point moves down the wall, as shown in Table 1. It was assumed that Eq. (2) applies
Fig. 5.Saint-Eynard calcareous cliff, near Grenoble.
to rock volumes as small as 10−6m3, as expected from the results obtained by Dewez et al. (2009). These authors have observed rock falls with volumes from 10−4to 10+4m3in a chalk cliff, and have obtained abvalue of 0.51 very close to the value of 0.55 (±0.1) obtained for the limestone cliffs in the Grenoble area for volumes ranging from 102to 107m3. This suggests that for calcareous rocks, the power law could be valid for a very large volume range. A sensitivity analysis has been achieved taking account of the uncertainty affecting the parametersaandb. The impact frequencies with a min-imal energy of 0.025 kJ have been calculated using Eq. (13) and are given in Table 2.
According to the uncertainties affecting a and b, the fre-quency was determined with an uncertainty factor of 10. The central value is 2.3×10⁻²events per year, which gives a re-turn period of 44 yr.
It has been mentioned in Sect. 3 that the frequency is not very sensitive to the value estimated for the maximal possible rock fall volume. This statement is confirmed in the case presented: The 2-digit values given in Table 2 are valuable for any maximal volume larger than 100 m3. In the present case, the maximal possible rock fall volume was obviously larger than 100 m3. It can also be seen from Eq. (5) that the smaller the minimal volume considered, the lower the contribution of the largest volumes.
6.2 Risk assessment
Table 1. Minimal volume and corresponding width to consider for a rock compartment reaching a wall foot with a minimal kinetic energy of 0.025 kJ, as a function of the detachment height.
Height (m) 150 100 50 30 15
Volume (m3) 6.2×10⁻⁶ 9.3×10⁻⁶ 1.9×10⁻⁵ 3.1×10⁻⁵ 6.2×10⁻⁵
Width (m) 0.023 0.026 0.033 0.040 0.050
Table 2.Impact frequency (event per year) with a minimal kinetic energy of 0.025 kJ, of an element at risk of width 0.5 m, located at the foot of the 150 m high Saint-Eynard rock cliff.
a(10−7fall/yr m2) 2.3 4.7 9.4
b= 0.45 3.8×10⁻³ 7.7×10⁻³ 1.5×10⁻²
b= 0.55 1.1×10⁻² 2.3×10⁻² 4.5×10⁻²
b= 0.65 3.5×10⁻² 7.1×10⁻² 1.4×10⁻¹
in different countries are reported by Leroi et al. (2005). The individual risk of about 10−6corresponds to the broadly ac-ceptable limit given by the Health and Safety Executive (UK) for land use planning around industries. As higher risks are usually accepted from naturally occurring landslides than from engineered slopes, and as the hazard had been overesti-mated (Sect. 5), this risk can be considered as acceptable.
In terms of societal risk, considering that about one thou-sand hikers take this trail each year, the expected annual number of deaths is about 10−3. From the knowledge of the author, no death has occurred on this trail, which had been taken by hikers for several decades before it was closed after two rock falls of some tens of m3occurred in 2003 and 2006. Leroi et al. (2005) have reviewed published societal life risk criteria. HKSAR (Hong Kong Special Administrative Re-gion) has published interim risk guidelines especially for nat-ural slopes. The societal risk of about 10−3 corresponds to their limit between the unacceptable risk and the tolerable risk. As the hazard had been been overestimated (Sect. 5), it can be considered as tolerable by society. That said, ac-cording to IUGS (1997), a tolerable risk should, wherever reasonably practicable, be reduced.
7 Conclusions
The method presented allows estimating the hazard and im-pact frequency at the foot of a homogenous cliff, with an uncertainty factor of 10, from a historical rock fall inventory. If the cliff is not homogenous, the obtained frequency rep-resents only an average value along a contour line. In this case the actual frequency for a fix element at risk may greatly differ from this value. If the slope under consideration differs significantly from a cylindrical slope, the obtained
frequency also represents an average value along a contour line. However, in both cases of non-homogenous walls and non-cylindrical slopes, the obtained frequency is pertinent for a moving element at risk (pedestrian or vehicle).
The method proposed to determine the rockfall frequency with a minimal energy leads to an overestimation of the haz-ard. Individual block frequency rather than rock fall fre-quency must be considered for a better estimation.
Hazard and risk have been estimated for the Saint-Eynard cliff. With the available data, the individual risk can be con-sidered as acceptable, and the societal risk as tolerable.
Rock fall inventories at different spatial and temporal scales featuring the location, date, volume of the falls, and the dimensions of the fallen compartments (width, length, and thickness), together with a better knowledge of the rate of retreat of the rock walls, are needed for better estimating of hazard and risk.
Edited by: O. Katz
Reviewed by: J. Corominas and L. Franzi
The publication of this article is financed by CNRS-INSU.
References
Abbruzzese, J. M., Sauthier, C., and Labiouse, V.: Considerations on Swiss methodologies for rock fall hazard mapping based on trajectory modelling, Nat. Hazards Earth Syst. Sci., 9, 1095– 1109, doi:10.5194/nhess-9-1095-2009, 2009.
Agliardi, F., Crosta, G. B., and Frattini, P.: Integrating rock-fall risk assessment and countermeasure design by 3-D mod-elling techniques, Nat. Hazards Earth Syst. Sci., 9, 1059–1073, doi:10.5194/nhess-9-1059-2009, 2009.
Corominas, J., Copons, R., Moya, J., Vilaplana, J. M., Altimir, J., and Amigo, J.: Quantitative assessment of the residual risk in a rockfall protected area, Landslides, 2, 343–357, 2005.
Report, National Academy Press, Washington, DC, 247, 36–75, 1996.
Dewez, T., Chamblas, G., Lasseur, E., and Vandromme, R.: Five seasons of chalk cliff face erosion monitored by terrestrial laser scanner: from quantitative description to rock fall probabilistic hazard assessment, Geophysical Research Abstracts, 11, 2009– 8218, 2009.
Durville, J.-L.: Quelques remarques sur l’emploi des probabilit´es dans le domaine des risques naturels, cas des mouvements de terrain, Bull. Laboratoires Ponts etChauss´ees, 249, 3–17, 2004. Dussauge-Peisser, C., Helmstetter, A., Grasso, J.-R., Hantz, D.,
Desvarreux, P., Jeannin, M., and Giraud, A.: Probabilistic approach to rock fall hazard assessment: potential of histor-ical data analysis, Nat. Hazards Earth Syst. Sci., 2, 15–26, doi:10.5194/nhess-2-15-2002, 2002.
Effendiantz, L., Guillemin, P., Rochet, L., Pauly, J-C., and Payany, M.: Les ´etudes sp´ecifiques d’al´ea li´e aux ´eboulements rocheux, Laboratoire Central des Ponts et Chauss´ees, Paris, 2004. Fell, R., Ho, K. K. S., Lacasse, S., and Leroi, E.: A framework for
landslide risk assessment and management, in: Landslide Risk Management, edited by: Hungr, O., Fell, R., Couture, R., and Eberhardt, E., Taylor & Francis Group, London, 3–25, 2005. Frayssines, M. and Hantz, D.: Failure mechanisms and
trigger-ing factors in calcareous cliffs of the Subalpine Ranges (French Alps), Eng. Geol., 86, 256–270, 2006.
Groupe Falaises: Pr´evention des mouvements de versants et des instabilit´es de falaises – Confrontation des m´ethodes d’´etude des ´eboulements rocheux dans l’arc alpin, Programme Interreg 2C, 2001.
Guzzetti, F., Crosta G., Detti, R., and Agliardi, F.: STONE: a com-puter program for the three-dimensional simulation of rock-falls, Comput. Geosci., 28, 1079–1093, 2002.
Hantz, D. and Frayssines, M.: Contribution `a l’´evaluation de la dur´ee de vie d’un compartiment rocheux susceptible de s’´ebouler, Revue Franc¸aise de G´eotechnique, 119, 65–79, 2007. Hantz, D. and Frayssines, M.: Rock wall retreat and historical back analysis of failures in Alpine limestone cliffs, in: Landslide pro-cesses: from geomorphologic mapping to dynamic modelling, Strasbourg, 2009.
Hantz, D., Dussauge-Peisser, C., Jeannin, M., and Vengeon, J.-M.: Rock fall hazard assessment: from qualitative to quantitative fail-ure probability, in: Int. conf. on Fast Slope Movements, Naples, 263–267, 2003a.
Hantz, D., Vengeon, J. M., and Dussauge-Peisser, C.: An his-torical, geomechanical and probabilistic approach to rock-fall hazard assessment, Nat. Hazards Earth Syst. Sci., 3, 693–701, doi:10.5194/nhess-3-693-2003, 2003b.
Hungr, O., Evans, S. G., and Hazzard, J.: Magnitude and frequency of rock falls and rock slides along the main corridors of south-western British Columbia, Can. Geotech. J., 36, 224–238, 1999. IUGS working group on landslides, committee on risk assessment: Quantitative risk assessment for slopes and landslides – the state of the art, in: Landslide risk assessment, edited by: Cruden, D. M. and Fell, R., Balkema, Rotterdam, 3–14, 1997.
Jaboyedoff, M., Dudt, J. P., and Labiouse, V.: An attempt to refine rockfall hazard zoning based on the kinetic energy, frequency and fragmentation degree, Nat. Hazards Earth Syst. Sci., 5, 621–632, doi:10.5194/nhess-5-621-2005, 2005.
Lateltin, O., Haemmig, C., Raetzo, H., and Bonnard, C.: Landslide risk management in Switzerland, Landslides, 2, 313–320, 2005. Leroi, E., Bonnard, C., Fell, R., and McInnes, R.: Risk assessment
and management, in: Landslide Risk Management, edited by: Hungr, O., Fell, R., Couture, R., and Eberhardt, E., Taylor & Francis Group, London, 159–198, 2005.
MATE (Minist`ere de l’Am´enagement du Territoire et de l’Environnement), METL (Minist`ere de l’Equipement des Trans-ports et du Logement): Plans de pr´evention des risques naturels, Risques de mouvements de terrain, Guide m´ethodologique, La Documentation Franc¸aise, 1999.
Picarelli, L., Oboni, F., Evans, S. G., Mostyn, G., and Fell, R.: Hazard characterization and quantification, in: Landslide Risk Management, edited by: Hungr, O., Fell, R., Couture, R., and Eberhardt, E., Taylor & Francis Group, London, 27–61, 2005. Rat, M.: Optimisation de la gestion de la route du littoral `a La
R´eunion vis-`a-vis du risque de chutes de blocs, Bull. Labora-toires Ponts & Chauss´ees, 263–264, 43–52, 2006.
Vengeon, J. M., Hantz, D., and Dussauge, C.: Pr´edictibilit´e