Genome Wide Association Studies for Milk Production
Traits in Chinese Holstein Population
Li Jiang., Jianfeng Liu., Dongxiao Sun., Peipei Ma, Xiangdong Ding, Ying Yu, Qin Zhang*
Key Laboratory of Animal Genetics and Breeding of the Ministry of Agriculture, College of Animal Science and Technology, China Agricultural University, Beijing, People’s Republic of China
Abstract
Genome-wide association studies (GWAS) based on high throughput SNP genotyping technologies open a broad avenue for exploring genes associated with milk production traits in dairy cattle. Motivated by pinpointing novel quantitative trait nucleotide (QTN) across Bos Taurus genome, the present study is to perform GWAS to identify genes affecting milk production traits using current state-of-the-art SNP genotyping technology, i.e., the Illumina BovineSNP50 BeadChip. In the analyses, the five most commonly evaluated milk production traits are involved, including milk yield (MY), milk fat yield (FY), milk protein yield (PY), milk fat percentage (FP) and milk protein percentage (PP). Estimated breeding values (EBVs) of 2,093 daughters from 14 paternal half-sib families are considered as phenotypes within the framework of a daughter design. Association tests between each trait and the 54K SNPs are achieved via two different analysis approaches, a paternal transmission disequilibrium test (TDT)-based approach (L1-TDT) and a mixed model based regression analysis (MMRA). In total, 105 SNPs were detected to be significantly associated genome-wise with one or multiple milk production traits. Of the 105 SNPs, 38 were commonly detected by both methods, while four and 63 were solely detected by L1-TDT and MMRA, respectively. The majority (86 out of 105) of the significant SNPs is located within the reported QTL regions and some are within or close to the reported candidate genes. In particular, two SNPs, ARS-BFGL-NGS-4939 and BFGL-NGS-118998, are located close to theDGAT1gene (160bp apart) and within theGHRgene, respectively. Our findings herein not only provide confirmatory evidences for previously findings, but also explore a suite of novel SNPs associated with milk production traits, and thus form a solid basis for eventually unraveling the causal mutations for milk production traits in dairy cattle.
Citation:Jiang L, Liu J, Sun D, Ma P, Ding X, et al. (2010) Genome Wide Association Studies for Milk Production Traits in Chinese Holstein Population. PLoS ONE 5(10): e13661. doi:10.1371/journal.pone.0013661
Editor:Thomas Mailund, Aarhus University, Denmark
ReceivedJuly 21, 2010;AcceptedOctober 4, 2010;PublishedOctober 27, 2010
Copyright:ß2010 Jiang et al. This is an open-access article distributed under the terms of the Creative Commons Attribution License, which permits unrestricted use, distribution, and reproduction in any medium, provided the original author and source are credited.
Funding:This work was supported by the State High-Tech Development Plan of China (Grant No. 2008AA101002), the National Natural Science Foundations of China (Grant No. 30972092,30800776), the National Key Basic Research Program of China (Grant No. 2006CB102104), and the Graduate R&D Innovation Project of China Agricultural University. The funders had no role in study design, data collection and analysis, decision to publish, or preparation of the manuscript.
Competing Interests:The authors have declared that no competing interests exist.
* E-mail: [email protected]
.These authors contributed equally to this work.
Introduction
Over the last decades, advances in DNA-based marker technology make it possible to identify genome regions (namely quantitative trait loci, QTL) underlying complex traits such as milk yield in dairy cattle. Instead of traditional animal breeding programmes solely relying on phenotype and pedigree informa-tion, the incorporation of detected QTL into genetic evaluation provides a great potential to enhance selection accuracies, hence expediting the genetic improvement of animal productivity.
In dairy cattle, since the seminal work on QTL mapping by Georges el al [1], a large number of articles have been published concerning detection of QTLs for milk production traits. So far a total number of 1,137 QTL for milk production traits have been reported via genome scan based on marker-QTL linkage analyses (http://www.animalgenome.org/QTLdb/cattle.html, May 22, 2010). The limitations of QTL mapping using linkage analysis (LA) and/or linkage disequilibrium (LD) [2] based on panels of low to moderate density markers have been well documented previously [3,4]. In the past decades merely few strong candidate genes with potential effects on milk production traits, i.e., the DGAT1gene [5] and theGHRgene [6], have been identified and/
or functionally confirmed from those findings derived from QTL linkage analyses and fine mapping studies.
Motivated by searching for novel casual variants for milk production traits beyond previous findings via traditional linkage studies, the present study is to perform GWAS to detect potential casual genetic variants for milk production traits, using the Illumina BovineSNP50 BeadChip. The identified SNP loci may be considered as preliminary foundation for further replication studies and eventually unraveling the causal mutations for milk production traits in dairy cattle.
Materials and Methods
The blood samples were collected along with the regular quarantine inspection of the farms, so no ethical approval was required for this study.
Animal resource
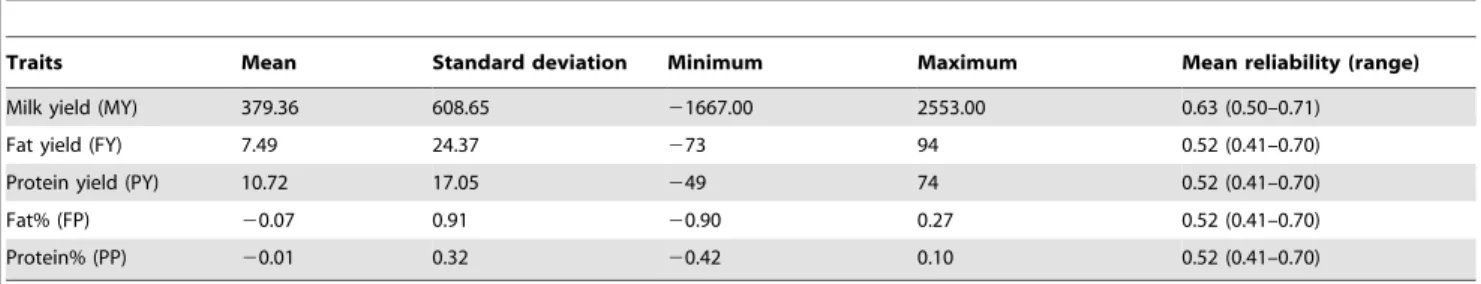
A daughter design was employed in this study. In total 2,093 daughters as well as their 14 corresponding sires were collected to construct the study population. The numbers of daughters of the 14 sires range from 83 to 358 daughters with an average of 150. These daughters were from 15 Holstein cattle farms in Beijing, China, where regular and standard performance testing (dairy herd improvement, DHI) has been conducted since 1999. The official up to date estimated breeding values (EBVs) of five milk production traits, including milk yield (MY), fat yield (FY), protein yield (PY), fat percentage (FP), and protein percentage (PP) were used as phenotypes in this study. These EBVs were obtained based on a multiple trait random regression test-day model [23] using the software RUNGE provided by Canadian Dairy Network (CDN) (http://www.cdn.ca). The descriptive statistics of these EBVs for the five traits as well as the average reliabilities of EBVs of the 2,093 daughters are presented in Table 1. It is notable that the program RUNGE gave two sets of accuracies of EBVs for the five milk production traits. One is for milk yield (MY) and the other for the four milk content traits (FY, PY, FP, and PP). This is because that the amount of information used for calculating EBVs was different for MY and for the 4 milk content traits, while all of the 4 milk content traits provided the same amount of information for calculating EBVs.
Genotyping
DNA was extracted from blood sample of the daughters and semen sample of the sires using the routine procedures. DNA was quantified and genotyped using the Illumina BovineSNP50 BeadChip containing 54001 SNPs, which is a multi-sample genotyping panel powered by Illumina’s InfiniumH II Assay. Features of the Illumina BovineSNP50 BeadChip have been detailed previously [24]. All samples were genotyped using BEADSTUDIO (Illumina) and a custom cluster file developed from the 2180 samples.
Table 1.Descriptive statistics of EBVs and the accuracy of five milk production traits for 2,093 daughters.
Traits Mean Standard deviation Minimum Maximum Mean reliability (range)
Milk yield (MY) 379.36 608.65 21667.00 2553.00 0.63 (0.50–0.71)
Fat yield (FY) 7.49 24.37 273 94 0.52 (0.41–0.70)
Protein yield (PY) 10.72 17.05 249 74 0.52 (0.41–0.70)
Fat% (FP) 20.07 0.91 20.90 0.27 0.52 (0.41–0.70)
Protein% (PP) 20.01 0.32 20.42 0.10 0.52 (0.41–0.70)
doi:10.1371/journal.pone.0013661.t001
Table 2.Distributions of SNPs after quality control and the average distances between adjacent SNPs on each
chromosome.
BTA No. SNPs Average distance (kb)a
1 2485 65
2 2033 69
3 1966 65
4 1869 66
5 1607 78
6 1913 64
7 1711 65
8 1797 65
9 1499 72
10 1586 67
11 1699 65
12 1233 69
13 1318 64
14 1309 62
15 1265 67
16 1180 66
17 1201 64
18 1039 64
19 1068 61
20 1205 63
21 1053 66
22 939 66
23 838 63
24 946 69
25 769 57
26 774 67
27 730 67
28 719 64
29 794 65
X 497 179
0b 1178
TOTAL 40220
aDerived from the most recent bovine genome sequence assembly (Btau_4.0) (http://www.ncbi.nlm.nih.gov/genome/guide/cow/)
Genotype quality control
To assess the technical reliability of the genotyping panel, a randomly selected DNA sample was genotyped twice and over 99% identity of called genotypes (two mismatches) was obtained. This demonstrates the technically robust feature of the 50K SNP BeadChip panel employed herein.
The quality control procedure can be largely split into two categories, including individual exclusion and SNP removal, as follows:
Firstly, an individual would be excluded from the analyses if it had more than 10% missing genotypes or its SNP genotypes had a Mendelian error rate above 2%. For the second criterion, for each sire-daughter pair, we randomly choose 10,000 genotyped SNP loci for which both the sire and the daughter are homozygotes. A Mendelian error happens herein if the two homozygotes are different in the context that the maternal genotype is unavailable. Accordingly, if more than 200 out of 10,000 SNP have Mendelian errors, the daughter will be removed from the sample.
Secondly, a SNP would be removed if (1) its call rate was less than 90%, or (2) its minor allele frequency (MAF) was less than 3%, or (3) it was severely depart from Hardy Weinberg Equilibrium (HWE) with a P value lower than 1026, or (4) its minor genotype frequency was less than five individuals.
After the quality control procedures, 73 daughters with.10% missing genotypes and 205 daughters with Mendelian error rate above 2% were excluded, leading to 1,815 daughters remaining for the association analysis. On the other hand, we removed 1,218 SNPs with ,90% genotype call rate, 11,008 SNPs with a MAF ,0.03, 482 SNPs with extreme value of HWE statistics (P,10206), and 1,073 SNPs with minor genotype frequency,5 individuals. Eventually, 40,220 SNPs (74.5%) passed these quality control filters. The distribution of the remaining SNPs after filtering and the average distances between adjacent SNPs on each chromo-some are given in Table 2. In addition, for the L1-TDT analyses, we excluded extra 1,057 SNPs for which all paternal genotypes are homozygotes, and 39,163 SNPs were finally utilized.
Statistical analyses
Two methods are adopted to perform GWAS in our studies as follows:
TDT-based single locus regression analyses (L1-TDT). L1-TDT is a L1-TDT-based association procedure [25], which is specifically suitable for the situation where only a single parent instead of both parents are genotyped for TDT analyses. As merely the genotypes of bulls and their daughters are available within the framework of a daughter design, we employed it to explore the existence of associations between phenotypes and SNP allele transmissions from bulls to their daughters within sire families. Under such circumstance, a phenotypic observation,i.e., EBV considered herein, can be modeled by a SNP effect within family due to transmission disequilibrium of the SNP alleles as well as the effect of the sire corresponding to each half-sib family. For each milk production trait, the equation of the model is given as follows:
yij~mzsizb:TDSijzeij ð1Þ
whereyijis the EBV of thejthdaughter of sirei,mis the overall mean,si
is the fixed effect of sirei,TDSijis an indicator variable with a value21,
0 or 1 to indicate the transmission of a specific SNP allele from sireito his jth daughter, which is determined according to [26], b is the regression coefficient (or the substitution effect of the SNP), andeijis the
residual error. For each SNP,b is estimated via a weighted least squares analysis with the weights equal to 1/RELij, whereRELijis the
reliability of the EBV of daughterjin familyi. The association between the SNP and the trait is tested via theF-test.
Mixed model based single locus regression analyses (MMRA). Similar to the studies of [21] and [22], we performed association test for each SNP via regression analysis based on the following linear mixed model:
y~1mzbxzZaze ð2Þ
whereyis the vector of EBVs of all daughters,bis the regression coefficient of EBV on SNP genotypes,xis the vector of the SNP genotype indicators which takes values 0, 1 or 2 corresponding to the three genotypes 11, 12 and 22 (assuming 2 is the allele with a minor frequency),ais the vector of the residual polygenetic effects witha*N(0,As2a) (where A is the additive genetic relationship matrix and s2
a is the additive variance, and e is the vector of residual errors withe*N(0,Ws2e)(whereWis a diagonal matrix with the diagonal elements equal to 1/RELijands2eis the residual error variance). For each SNP, the estimate of b and the corresponding sampling variance Var(^bb) can be obtained via mixed model equations (MME), and a Wald chi-squared statistic ^
b
b2=Var(^bb)withdf= 1 is constructed to examine whether the SNP is associated with the trait.
We employed Fortran 95 to code the computing programs for L1-TDT and MMRA and they are available upon request.
Statistical Inference
For both analyses, the Bonferroni method was adopted to adjust for multiple testing from the number of SNP loci detected. We declared a significant SNP at the genome-wise significance level if a rawPvalue,0.05/N, hereNis the number of SNP loci tested in analyses.
Population stratification assessment
Confounding due to population stratification has been consid-ered as a major plague to the validity of genetic association studies
Figure 1. Genome-wide plots of2log10(p-values) for association of SNP loci with five milk production traits in sequential order. Chromosomes 1–29 and X are shown separated by color. Fig. 1-a1, 1-a2, 1-a3, 1-a4 and 1-a5 refer to plots generated by L1-TDT for MY, FY, PY, FP and PP, respectively. Fig. 1-b1, 1-b2, 1-b3, 1-b4 and 1-b5 refer to plots generated by MMRA for MY, FY, PY, FP and PP, respectively. The corresponding horizontal lines indicate the genome-wise significance levels (2log10(1.2861026) for L1-TDT and2log10(1.2461026) for MMRA).
doi:10.1371/journal.pone.0013661.g001
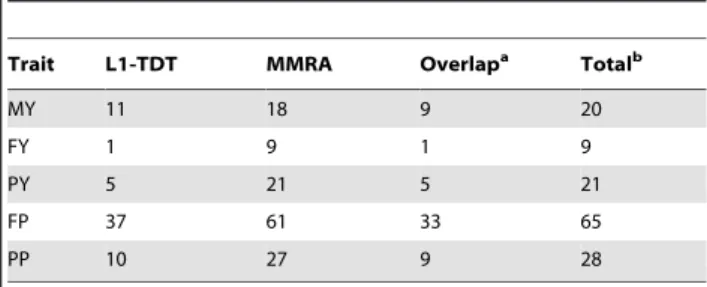
Table 3.Numbers of significant SNPs detected by L1-TDT and MMRA.
Trait L1-TDT MMRA Overlapa Totalb
MY 11 18 9 20
FY 1 9 1 9
PY 5 21 5 21
FP 37 61 33 65
PP 10 27 9 28
[27]. To view if the population stratification exists in our experimental population, we examined the distribution of the test statistics obtained from the numerous association tests performed and assessed their deviation from the expected distribution of no SNP being associated with the trait of interest utilizing a quantile-quantile (Q-Q) plot, which is a routine and most frequently used tool for scrutinizing the population stratification in GWAS. Since merely MMRA method is not immune to potential population
stratification, ‘‘Q-Q’’ plots for the test statistics of MMRA were conducted for the five traits.
Results
Significant SNPs
The profiles ofPvalues (in terms of2log(p)) of all tested SNPs for the five investigated traits are shown in Fig. 1. The numbers of
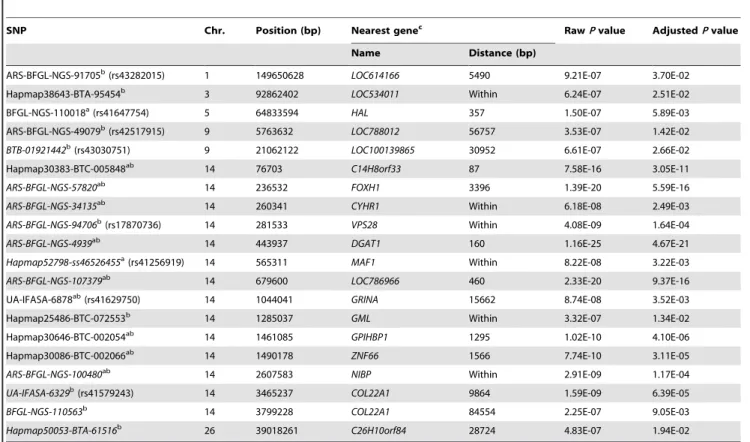
Table 4.Genome-wise significant (p,0.05) SNPs for milk yield (MY).
SNP Chr. Position (bp) Nearest genec RawPvalue AdjustedPvalue
Name Distance (bp)
ARS-BFGL-NGS-91705b(rs43282015) 1 149650628
LOC614166 5490 9.21E-07 3.70E-02
Hapmap38643-BTA-95454b 3 92862402 LOC534011 Within 6.24E-07 2.51E-02
BFGL-NGS-110018a(rs41647754) 5 64833594 HAL 357 1.50E-07 5.89E-03
ARS-BFGL-NGS-49079b(rs42517915) 9 5763632
LOC788012 56757 3.53E-07 1.42E-02
BTB-01921442b(rs43030751) 9 21062122 LOC100139865 30952 6.61E-07 2.66E-02
Hapmap30383-BTC-005848ab 14 76703 C14H8orf33 87 7.58E-16 3.05E-11
ARS-BFGL-NGS-57820ab 14 236532 FOXH1 3396 1.39E-20 5.59E-16
ARS-BFGL-NGS-34135ab 14 260341 CYHR1 Within 6.18E-08 2.49E-03
ARS-BFGL-NGS-94706b(rs17870736) 14 281533 VPS28 Within 4.08E-09 1.64E-04
ARS-BFGL-NGS-4939ab 14 443937 DGAT1 160 1.16E-25 4.67E-21
Hapmap52798-ss46526455a(rs41256919) 14 565311 MAF1 Within 8.22E-08 3.22E-03
ARS-BFGL-NGS-107379ab 14 679600 LOC786966 460 2.33E-20 9.37E-16
UA-IFASA-6878ab(rs41629750) 14 1044041 GRINA 15662 8.74E-08 3.52E-03
Hapmap25486-BTC-072553b 14 1285037
GML Within 3.32E-07 1.34E-02
Hapmap30646-BTC-002054ab 14 1461085 GPIHBP1 1295 1.02E-10 4.10E-06
Hapmap30086-BTC-002066ab 14 1490178 ZNF66 1566 7.74E-10 3.11E-05
ARS-BFGL-NGS-100480ab 14 2607583 NIBP Within 2.91E-09 1.17E-04
UA-IFASA-6329b(rs41579243) 14 3465237 COL22A1 9864 1.59E-09 6.39E-05
BFGL-NGS-110563b 14 3799228 COL22A1 84554 2.25E-07 9.05E-03
Hapmap50053-BTA-61516b 26 39018261 C26H10orf84 28724 4.83E-07 1.94E-02
Note: SNPs with a superscript ‘‘a’’ are detected by L1-TDT only, SNPS with a superscript ‘‘b’’ are detected by MMRA only, SNPs with a superscript ‘‘ab’’ are detected by both L1-TDT and MMRA, and SNPs in italic are located within the QTL regions reported previously. Names in parentheses are standard RRS/RS names in the NCBI database (http://www.ncbi.nlm.nih.gov).
cThe nearest known gene to the significant SNP. doi:10.1371/journal.pone.0013661.t004
Table 5.Genome-wise significant (p,0.05) SNPs with fat yield (FY).
SNP Chr. Position (bp) Nearest gene RawPvalue AdjustedPvalue
Name Distance (bp)
Hapmap57440-rs29017368b(rs29017368) 5 62242550 LOC515967 2419 2.22E-07 8.93E-03
Hapmap40191-BTA-73919b(rs41648982) 5 76882812 LOC511240 69845 8.10E-07 3.26E-02
Hapmap30381-BTC-005750b 14 50872 C14H8orf33 23701 1.14E-06 4.59E-02
ARS-BFGL-NGS-57820b 14 236532 FOXH1 3396 1.23E-10 4.95E-06
ARS-BFGL-NGS-34135b 14 260341 CYHR1 Within 1.29E-11 5.19E-07
ARS-BFGL-NGS-94706ab(rs17870736) 14 281533 VPS28 Within 8.93E-07 3.50E-02
ARS-BFGL-NGS-4939b 14 443937 DGAT1 160 1.01E-14 4.06E-10
ARS-BFGL-NGS-107379b 14 679600 LOC786966 460 1.47E-09 5.91E-05
BTA-90435-no-rsb(rs41664719) X 70532837 LOC516454 285289 3.35E-07 1.35E-02
Note: See note to Table 4.
genome-wise significant SNPs detected by L1-TDT or MMRA for the five traits are presented in Table 3. In total, the numbers of significant SNPs detected by either L1-TDT or MMRA for the five traits are 20, 9, 21, 65 and 28, respectively. Since some of these SNPs are associated with more than one trait, the total number of distinct identified SNPs is 105. Of these 105 SNPs, 38 were commonly detected by both methods, while four and 63 were solely detected by L1-TDT and MMRA, respectively. With exception of only four SNPs, all SNPs detected by L1-TDT were also detected by MMRA. The details of these significant SNPs for the five traits, including their positions in the genome, the nearest known genes and the rawPvalues, are given in Tables 4 through 8, respectively, and further described as follows.
Milk Yield (MY). As seen from Table 4, 14 out of 20 SNPs are located within a 3.63 Mb segment (between 0.07 and 3.7 Mb) on BTA 14. Ten of them fall into the regions that have been reported to harbor QTL for MY [5,21,28,29,30,31,32]. Furthermore, 6 of these SNPs are harbored within the regions of known genes, and the others are located 87 to 84,554 bp away from the nearest known genes.
Fat Yield (FY). As presented in Table 5, 6 out of 9 SNPs are clustered within a 0.55 Mb segment (between 0.05 and 0.6 Mb) on BTA 14. Eight out of them fall in the regions which have been reported to harbor QTL for FY previously [5,28,31,33,34,35]. Furthermore, two of these SNPs fall within the regions of known genes, and the others are located 160 to 285,289 bp away from the nearest known genes.
Protein Yield (PY). As shown in Table 6, among these 21 SNPs, 7 out of them are located within a 3.33 Mb segment
(between 0.07 to 3.4 Mb) on BTA 14. Further, 14 out of these SNPs are within the QTL regions for PY reported in previous studies [5,21,28,33,36,37,38,39]; 5 of them are located within the regions of known genes, and the others are located 87 to 385,764 bp away from the nearest known genes.
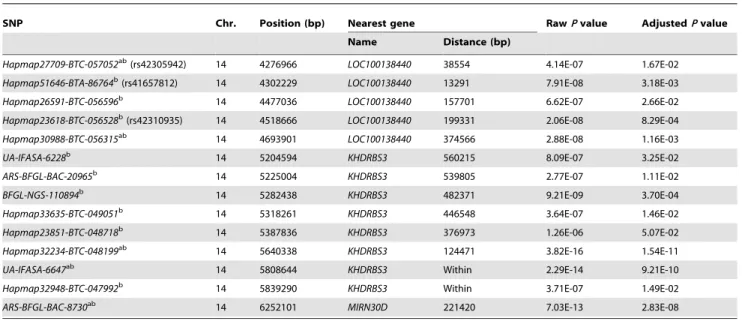
Fat Percentage (FP). From Table 7, 60 are located within a 6.2 Mb segment (between 0.05 to 6.25 Mb) on BTA 14. 53 of them are located within the QTL regions for FP reported in previous studies [5,34,39,40,41,42,43,44]. Further, 27 of the 65 detected SNPs are located within the regions of known genes, and the others are 71 to 560,215 bp away from the nearest known genes.
Protein Percentage (PP). As given by Table 8, out of 28 identified SNPs, there are 4, 7, and 14 SNPs located within a 8.0 Mb segment (between 33.9 to 41.9 Mb) on BTA6, a 2.59 Mb segment (between 0.23 to 2.82 Mb) on BTA14, and a 7.9 Mb segment (between 34.0 to 41.9 Mb) on BTA20, respectively. Among these 28 SNPs, 17 are located within the QTL regions for PP identified in previous studies [5,28,29,34,42,45]. Further, 11 of these 28 SNPs are located within the regions of known genes, and the others are 160 to 401,634 bp away from the nearest known genes.
Population stratification assessment
The ‘‘Q-Q’’ plots for the test statistics of MMRA are shown in Fig. 2-1 to 2-5. From these plots, it is apparent that the distributions of the x2 statistics generated from the association tests across the SNPs tested show no evidence of overall systematic bias. That is, the observedx2
statistics of the significant SNPs are
Table 6.Genome-wise significant (p,0.05) SNPs with protein yield (PY).
SNP Chr. Position (bp) Nearest gene RawPvalue AdjustedPvalue
Name Distance (bp)
BTA-55340-no-rsb(rs41586699) 1 145954149 PDE9A Within 9.72E-07 3.91E-02
BFGL-NGS-113002b 1 149153073 DIP2A Within 4.56E-07 1.83E-02
ARS-BFGL-NGS-91705b(rs43282015) 1 149650628 LOC614166 5490 3.57E-09 1.44E-04
ARS-BFGL-NGS-98387b 1 154783580 ETS2 169745 4.93E-07 1.98E-02
INRA-701b(rs41589462) 3 33837442 LOC539739 Within 7.75E-07 3.12E-02
BFGL-NGS-115461b 3 45261895 SLC30A7 7306 8.47E-07 3.41E-02
Hapmap58769-rs29025951b(rs29025951) 3 47803786 LOC100138725 219493 3.11E-07 1.25E-02
ARS-BFGL-NGS-4358b 3 50781421 LOC781902 385764 3.04E-07 1.22E-02
Hapmap38643-BTA-95454b 3 92862402 LOC534011 Within 3.77E-07 1.52E-02
BFGL-NGS-110018b(rs41647754) 5 64833594 HAL 357 8.53E-07 3.43E-02
ARS-BFGL-NGS-7249b 6 30503076 PDHA2 13265 8.38E-08 3.37E-03
BTA-83825-no-rsb(rs41659807) 9 7704446 LOC788115 60854 9.79E-07 3.94E-02
Hapmap30383-BTC-005848ab 14 76703 C14H8orf33 87 2.99E-13 1.20E-08
ARS-BFGL-NGS-57820ab 14 236532 FOXH1 3396 1.71E-12 6.88E-08
ARS-BFGL-NGS-4939ab 14 443937 DGAT1 160 5.81E-13 2.34E-08
ARS-BFGL-NGS-107379ab 14 679600 LOC786966 460 6.18E-12 2.49E-07
Hapmap30646-BTC-002054b 14 1461085 GPIHBP1 1295 1.55E-07 6.23E-03
ARS-BFGL-NGS-100480ab 14 2607583 NIBP Within 1.16E-06 4.67E-02
UA-IFASA-6329b(rs41579243) 14 3465237 COL22A1 9864 7.59E-07 3.05E-02
ARS-BFGL-BAC-10793b 14 27452257 NKAIN3 106885 7.15E-07 2.88E-02
Hapmap50053-BTA-61516b 26 39018261 C26H10orf84 28724 1.11E-06 4.46E-02
Note: See note to Table 4.
Table 7.Genome-wise significant (p,0.05) SNPs with fat percentage (FP).
SNP Chr. Position (bp) Nearest gene RawPvalue AdjustedPvalue
Name Distance (bp)
Hapmap39717-BTA-112973(rs41617243) 2 27529202 KBTBD10 Within 1.80E-07 7.24E-03
Hapmap51303-BTA-74377b(rs41652649) 5 89694749 ITPR2 Within 1.20E-06 4.83E-02
BTB-00285653b(rs43499009) 8 31663727 NFIB Within 2.41E-07 9.69E-03
BFGL-NGS-119907ab 11 106766451
GFI1B 15556 1.30E-06 5.23E-02
ARS-BFGL-NGS-26919a 11 107216562 LOC526069 Within 6.87E-08 2.69E-03
Hapmap30381-BTC-005750ab 14 50872 C14H8orf33 23701 2.28E-18 9.17E-14
Hapmap30383-BTC-005848ab 14 76703
C14H8orf33 87 1.05E-28 4.22E-24
BTA-34956-no-rsab(rs41630614) 14 101473 LOC785799 3479 2.37E-18 9.53E-14
ARS-BFGL-NGS-57820ab 14 236532 FOXH1 3396 1.82E-48 7.32E-44
ARS-BFGL-NGS-34135ab 14 260341
CYHR1 Within 1.71E-30 6.88E-26
ARS-BFGL-NGS-94706ab(rs17870736) 14 281533 VPS28 Within 5.78E-30 2.32E-25
ARS-BFGL-NGS-4939ab 14 443937 DGAT1 160 5.23E-64 2.10E-59
Hapmap52798-ss46526455ab(rs41256919) 14 565311
MAF1 Within 4.56E-12 1.83E-07
ARS-BFGL-NGS-71749ab 14 596341 OPLAH 3237 1.20E-11 4.83E-07
ARS-BFGL-NGS-107379ab 14 679600 LOC786966 460 1.77E-45 7.12E-41
ARS-BFGL-NGS-18365ab 14 741867 LOC524939 15242 2.13E-08 8.57E-04
Hapmap25384-BTC-001997b 14 835054 MAPK15 Within 6.22E-08 2.50E-03
Hapmap24715-BTC-001973b 14 856889 MAPK15 Within 2.74E-08 1.10E-03
BTA-35941-no-rsab(rs41627764) 14 894252 ZNF623 8779 2.72E-15 1.09E-10
ARS-BFGL-NGS-101653b 14 931162 EEF1D Within 8.84E-11 3.56E-06
ARS-BFGL-NGS-26520ab 14 996982 ZC3H3 Within 3.94E-14 1.58E-09
UA-IFASA-6878ab(rs41629750) 14 1044041 GRINA 15662 1.69E-13 6.80E-09
ARS-BFGL-NGS-22866b 14 1131952 LYPD2 2653 3.30E-10 1.33E-05
Hapmap25486-BTC-072553ab 14 1285037 GML Within 1.09E-13 4.38E-09
Hapmap29758-BTC-003619ab 14 1339276 CYP11B1 36652 1.95E-08 7.84E-04
Hapmap30646-BTC-002054ab 14 1461085 GPIHBP1 1295 6.30E-20 2.53E-15
Hapmap30086-BTC-002066ab 14 1490178 ZNF66 1566 6.61E-20 2.66E-15
Hapmap30374-BTC-002159ab 14 1546591 RHPN1 Within 5.44E-13 2.19E-08
ARS-BFGL-NGS-74378b 14 1889210 GPR20 71 1.46E-08 5.87E-04
BFGL-NGS-117542b 14 1913108 GPR20 23969 7.64E-10 3.07E-05
ARS-BFGL-NGS-33248ab 14 2130912 PTK2 Within 1.26E-08 5.07E-04
UA-IFASA-9288b(rs41624797) 14 2201870 PTK2 Within 2.19E-12 8.81E-08
ARS-BFGL-NGS-22111ab 1 2347219 EIF2C2 25806 6.59E-08 2.65E-03
UA-IFASA-7269ab(rs41576704) 14 2370256 EIF2C2 2769 1.02E-08 4.10E-04
Hapmap26072-BTC-065132b 14 2391826 EIF2C2 Within 2.15E-08 8.65E-04
ARS-BFGL-NGS-56327b 14 2580414 NIBP Within 1.58E-08 6.35E-04
ARS-BFGL-NGS-100480ab 14 2607583 NIBP Within 9.14E-16 3.68E-11
UA-IFASA-5306b(rs55617160) 14 2711615 NIBP Within 2.12E-13 8.53E-09
UA-IFASA-5765a 14 2763657 NIBP Within 5.82E-07 2.28E-02
ARS-BFGL-BAC-25166a 14 2805785 NIBP Within 5.11E-08 2.00E-03
Hapmap27703-BTC-053907ab 14 2826073 NIBP Within 3.03E-11 1.22E-06
Hapmap22692-BTC-068210b 14 3018726 KCNK9 25312 2.08E-07 8.37E-03
Hapmap23302-BTC-052123b 14 3099635 KCNK9 106221 2.03E-07 8.16E-03
Hapmap25217-BTC-067767b 14 3189312 KCNK9 195898 1.04E-07 4.18E-03
UA-IFASA-6329ab(rs41579243) 14 3465237 COL22A1 9864 4.29E-13 1.73E-08
ARS-BFGL-NGS-3571ab 14 3587018 COL22A1 Within 5.38E-09 2.16E-04
BFGL-NGS-118478a 14 3660264 COL22A1 Within 2.92E-07 1.14E-02
BFGL-NGS-110563ab 14 3799228 COL22A1 84554 3.31E-16 1.33E-11
Hapmap32262-BTC-066621b 14 3834069 LOC618755 67321 3.92E-11 1.58E-06
BFGL-NGS-115947b 14 3865962 LOC618755 35428 3.79E-07 1.52E-02
above the expectedx2statistics, which are largely at the adjusted genome-wide significance level. The profiles of the Q-Q plots clearly show that the significant SNPs identified by MMRA are unlikely threaten by potential population stratification.
Discussion
In this study, we performed a GWA study for five milk production traits using a daughter design in Chinese Holstein population. To our knowledge, this is one of the first GWA studies for milk production traits using the Illumina BovineSNP50 BeadChip. Two statistical methods, L1-TDT and MMRA, were implemented to analyze association between SNPs and pheno-types. These two methods belong to two distinct analytical approaches, i.e., family-based (L1-TDT) and population-based (MMRA) approaches, respectively, both of which have been widely employed in GWAS. Comparisons between the two methods have been well conducted by many investigators [27,46,47,48]. Consensus with respect to their performance is twofold. On the one hand, population-based analyses largely outperform family-based analyses in statistical power and efficiency. The power limitation of family-based analyses results from ‘‘overmatching’’ on genotype [49]. Much fewer significant SNPs detected by L1-TDT compared with MMRA in this study present consistent evidence for this aspect in practice. On the other hand, family-based analysis always guards against population admixture/stratification caused by recent migration and/or non-random mating, and do not give spurious significant results, although at the expense of some loss of power [50]. The ‘‘Q-Q’’ plots for the test statistics of MMRA (Fig. 2-1 to 2-5) demonstrate that no population admixture/stratification exists in our popula-tion. Therefore, it is safe to declare that the SNPs detected by MMRA as well as L1-TDT have convincing associations with the traits of interest.
BTA14 has been received wide attention by many investigators. Apart from a large number of QTL reported on BAT14 [34,39,51,52], the well-known DGAT1 gene[5] located at ,0.44Mb is generally accepted as a major gene affecting milk
production traits. BENNEWITZ et al. [28] revisited the QTL on BTA14 and concluded that there should exist a further conditional QTL which should be in linkage with the DGAT1 gene, and possible epistatic effects arising from them may be an additional source of genetic variation for milk production traits. Indeed, KAUPEet al.[53] recently reported that theCYP11B1gene located at,1.33Mbp has significant effects on MY, PY, FP and PP, and the allele substitution effects of CYP11B1 and DGAT1 together explained more variation in milk production traits thanDGAT1 alone. In our study, an apparent feature of our findings is that a large proportion of the significant SNPs (61 out of 105) are located on BTA14. Of the 61 SNPs, 59 are located within the reported QTL regions. In particular, all segments on BTA14 which harbor multiple SNPs for the five traits also harbor theDGAT1gene, and the four segments for MY, PY, FP and PP also harbor the CYP11B1gene. Within these segments, 13 SNPs are located very close (within 1Mb) to theDGAT1gene with the closest one (ARS-BFGL-NGS-4939) only 160bp away from it and 14 SNPs very close to theCYP11B1gene with the closest one (Hapmap25486-BTC-072553 ) only 8,693bp away from it.
In addition to the SNPs on BTA14, most (27 out of 44) of the significant SNPs on other chromosomes are also located within the reported QTL regions. Further, some SNPs are also within or close (within 1Mb) to the reported candidate genes (for a summary of cattle candidate genes for milk production traits, see [54]). In particular, a SNP (BFGL-NGS-118998) located at 34,036,832 bp on BTA20 was found to fall within theGHRgene, which is also generally accepted as a functional causal gene affecting milk yield and components [5,6]. The other SNPs include the SNPs BTA-121739-no-rs and Hapmap24324-BTC-062449 on BTA6, which are 20,591bp and 450,868bp away from the ABCG2gene [55], respectively, and the SNP ARS-BFGL-NGS-26919 on BTA11, which is 41,562bp away from theLGBgene [56].
It is notable that for either L1-TDT or MMRA some detected SNPs are associated with phenotypic variation in multiple production traits, including the SNPs ARS-BFGL-NGS-4939, ARS-BFGL-NGS-57820, and ARS-BFGL-NGS-107379 on BTA14 (for all of the five traits), the SNPs
ARS-BFGL-NGS-SNP Chr. Position (bp) Nearest gene RawPvalue AdjustedPvalue
Name Distance (bp)
Hapmap27709-BTC-057052ab(rs42305942) 14 4276966 LOC100138440 38554 4.14E-07 1.67E-02
Hapmap51646-BTA-86764b(rs41657812) 14 4302229 LOC100138440 13291 7.91E-08 3.18E-03
Hapmap26591-BTC-056596b 14 4477036 LOC100138440 157701 6.62E-07 2.66E-02
Hapmap23618-BTC-056528b(rs42310935) 14 4518666 LOC100138440 199331 2.06E-08 8.29E-04
Hapmap30988-BTC-056315ab 14 4693901 LOC100138440 374566 2.88E-08 1.16E-03
UA-IFASA-6228b 14 5204594 KHDRBS3 560215 8.09E-07 3.25E-02
ARS-BFGL-BAC-20965b 14 5225004 KHDRBS3 539805 2.77E-07 1.11E-02
BFGL-NGS-110894b 14 5282438 KHDRBS3 482371 9.21E-09 3.70E-04
Hapmap33635-BTC-049051b 14 5318261 KHDRBS3 446548 3.64E-07 1.46E-02
Hapmap23851-BTC-048718b 14 5387836 KHDRBS3 376973 1.26E-06 5.07E-02
Hapmap32234-BTC-048199ab 14 5640338 KHDRBS3 124471 3.82E-16 1.54E-11
UA-IFASA-6647ab 14 5808644 KHDRBS3 Within 2.29E-14 9.21E-10
Hapmap32948-BTC-047992b 14 5839290 KHDRBS3 Within 3.71E-07 1.49E-02
ARS-BFGL-BAC-8730ab 14 6252101 MIRN30D 221420 7.03E-13 2.83E-08
Note: See note to Table 4.
doi:10.1371/journal.pone.0013661.t007
94706 and ARS-BFGL-NGS-34135 on BTA14 (for MY, FY, FP, and PP), the SNPs Hapmap30383-BTC-005848, Hapmap30646-BTC-002054, ARS-BFGL-NGS-100480, and UA-IFASA-6329 on BTA14 (for MY, PY, and FP), the SNP UA-IFASA-6878 on BTA14 (for MY, FP, and PP), the SNPs Hapmap52798-ss46526455, BFGL-NGS-110563, Hapmap25486-BTC-072553, and Hapmap30086-BTC-002066 on BTA14 (for MY and FP), the SNPs ARS-BFGL-NGS-91705 on BTA1, Hapmap38643-BTA-95454 on BTA3, BFGL-NGS-110018 on BTA5, and Hap-map50053-BTA-61516 on BTA26 (for MY and PY), the SNPs Hapmap30381-BTC-005750 on BTA14 (for FY and FP), and the SNP Hapmap27703-BTC-053907 on BTA14 (for FP and PP). This could be explained by pleiotropic effects of these SNPs on multiple milk production traits, leading to genetic correlations among them and there were similar result in many prior studies [28,53].
In this study, we performed GWAS in the way of SNP by SNP individually via regressing the observations of a single trait on either the genotypes of a SNP (MMRA) or the allele transmission patterns of a SNP from bulls to corresponding half-sib offspring (L1-TDT). Previous studies have shown that single marker tests
provide similar or greater power than haplotype-based approaches [57,58]. In contrast to haplotype-based methods, the main advantage of the single locus test is that it does not necessitate information of SNP positions and reconstruction haplotypes of multiple SNP loci. Thus, it is the preferable method for large scale genome-wise association analyses,e.g., GWAS. Also, we individ-ually perform GWAS for each of five milk production traits. This is the most conventional strategy for current GWAS. However, the five milk production traits considered here are generally regarded as correlated and thus should share common environmental/ genetic factors. A multiple traits instead of single trait analysis may be a promising way to take correlations among these traits into consideration. Multivariate analyses have been widely adopted in linkage studies [59,60,61,62,63], and it has been generally accepted that multivariate analyses outperform univariate analyses in terms of increasing statistical power and precision of parameter estimation [64,65]. In the next step, an optimal multiple traits analytical strategy will be pursued to further enhance our GWA studies.
In our study, the EBVs of daughters were used as phenotypes for association analysis. Besides EBVs, yield deviation (YD) and
Table 8.Genome-wise significant (p,0.05) SNPs with protein percentage (PP).
SNP Chr. Position (bp) Nearest gene RawPValue AdjustedPvalue
Name Distance (bp)
Hapmap48524-BTA-92140b(rs42552739) 5 80965296
NCF4 24749 3.69E-11 1.48E-06
ARS-BFGL-NGS-21133b 5 81003368 CSF2RB 2032 3.29E-07 1.32E-02
Hapmap59369-rs29018333b(rs29018333) 6 33989255 LOC536367 Within 1.52E-08 6.11E-04
Hapmap24324-BTC-062449b 6 37024132 HERC3 6738 2.33E-17 9.37E-13
BTA-121739-no-rsb(rs41622323) 6 37454409 PKD2 Within 7.08E-07 2.85E-02
BTB-00251047b(rs43463988) 6 41928694 LOC100140991 401634 4.33E-07 1.74E-02
Hapmap41083-BTA-76098b(rs41652041) 6 80715299 LOC100140587 4319 1.17E-06 4.71E-02
ARS-BFGL-NGS-57820ab 14 236532 FOXH1 3396 2.82E-08 1.13E-03
ARS-BFGL-NGS-34135ab 14 260341 CYHR1 Within 3.88E-09 1.56E-04
ARS-BFGL-NGS-94706ab(rs17870736) 14 281533 VPS28 Within 2.28E-08 9.17E-04
ARS-BFGL-NGS-4939ab 14 443937 DGAT1 160 3.73E-08 1.50E-03
ARS-BFGL-NGS-107379ab 14 679600 LOC786966 460 7.73E-07 3.11E-02
UA-IFASA-6878b(rs41629750) 14 1044041 GRINA 15662 6.79E-07 2.73E-02
Hapmap27703-BTC-053907a 14 2826073 NIBP Within 3.95E-07 1.55E-02
BFGL-NGS-118998ab 20 34036832 GHR Within 7.87E-07 3.17E-02
ARS-BFGL-BAC-2469b(rs41937533) 20 35552477 LOC518808 22514 1.21E-08 4.87E-04
BTA-50402-no-rsb(rs41945918) 20 36668000 LOC782462 19510 7.57E-07 3.04E-02
Hapmap57531-rs29013890b(rs29013890) 20 36955575 LOC782833 32019 8.97E-08 3.61E-03
BTB-00778154ab(rs41941646) 20 37399087 C9 10219 6.21E-07 2.50E-02
BTB-00778141ab(rs41941633) 20 37442583 FYB 35360 1.91E-11 7.68E-07
ARS-BFGL-NGS-38482b 20 37708167 RICTOR Within 1.99E-08 8.00E-04
Hapmap39660-BTA-50453b(rs41581059) 20 37865657 LOC100138964 Within 2.97E-07 1.19E-02
ARS-BFGL-NGS-22355b 20 38899763
GDNF 17831 5.65E-07 2.27E-02
BTB-00782435b(rs41942492) 20 39485917 NIPBL Within 1.02E-07 4.10E-03
BTA-13793-rs29018751b(rs29018751) 20 39518857 NIPBL Within 6.27E-10 2.52E-05
BTB-01842107b(rs42954630) 20 39601103
NIPBL Within 1.53E-10 6.15E-06
Hapmap53199-rs29014437a(rs29014437) 20 39728147 LOC782284 38124 3.35E-07 1.35E-02
BTA-102910-no-rsb(rs41574319) 20 41947097 RAI14 171370 2.64E-07 1.06E-02
Note: See note to Table 4.
de-regressed EBVs of individuals are also commonly used as phenotypic observations in GWAS as well as in LA and LA/LD analyses for milk production traits. Comparison among these three kinds of phenotypes with respect to their influence on QTL mapping [66] and marker assisted selection studies [67] demon-strate that none of them has absolute advantages over the others. We also compared using EBVs and de-regressed EBVs as phenotypes for our GWAS and it turned out that the findings of them are basically overlap (data not shown). Therefore, only the findings from using EBVs are reported herein.
In all, the present study revealed 105 genome-wise significant SNPs for milk production traits in Chinese dairy cattle population using two different association analysis approaches (L1-TDT and MMRA). Most of these SNPs (86 out of 105) are located within the previously reported QTL regions, and some within or close to the reported candidate genes. The general consistence of the significant SNPs detected herein with the reported QTL and
candidate genes and the agreement of the results of the two analysis approaches present strong support for the outcomes of this study. Our findings herein lay a preliminary foundation for guiding follow-up replication studies, and eventually revealing the causal mutations underlying milk production traits in dairy cattle.
Acknowledgments
We are grateful to the two reviewers for their insightful comments and constructive suggestions that greatly improved our manuscript. We thank Dairy Association of China for supplying the official EBVs and Beijing Dairy Cattle Center for providing blood and semen samples.
Author Contributions
Conceived and designed the experiments: QZ. Performed the experiments: LJ DS PM. Analyzed the data: JL. Contributed reagents/materials/ analysis tools: XD YY. Wrote the paper: LJ JL QZ.
References
1. Georges M, Nielsen D, Mackinnon M, Mishra A, Okimoto R, et al. (1995) Mapping quantitative trait loci controlling milk production in dairy cattle by exploiting progeny testing. Genetics 139: 907–920.
2. Meuwissen TH, Goddard ME (2001) Prediction of identity by descent probabilities from marker-haplotypes. Genet Sel Evol 33: 605–634. 3. Goddard ME, Hayes BJ (2009) Mapping genes for complex traits in domestic
animals and their use in breeding programmes. Nat Rev Genet 10: 381–391. 4. Andersson L, Georges M (2004) Domestic-animal genomics: deciphering the
genetics of complex traits. Nat Rev Genet 5: 202–212.
5. Grisart B, Farnir F, Karim L, Cambisano N, Kim JJ, et al. (2004) Genetic and functional confirmation of the causality of the DGAT1 K232A quantitative trait nucleotide in affecting milk yield and composition. Proc Natl Acad Sci U S A 101: 2398–2403.
6. Blott S, Kim JJ, Moisio S, Schmidt-Kuntzel A, Cornet A, et al. (2003) Molecular dissection of a quantitative trait locus: a phenylalanine-to-tyrosine substitution in the transmembrane domain of the bovine growth hormone receptor is associated with a major effect on milk yield and composition. Genetics 163: 253–266. 7. Daw EW, Heath SC, Lu Y (2005) Single-nucleotide polymorphism versus
microsatellite markers in a combined linkage and segregation analysis of a quantitative trait. BMC Genet 6 Suppl 1: S32.
8. Georges M (2007) Mapping, fine mapping, and molecular dissection of quantitative trait Loci in domestic animals. Annu Rev Genomics Hum Genet 8: 131–162.
9. Amills M, Vidal O, Varona L, Tomas A, Gil M, et al. (2005) Polymorphism of the pig 2,4-dienoyl CoA reductase 1 gene (DECR1) and its association with carcass and meat quality traits. J Anim Sci 83: 493–498.
10. Kaminski S, Help H, Brym P, Rusc A, Wojcik E (2008) SNiPORK - a microarray of SNPs in candidate genes potentially associated with pork yield and quality - development and validation in commercial breeds. Anim Biotechnol 19: 43–69.
11. Brym P, Kaminski S, Wojcik E (2005) Nucleotide sequence polymorphism within exon 4 of the bovine prolactin gene and its associations with milk performance traits. J Appl Genet 46: 179–185.
12. Haegeman A, Williams JL, Law A, Van Zeveren A, Peelman LJ (2003) Mapping and SNP analysis of bovine candidate genes for meat and carcass quality. Anim Genet 34: 349–353.
13. Vallet JL, Freking BA, Leymaster KA, Christenson RK (2005) Allelic variation in the erythropoietin receptor gene is associated with uterine capacity and litter size in swine. Anim Genet 36: 97–103.
14. Vallet JL, Freking BA, Leymaster KA, Christenson RK (2005) Allelic variation in the secreted folate binding protein gene is associated with uterine capacity in swine. J Anim Sci 83: 1860–1867.
15. Horin P, Osickova J, Necesankova M, Matiasovic J, Musilova P, et al. (2008) Single nucleotide polymorphisms of interleukin-1 beta related genes and their associations with infection in the horse. Dev Biol (Basel) 132: 347–351. 16. Craig DW, Stephan DA (2005) Applications of whole-genome high-density SNP
genotyping. Expert Rev Mol Diagn 5: 159–170.
17. Coon KD, Myers AJ, Craig DW, Webster JA, Pearson JV, et al. (2007) A high-density whole-genome association study reveals that APOE is the major susceptibility gene for sporadic late-onset Alzheimer’s disease. J Clin Psychiatry 68: 613–618.
18. Ng CC, Yew PY, Puah SM, Krishnan G, Yap LF, et al. (2009) A genome-wide association study identifies ITGA9 conferring risk of nasopharyngeal carcinoma. J Hum Genet 54: 392–397.
19. Scott LJ, Mohlke KL, Bonnycastle LL, Willer CJ, Li Y, et al. (2007) A genome-wide association study of type 2 diabetes in Finns detects multiple susceptibility variants. Science 316: 1341–1345.
20. Hirschhorn JN, Daly MJ (2005) Genome-wide association studies for common diseases and complex traits. Nat Rev Genet 6: 95–108.
21. Daetwyler HD, Schenkel FS, Sargolzaei M, Robinson JA (2008) A genome scan to detect quantitative trait loci for economically important traits in Holstein cattle using two methods and a dense single nucleotide polymorphism map. J Dairy Sci 91: 3225–3236.
22. Kolbehdari D, Wang Z, Grant JR, Murdoch B, Prasad A, et al. (2009) A whole genome scan to map QTL for milk production traits and somatic cell score in Canadian Holstein bulls. J Anim Breed Genet 126: 216–227.
23. Schaeffer LR, Jamrozik J, Kistemaker GJ, Van Doormaal BJ (2000) Experience with a test-day model. J Dairy Sci 83: 1135–1144.
24. Matukumalli LK, Lawley CT, Schnabel RD, Taylor JF, Allan MF, et al. (2009) Development and characterization of a high density SNP genotyping assay for cattle. PLoS One 4: e5350.
25. Kolbehdari D, Jansen GB, Schaeffer LR, Allen BO (2006) Transmission disequilibrium test for quantitative trait loci detection in livestock populations. J Anim Breed Genet 123: 191–197.
26. Sun FZ, Flanders WD, Yang QH, Zhao HY (2000) Transmission/disequilib-rium tests for quantitative traits. Ann Hum Genet 64: 555–565.
27. Pearson TA, Manolio TA (2008) How to interpret a genome-wide association study. Jama 299: 1335–1344.
28. Bennewitz J, Reinsch N, Paul S, Looft C, Kaupe B, et al. (2004) The DGAT1 K232A mutation is not solely responsible for the milk production quantitative trait locus on the bovine chromosome 14. J Dairy Sci 87: 431–442. 29. Bagnato A, Schiavini F, Rossoni A, Maltecca C, Dolezal M, et al. (2008)
Quantitative trait loci affecting milk yield and protein percentage in a three-country Brown Swiss population. J Dairy Sci 91: 767–783.
30. Harder B, Bennewitz J, Reinsch N, Thaller G, Thomsen H, et al. (2006) Mapping of quantitative trait loci for lactation persistency traits in German Holstein dairy cattle. J Anim Breed Genet 123: 89–96.
31. Lund MS, Guldbrandtsen B, Buitenhuis AJ, Thomsen B, Bendixen C (2008) Detection of quantitative trait loci in Danish Holstein cattle affecting clinical mastitis, somatic cell score, udder conformation traits, and assessment of associated effects on milk yield. J Dairy Sci 91: 4028–4036.
32. Wiener P, Maclean I, Williams JL, Woolliams JA (2000) Testing for the presence of previously identified QTL for milk production traits in new populations. Anim Genet 31: 385–395.
33. Schulman NF, Sahana G, Lund MS, Viitala SM, Vilkki JH (2008) Quantitative trait loci for fertility traits in Finnish Ayrshire cattle. Genet Sel Evol 40: 195–214. 34. Heyen DW, Weller JI, Ron M, Band M, Beever JE, et al. (1999) A genome scan for QTL influencing milk production and health traits in dairy cattle. Physiol Genomics 1: 165–175.
35. Awad A, Russ I, Emmerling R, Forster M, Medugorac I (2010) Confirmation and refinement of a QTL on BTA5 affecting milk production traits in the Fleckvieh dual purpose cattle breed. Anim Genet 41: 1–11.
Figure 2. Quantile-quantile (Q-Q) plots of genome-wide association results by MMRA for five milk production traits.Under the null hypothesis of no association at any SNP locus, the points would be expected to follow the slope lines. Deviations from the slope lines correspond to loci that deviate from the null hypotheses.
36. Looft C, Reinsch N, Karall-Albrecht C, Paul S, Brink M, et al. (2001) A mammary gland EST showing linkage disequilibrium to a milk production QTL on bovine Chromosome 14. Mamm Genome 12: 646–650.
37. Gao H, Fang M, Liu J, Zhang Q (2009) Bayesian shrinkage mapping for multiple QTL in half-sib families. Heredity 103: 368–376.
38. Lund MS, Sorensen P, Madsen P, Jaffrezic F (2008) Detection and modelling of time-dependent QTL in animal populations. Genet Sel Evol 40: 177–194. 39. Ashwell MS, Heyen DW, Sonstegard TS, Van Tassell CP, Da Y, et al. (2004)
Detection of quantitative trait loci affecting milk production, health, and reproductive traits in Holstein cattle. J Dairy Sci 87: 468–475.
40. Rodriguez-Zas SL, Southey BR, Heyen DW, Lewin HA (2002) Detection of quantitative trait loci influencing dairy traits using a model for longitudinal data. J Dairy Sci 85: 2681–2691.
41. Viitala SM, Schulman NF, de Koning DJ, Elo K, Kinos R, et al. (2003) Quantitative trait loci affecting milk production traits in Finnish Ayrshire dairy cattle. J Dairy Sci 86: 1828–1836.
42. Boichard D, Grohs C, Bourgeois F, Cerqueira F, Faugeras R, et al. (2003) Detection of genes influencing economic traits in three French dairy cattle breeds. Genet Sel Evol 35: 77–101.
43. Bennewitz J, Reinsch N, Grohs C, Leveziel H, Malafosse A, et al. (2003) Combined analysis of data from two granddaughter designs: A simple strategy for QTL confirmation and increasing experimental power in dairy cattle. Genet Sel Evol 35: 319–338.
44. Ashwell MS, Van Tassell CP, Sonstegard TS (2001) A genome scan to identify quantitative trait loci affecting economically important traits in a US Holstein population. J Dairy Sci 84: 2535–2542.
45. Viitala S, Szyda J, Blott S, Schulman N, Lidauer M, et al. (2006) The role of the bovine growth hormone receptor and prolactin receptor genes in milk, fat and protein production in Finnish Ayrshire dairy cattle. Genetics 173: 2151–2164. 46. Benyamin B, Visscher PM, McRae AF (2009) Family-based genome-wide
association studies. Pharmacogenomics 10: 181–190.
47. Gauderman WJ, Witte JS, Thomas DC (1999) Family-based association studies. J Natl Cancer Inst Monogr. pp 31–37.
48. Little J, Bradley L, Bray MS, Clyne M, Dorman J, et al. (2002) Reporting, appraising, and integrating data on genotype prevalence and gene-disease associations. Am J Epidemiol 156: 300–310.
49. Thomas DC, Haile RW, Duggan D (2005) Recent developments in genomewide association scans: a workshop summary and review. Am J Hum Genet 77: 337–345.
50. Ewens WJ, Spielman RS (1995) The transmission/disequilibrium test: history, subdivision, and admixture. Am J Hum Genet 57: 455–464.
51. Farnir F, Grisart B, Coppieters W, Riquet J, Berzi P, et al. (2002) Simultaneous mining of linkage and linkage disequilibrium to fine map quantitative trait loci in outbred half-sib pedigrees: revisiting the location of a quantitative trait locus with major effect on milk production on bovine chromosome 14. Genetics 161: 275–287.
52. Coppieters W, Riquet J, Arranz JJ, Berzi P, Cambisano N, et al. (1998) A QTL with major effect on milk yield and composition maps to bovine chromosome 14. Mamm Genome 9: 540–544.
53. Kaupe B, Brandt H, Prinzenberg EM, Erhardt G (2007) Joint analysis of the influence of CYP11B1 and DGAT1 genetic variation on milk production, somatic cell score, conformation, reproduction, and productive lifespan in German Holstein cattle. J Anim Sci 85: 11–21.
54. Ogorevc J, Kunej T, Razpet A, Dovc P (2009) Database of cattle candidate genes and genetic markers for milk production and mastitis. Anim Genet. 55. Cohen-Zinder M, Seroussi E, Larkin DM, Loor JJ, Everts-van der Wind A, et al.
(2005) Identification of a missense mutation in the bovine ABCG2 gene with a major effect on the QTL on chromosome 6 affecting milk yield and composition in Holstein cattle. Genome Res 15: 936–944.
56. Kuss AW, Gogol J, Geidermann H (2003) Associations of a polymorphic AP-2 binding site in the 59-flanking region of the bovine beta-lactoglobulin gene with milk proteins. J Dairy Sci 86: 2213–2218.
57. Zhao HH, Fernando RL, Dekkers JC (2007) Power and precision of alternate methods for linkage disequilibrium mapping of quantitative trait loci. Genetics 175: 1975–1986.
58. Grapes L, Dekkers JC, Rothschild MF, Fernando RL (2004) Comparing linkage disequilibrium-based methods for fine mapping quantitative trait loci. Genetics 166: 1561–1570.
59. Williams KJ (2009) Some things just have to be done in vivo: GPIHBP1, caloric delivery, and the generation of remnant lipoproteins. Arterioscler Thromb Vasc Biol 29: 792–795.
60. Lange C, Whittaker JC (2001) Mapping quantitative trait Loci using generalized estimating equations. Genetics 159: 1325–1337.
61. Huang J, Jiang Y (2003) Genetic linkage analysis of a dichotomous trait incorporating a tightly linked quantitative trait in affected sib pairs. Am J Hum Genet 72: 949–960.
62. Allison DB, Thiel B, St Jean P, Elston RC, Infante MC, et al. (1998) Multiple phenotype modeling in gene-mapping studies of quantitative traits: power advantages. Am J Hum Genet 63: 1190–1201.
63. Liu J, Liu Y, Liu X, Deng HW (2007) Bayesian mapping of quantitative trait loci for multiple complex traits with the use of variance components. Am J Hum Genet 81: 304–320.
64. Liu YZ, Pei YF, Liu JF, Yang F, Guo Y, et al. (2009) Powerful bivariate genome-wide association analyses suggest the SOX6 gene influencing both obesity and osteoporosis phenotypes in males. PLoS One 4: e6827.
65. Liu J, Pei Y, Papasian CJ, Deng HW (2009) Bivariate association analyses for the mixture of continuous and binary traits with the use of extended generalized estimating equations. Genet Epidemiol 33: 217–227.
66. Thomsen H, Reinsch N, XU N, LOOFT C, GRUPE S, et al. (2001) Comparison of estimated breeding values, daughter yield deviations and de-regressed proofs within a whole genome scan for QTL. J Anim Breed Genet 118: 357–370.