ClonalFrameML: Efficient Inference of
Recombination in Whole Bacterial Genomes
Xavier Didelot1*, Daniel J. Wilson2,3*
1Department of Infectious Disease Epidemiology, Imperial College, London, United Kingdom,2Nuffield Department of Medicine, University of Oxford, John Radcliffe Hospital, Oxford, United Kingdom,3Wellcome Trust Centre for Human Genetics, Oxford, United Kingdom
*[email protected](XD);[email protected](DJW)
Abstract
Recombination is an important evolutionary force in bacteria, but it remains challenging to reconstruct the imports that occurred in the ancestry of a genomic sample. Here we present ClonalFrameML, which uses maximum likelihood inference to simultaneously detect recombination in bacterial genomes and account for it in phylogenetic reconstruction. ClonalFrameML can analyse hundreds of genomes in a matter of hours, and we demon-strate its usefulness on simulated and real datasets. We find evidence for recombination hotspots associated with mobile elements inClostridium difficileST6 and a previously undescribed 310kb chromosomal replacement inStaphylococcus aureusST582. Clonal-FrameML is freely available athttp://clonalframeml.googlecode.com/.
Introduction
Following recent developments in sequencing technologies, both the time and cost required to sequence whole bacterial genomes have dropped to levels where it is now being applied in clini-cal and public health microbiology [1,2]. On its own, the genome of a single bacterial isolate can indicate many clinically important features such as the species and strain [3,4], the level of virulence [5,6] and antimicrobial resistance properties [7,8]. Comparisons of multiple bacterial genomes can be used to investigate within-host diversity and evolution [9,10], to delineate and reconstruct local outbreaks [11–13], or to describe the global population structure and epide-miology [14,15]. Such comparisons typically involve the construction of a phylogenetic tree to reflect the relationships between genomes. One of the most popular approaches to do this is the maximum likelihood (ML) method, as implemented for example in PhyML [16], RAxML [17] and FastTree [18]. Bayesian methods such as BEAST [19] or MrBayes [20] are also fre-quently used, but less often than other methods because Bayesian methods tend to be more computationally expensive for applications to large genomic sets.
Phylogenetic reconstruction by any method is problematic because bacteria occasionally undergo homologous recombination, whereby a fragment of the recipient’s genome is replaced by that of the donor [21]. There are three different mechanisms that can lead to homologous recombination in bacteria: transduction where a virus transmits DNA from the donor to the
OPEN ACCESS
Citation:Didelot X, Wilson DJ (2015)
ClonalFrameML: Efficient Inference of Recombination in Whole Bacterial Genomes. PLoS Comput Biol 11 (2): e1004041. doi:10.1371/journal.pcbi.1004041
Editor:Andreas Prlic, UCSD, United States of America
Received:August 19, 2014
Accepted:November 16, 2014
Published:February 12, 2015
Copyright:© 2015 Didelot, Wilson. This is an open access article distributed under the terms of the
Creative Commons Attribution License, which permits unrestricted use, distribution, and reproduction in any medium, provided the original author and source are credited.
Data Availability Statement:All data files are available from the author’s websitehttp://www. danielwilson.me.uk/files/cfml.tgz
recipient, transformation where donor DNA in the environment is free to be taken up by the recipient, and conjugation where donor and recipient come into direct contact [22]. The fre-quency of recombination varies from species to species [23], and sometimes also from one line-age to another within a single species, for example inClostridium difficile[24] and
Streptococcus pneumoniae[25]. Even inStaphylococcus aureuswhich is often described as a clonal species, some branches of the ML phylogeny contain significant evidence for recombina-tion [26]. Ignoring recombination altogether when reconstructing a bacterial phylogeny is like-ly to be misleading about the true clonal relationships between isolates [27–29]. For example, the signal of temporal evolution was only detectable inS. pneumoniaeonce recombined regions had been excluded prior to phylogenetic reconstruction [30]. To correctly infer phylogenetic relationships it is therefore necessary to detect and account for recombination, but doing so also allows the study of recombination which is an interesting and important evolutionary phenome-non in its own right. For example, recombination played a key role in host adaptation of Salmo-nella enterica[31] andCampylobacter jejuni[32,33], in the evolution ofC. difficilecell surface [34] and pathogenicity [6], inHelicobacter pyloriwithin-host diversification [35,36] and global population structure [37,38], and inS. pneumoniaeevolution and vaccine escape [25,39,40].
In the absence of recombination, all genomic positions would be in the clonal frame and a phylogenetic reconstruction would therefore reflect the clonal genealogy [41–43]. The Clonal-Frame software [44] attempts to reconstruct this tree of clonal relationships between isolates by detecting the location of recombined regions on each branch. However, ClonalFrame was developed almost ten years ago primarily for application to multi-locus sequence typing data [45], and it is not able to deal with the large amounts of whole genome sequencing data cur-rently being generated. For that reason, we developed a completely new implementation called ClonalFrameML which allows ML inference to be performed under the ClonalFrame model for hundreds of whole genomes in a matter of hours.
Design and Implementation
The ClonalFrame model of recombination. To consider the effect of recombination on phylo-genetic reconstruction, it is useful to distinguish two types of events, namely imports from a source within the population under study, and imports from an external source. The former is especially relevant if the sampled genomes cover a whole species or several species, in which case recombina-tion typically originates from within the same species, does not introduce new polymorphism but does result in homoplasy and genetic incompatibility [46]. On the other hand, if recombination comes from an external source, then the recombined segments contain a high number of substitu-tions which are not seen elsewhere in the dataset [46]. This is especially relevant if the genomes under study are all from a single lineage (for example a single sequence type according to multi-locus sequence typing [45]), with frequent imports from other lineages. In this case, recombination with other members of the same lineage might also occur but would have little effect (typically none) compared to imports from other lineages because of the low diversity within the lineage.
A simple model of recombination from external sources has previously been proposed and Bayesian inference under this model is implemented in ClonalFrame [44]. In this model, geno-mic evolution occurs on the branches of the clonal genealogy via point mutation and recombina-tion respectively at ratesθ/2 andR/2 per site per coalescent unit of time (which is equal to the effective population sizeNetimes the durationgof a generation). Note that other models use a
different parameterisation involving the scaled rate of occurrence of either initiation or termina-tion of recombinatermina-tion,ρ= 2R[47–49]. Recombination is assumed to affect segments of length exponentially distributed with meanδin which each site is substituted with probabilityν, irre-spective of whether recombination involved transduction, transformation or conjugation.
National Institute for Health Research on behalf of the UK Department of Health (Grant G0800778) and the Wellcome Trust (Grant 087646/Z/08/Z). The funders had no role in study design, data collection and analysis, decision to publish, or preparation of the manuscript.
Overview of the ClonalFrameML algorithm. Here we describe a new algorithm for infer-ence under the ClonalFrame model, ClonalFrameML, which proceeds in the following steps:
1. An ML tree is constructed using standard software such as PhyML [16] or RAxML [17] and taken to be the initial clonal genealogy.
2. The ancestral sequences at internal nodes of the clonal genealogy, and any missing base calls in the observed sequences, are reconstructed by ML using a previously described algo-rithm [50].
3. A Baum-Welch Expectation-Maximisation (EM) algorithm is used to obtain ML estimates of the recombination parameters and the branch lengths of the clonal genealogy.
4. The ML importation status is inferred at every site using a Viterbi algorithm.
5. Uncertainty in the parameters is quantified using a bootstrapping method.
Description of the ClonalFrame model as a hidden Markov model. We assume the pa-rametersR/θ,δandνare the same for all branches, and that the length of branchi, in terms of the expected number of mutations, isMi. Unlike ClonalFrame, which assumes a coalescent
prior on the genealogy, the use of an ML tree makes no such assumption. We have found that the topology of the clonal genealogy can be estimated extremely well by ML from whole ge-nome data [51]. Since we use an ML tree, we measure the lengths of branches and the recombi-nation rate in units of expected numbers of mutations, whereas the ClonalFrame method measures them in units ofNeggenerations. For efficient computation, the ClonalFrame model
can be thought of as a hidden Markov model (HMM, see, e.g. [52]) when the ancestral and de-scendant genomes for each branch of the clonal genealogy have been observed or recon-structed. The hidden state of the HMM records whether each nucleotide was subject to recombination or not on the branch connecting the two genomes. Nucleotides unaffected by recombination are said to beunimported(U) and nucleotides subject to recombination are said to beimported(I) [44]. Based on the ClonalFrame model, we define the following transition probability matrix for the hidden variable between sites,HjandHkdistancedjkapart:
PrðHkjHjÞ ¼
e djkMRy H
j¼UandHk ¼U
1 e djkMRy H
j¼UandHk¼I
1 e djk=d H
j¼IandHk ¼U
e djk=d H
j¼IandHk ¼I
8
> > > > > <
> > > > > :
Again following the ClonalFrame model, we define the following emission probabilities for the data at nucleotidej, which define the likelihood for the ancestral and descendant sequences conditional on the underlying hidden variable:
PrðAj;DjjHjÞ ¼
pðAMjDÞj Hj¼U
pðAnjÞDj Hj¼I
:
8
<
:
HereAjandDjare the nucleotides of the ancestral and descendant sequences andpðjktÞis the
In the EM algorithm that follows, we approximate the transition and emission probabilities to obtain analytic results for the parameter updates. We employ a Poisson approximation to the transition probabilities that, in effect, assumes no more than a single transition between ad-jacent sites:
Pr HkjHj
e djkMRy H
j¼U andHk¼U
djkMRy
e djkMRy H
j¼U andHk¼I
ðdjk=dÞe djk=
d H
j¼IandHk¼U
e djk=d H
j¼IandHk¼I
8 > > > > > > < > > > > > > :
We summarize the sixteen possible combinations of ancestral and descendant nucleotides by a single observationOjthat records whether they are the same (S) or different (D), and
em-ploying a Poisson approximation that, in effect, assumes no more than a single substitution along the branch, then:
PrðAj;DjjHjÞ
e M O
j¼SandHj¼U
Me M O
j¼DandHj¼U
e n O
j¼SandHj¼I
ne n O
j¼DandHj¼I
8 > > > > < > > > > :
We use a Baum-Welch EM algorithm to estimate the model parameters. Given initial pa-rametersY¼ R
y;d;n;M1...B
comprising the recombination parameters and theBbranch lengths, we use the forward-backward algorithm to calculate the expected number of transi-tions,Tijkbetween the hidden statesjandkfor sites less than 1kb apart, and the expected
num-ber of observations,Eijk, of statekgiven hidden statejon branchi. The 1kb restriction helps
ensure the validity of the Poisson approximation. We then update the parameters as follows
M0i¼
aMþEiUD
bMþEiUSþEiUD
;
n0¼ anþ PB
i¼1EiID
bnþ PB
i¼1EiISþEiID
;
1
d0¼
adþ PB
i¼1TiIU
bdþd PB
i¼1ðTiIUþTiIIÞ
;
R
y
0
¼ aRyþ
PB i¼1TiUI
bR
yþ
dPB
i¼1MiðTiUUþTiUIÞ
;
deviations, ffiffiffi a p
=b, equal to the prior means, representing prior uncertainty over roughly three orders of magnitude.
Quantifying the uncertainty in the parameters. To obtain a measure of uncertainty in the parameter estimates, we perform a parametric bootstrap where we simulate the number of transitionsTijkand emissionsEijkof each sort based on the ML parameter estimates using a
posterior decoding algorithm [51]. The parameters are then drawn from gamma distributions with shape and rate parameters given by the numerators and denominators respectively in the above equations. This computationally efficient but somewhat heuristic procedure accounts for uncertainty inTijkandEijk, and for uncertainty in the parameters givenTijkandEijk, but not in
the tree topology or ancestral state reconstruction, so it will underestimate the true uncertainty in the parameter estimates.
Extended model with separate recombination parameters for each branch. To allow de-tection of heterogeneity in the recombination process on different branches of the tree, we im-plemented an EM algorithm that estimates parameters for each branch, using a hyperprior in the form of pseudocounts to help obtain sensible values for uninformative branches. Formally, we defined the per-branch recombination parameters to be related to the mean recombination parameters through a branch-specific factor as follows:
li¼lwðilÞ
whereλrepresents one of the parameters,lis the mean of that parameter andwiis the
branch-specific factor. This leads to the following EM updates. First, the mean branch length parameter is iteratively updated until the following equation converges:
M0 ¼ aMþ
PB i¼1EiUD
bMþPB
i¼1ðawþEiUDÞðEiUSþEiUDÞ=ðbwþMðEiUSþEiUDÞÞ
Then the individual branch length factors are updated as follows:
w0ðMÞ
i ¼ ðawþEiUDÞ=ðbwþM0ðEiUSþEiUDÞÞ
The updating equations are similar for the other parameters:
n0¼ anþ
PB i¼1EiID
bnþ PB
i¼1ðawþEiIDÞðEiISþEiIDÞ=ðbwþnðEiISþEiIDÞÞ
;
w0ðinÞ¼ ðawþEiIDÞ=ðbwþn
0ðE
iISþEiIDÞÞ;
1
d0¼
adþ PB
i¼1TiIU
bdþ PB
i¼1ðawþTiIUÞdðTiIUþTiIIÞ=ðbwþdðTiIUþTiIIÞ=dÞ
;
w0ðdÞ
i ¼ ðawþTiIUÞ=ðbwþdðTiIUþTiIIÞ=d0Þ;
R
y
0
¼ aRyþ
PB i¼1TiUI
bR
yþ PB
i¼1ðawþTiUUÞMidðTiUUþTiUIÞ= bwþ Ry
MidðTiUUþTiUIÞ
w0ð ÞRy
i ¼ ðawþTiUUÞ= bwþ
R
y
0
MidðTiUUþTiUIÞ !
:
To ensurelwas the mean of parameterλacross branches we setαw=βwand we chose an
absolute value of 100 to prevent poorly identified parameters from deviating far from the mean.
Results
Example application to a simulated dataset
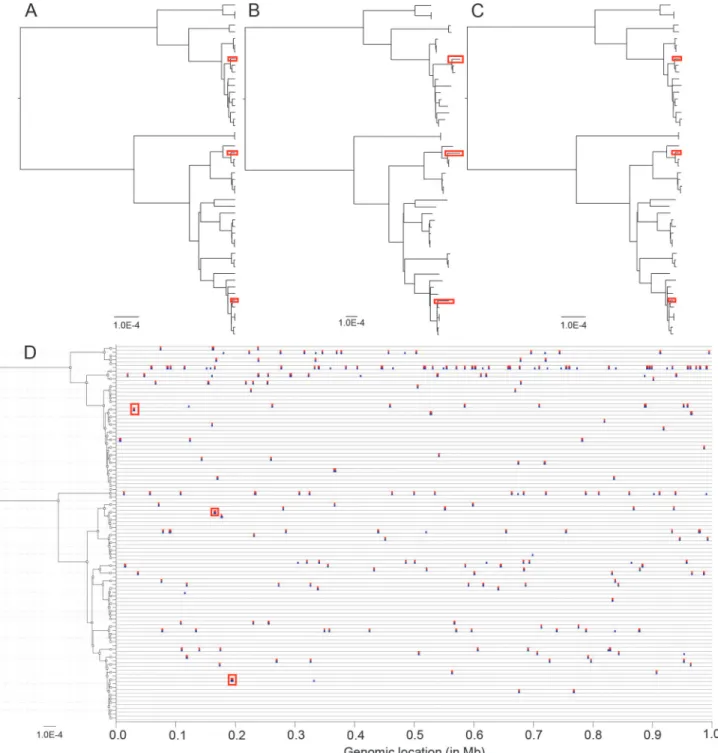
To illustrate the working of ClonalFrameML, we simulated under the ClonalFrame model [44] a dataset made of 50 genomes of 1Mb each. The clonal genealogy was taken from the coalescent model [53] with a scaled mutation rate ofθ= 10−3per site (Fig. 1A). The ratio of
recombina-tion and mutarecombina-tion rates, the mean length of imports and the average distance of the imports were equal toR/θ= 0.0626,δ= 554.95 bp andν= 0.0374, respectively. The first step of our in-ference procedure is to compute an ML phylogeny, and here PhyML [16] took approximately one minute on a standard desktop computer to produce the ML tree (Fig. 1B). This tree has the same topology as the true clonal genealogy (Fig. 1A). This is because in the ClonalFrame model, recombination has an external origin so that the substitutions imported on a given branch are shared by the genomes that descend from that branch. Recombination is therefore informative about the tree topology in exactly the same way as mutation, which is why the tree topology reconstructed by the ML phylogeny is correct even when no attempt is made to ac-count for recombination.
The scale of branch lengths in the reconstructed phylogeny (Fig. 1B) was 2.1 times greater than in the true tree (Fig. 1A), because the latter accounts only for the substitutions introduced by mutation whereas the former also includes the differences imported by recombination. The relative effect of recombination and mutation [54] was equal tor/m= (R/θ) ×δ×ν= 1.3 so that recombination introduced a similar number of substitutions as did mutation, which ex-plains the difference in the reconstructed scale. Apart from this important difference in the scale, the relative lengths of branches in the reconstructed phylogeny were approximately con-sistent with the correct genealogy. This is because the substitutions introduced by recombina-tion accumulate in the genomes in a clock-like manner, as do mutarecombina-tions. The most noticeable difference concerned some of the shortest terminal branches in the true clonal genealogy, which had lengths several times longer in the reconstructed phylogeny (see examples of this marked by red boxes inFig. 1B). The overestimation of these terminal branch lengths could have important consequences, for example it could mislead one into excluding the possibility of direct transmission between two infected individuals in a genomic epidemiology study [11,55–57].
example data, these were corrected by ClonalFrameML (red boxes inFig. 1C). One way to as-sess and compare the correctness of phylogenetic reconstructions is through a distance mea-sure between trees known as the branch score [58]. Between the true tree (Fig. 1A) and the ML reconstruction (Fig. 1B), the branch score was equal to 1.29×10⁻³whereas between the true
Figure 1. An example application of ClonalFrameML to a simulated dataset.(A) The clonal genealogy produced by simulation. (B) Maximum-likelihood reconstructed phylogeny. (C) ClonalFrameML reconstructed phylogeny. (D) Representation of recombination events along the genome for each branch of the genealogy in (A). True events are shown in blue and events detected by ClonalFrameML are shown in red. Three branches of interest and their associated recombination events are highlighted by red boxes.
tree (Fig. 1A) and the ClonalFrameML reconstruction (Fig. 1C), the branch score was lower, equal to 7.88×10⁻⁵. This large improvement is partly, but not exclusively, due to the difference
in scales between the trees. All three trees were rescaled to have a sum of branch lengths equal to one, and the two branch scores were then equal to 0.053 and 0.019, respectively. The true and in-ferred recombination events were compared for all branches of the clonal genealogy (Fig. 1D). All the exemplar terminal branches that were too long in the ML phylogeny corresponded to re-combination events that have been accurately detected by ClonalFrameML (red boxes inFig. 1). There were 248 real recombination events throughout the tree, and 213 (86%) of them were cor-rectly detected. The 35 events that were not detected tended to be short and to contain relatively few substitutions. All the detected recombination events corresponded to genuine events.
The original Monte-Carlo Markov Chain (MCMC) algorithm implemented in the ClonalFrame software [44] was applied to the same simulated dataset for comparison with ClonalFrameML. Each iteration of the MCMC took about 7.5 seconds. ClonalFrame was run for 20,000 iterations which took about 42 hours—more than a hundred times the time it took to run ClonalFrameML. The first half of the iterations were discarded as MCMC burn-in, and the second half were recorded every ten iterations to produce a sample of size 1000 from the posterior. Assessing MCMC convergence and mixing properties is always challenging, and the generally recommended method is to compare separate runs. Four separate runs were performed and found to yield comparable samples of the parameters (S1 Fig.). The four runs were combined to produce the following parameter estimates and 95% credibility inter-vals:R/θ= 0.056 [0.049–0.064],δ= 529.62 [464.47–603.50] andν= 0.0386 [0.0375–0.0398]. These estimates are in good agreement with both the correct values and the estimates from ClonalFrameML. The intervals of uncertainty, often seen as one of the great advantages of fully Bayesian methods, are also similar to the ones estimated using ClonalFrameML thus suggesting that our bootstrapping method is appropriate.
Evaluation of performance
The simulation and inference steps described above were repeated one hundred times to study the performance of ClonalFrameML under various conditions. Each simulation used different parameter values drawn uniformly on a log10scale forR/θbetween 0.01 and 10, forδbetween
100 and 10,000bp and forνbetween 0.01 and 0.1. The average running time of ClonalFrameML was 15 minutes on a standard desktop computer, with all runs taking less than an hour.
was often underestimated beyond that (Fig. 2). ClonalFrameML may therefore underestimate the recombination rate in situations where there has been so much recombination that it hap-pened several times over for some branches. A good indication of this is provided by the pres-ence of branches on which the whole genome has been found to be recombinant (S2 Fig.). This is a limitation of the original ClonalFrame model [44] rather than of the ML implementation presented here, but this has not been found to be a significant problem in practice, even in ap-plication to the highly recombinantHelicobacter pylori[59]. However, in such promiscuous species the signal of clonal inheritance is rapidly lost so that models of pure admixture may be more appropriate, such as the Structure and FineStructure models where linkage disequilibri-um is caused only by linkage along the genome [37,38].
The branch score [58] was calculated to compare both the ML trees and the ClonalFrameML trees against the correct tree used in each simulation whereδRwas below one. We found that the ClonalFrameML trees were closer to the true trees than the uncorrected ML trees in all re-maining simulations. The average branch score between the true and uncorrected ML trees was 7.47×10⁻³whereas it was 9.72×10⁻⁵between the true and ClonalFrameML trees (for full
comparative results seeS3 Fig.). A large part of this improvement is due to the fact that the overall scale of the ClonalFrameML tree is more accurate than that of the ML tree, as noted ear-lier. We repeated the comparison after normalizing all trees to have a sum of branch lengths
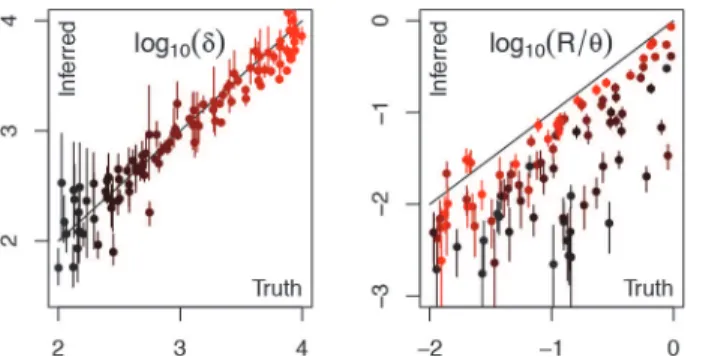
Figure 2. Comparison of correct parameter values with estimates from ClonalFrameML for a hundred datasets simulated under the ClonalFrame model.Dots represent the point estimates and bars the 95% confidence intervals. Colours represent the correct value of the compound parameterδRranging from 10−3 (black) to 102(red).
equal to one. The average branch score between the true and ML trees was then 4.81×10⁻²
compared with 1.68×10⁻²between the true and ClonalFrameML trees. There was therefore a
clear improvement in the estimated branch lengths beyond the correction in scale.
Application to simulated data with intra-population recombination
The ClonalFrame model considers that recombination events have an external source, so that they introduce substitution at a relatively high rate denotedν[44]. If the dataset contained ge-nomes covering the diversity of a whole bacterial species, there might be a few recombination events coming from other closely related species, but most events will have donors from the species under study, so that the main source of recombination is not external. This situation is best modelled by the coalescent with gene conversion [60], but drawing inference under the re-sulting ancestral recombination graph is a notoriously complex statistical problem [46,61,62]. Instead, here we consider the application of the ClonalFrame model of external recombination to analyse data simulated with within-population recombination.Simulation of sequence data under the coalescent with gene conversion is implemented in the software SimMLST [63], which was used to simulate a hundred different datasets, each consisting of 50 genomes of length 1Mb. Each simulation used a mutation rate ofθ= 10−3per
site, a ratio of recombination to mutation rateR/θsampled between 0.01 and 1, and an average length of recombined fragmentδsampled between 100 and 10,000bp, with these two samples being taken uniformly on a log10scale.
The correct and inferred values of the two parametersR/θandδwere compared for each simulation (Fig. 3). The estimates ofδwere unbiased and strongly reflected the correct values used in simulation. The relative recombination rateR/θwas also correlated with the correct values, but almost always underestimated. This bias was especially important when the recom-bination tract lengthδwas short, which typically resulted in an underestimation ofR/θby an order of magnitude. For longer values ofδon the other hand, the bias was smaller. In datasets where the bias was important, a good indication of this was provided by large confidence inter-vals around both estimates ofR/θandδ(Fig. 3). These performance characteristics fit with our expectations given the differences between the models used for simulation and inference. Since the simulated recombination events come from within the population of interest, they intro-duce fewer substitutions than if they had come from an external source, which makes them more difficult to detect. When these events are relatively short, they are likely to introduce very little polymorphism if any, so that a large fraction of them becomes impossible to detect. In these conditions, there is much uncertainty about the relative rate of recombinationR/θ. When
Figure 3. Comparison of correct parameter values with estimates from ClonalFrameML for a hundred datasets simulated under the coalescent with gene conversion model of intra-population
recombination.Dots represent the point estimates and bars the 95% confidence intervals. Colours represent the correct value of the parameterδranging from 102(black) to 104(red).
the events are longer they are easier to detect, but a fraction of them will still be impossible to detect, for example if their donor was a close relative of the recipient, leading to underestima-tion ofR/θ.
Application to
Clostridium difficile
ST6
Detection of transmission relies on the identification of closely related bacteria. Recombination events have the potential to mask recent transmission by inflating the genomic divergence be-tween closely related bacteria. In previous work the genomes of bacteria sampled from all cases ofClostridium difficileinfection reported in Oxfordshire between 2007 and 2011 were se-quenced to investigate the importance of transmission within hospitals [24,64]. To investigate the ability of ClonalFrameML to detect recombination in a transmission setting, we analysed 86 of these genomes sharing the same multi-locus sequence type, ST6. As previously described [24,64], these genomes were mapped to the complete sequence of reference genome CD630 [65]. However, ClonalFrameML can be equally well applied to a whole-genome alignment ob-tained from a de novo assembly approach. In a gene-by-gene approach, for example [66], one can scaffold local alignments using a reference genome to obtain a whole-genome alignment. ClonalFrameML took approximately 2 hours to run on our dataset. The average length of re-combined fragments was estimated to beδ= 591bp [528–691] and the average divergence be-tween donor and recipient wasν= 0.032 [0.031–0.033]. The ratio of rates of recombination and mutation wasR/θ= 0.30 [0.25–0.35], whereas the ratio of effects of recombination and mutation wasr/m= 5.67 [4.62–7.18]. This indicated that recombination happened three times less often than mutation, but because each recombination event introduced on averageδν= 19 substitutions, recombination overall caused six times more substitutions than mutation, con-firming the importance of recombination even in these closely related bacteria.
ClonalFrameML identified 167 recombination events on all branches of the clonal genealo-gy (Fig. 4). Three regions appeared to be possible hotspots of recombination, since we found multiple imports on several branches (up to seven) which would not be expected to happen by
Figure 4. Application of ClonalFrameML to 86 genomes ofC. difficileST6.For any branch of the genealogy and any position along the genome, inferred recombination is marked in blue.
chance if events were uniformly distributed along the genome for each branch. The first hot-spot spanned from 314kb to 315kb in CD630 and corresponded to the annotatedfliIgene [65]. This gene been described as one of only two integration sites for prophageFCD27 [67]. The
second hotspot, from position 600kb to 602kb, corresponded to thetetMgene which encodes a conjugative transposon tetracycline resistance protein [68]. The third hotspot, from position 1,307kb to 1313kb, contained several conjugal transfer proteins [65]. Recombination hotspots inC. difficileseem therefore to be caused by the presence of genomic mobile elements, as previ-ously reported for example inS. pneumoniae[30] andS. aureus[26].
Based on a measure of the within-host mutation rate, it was previously estimated that the di-vergence between twoC. difficilegenomes sampled from the donor and recipient of a direct transmission event would be at most two single nucleotide polymorphisms (SNPs) [64]. We compared the distance between all pairs of genomes in the ML tree and in the corrected Clonal-FrameML tree (S4 Fig.). Amongst the 86 genomes of ST6, there were 12 pairs for which the dis-tance was greater than 2 SNPs in the ML tree and lower than 2 SNPs once recombination had been accounted for in the ClonalFrameML tree (S4 Fig.), suggesting that they may represent cases of direct transmission. This result illustrates the importance of accounting for recombina-tion when performing genomic epidemiology investigarecombina-tions.
Application to
Staphylococcus aureus
Recombination is an important force in bacterial evolution and has played a role in shaping the population structure of many species [22,69], including those such asStaphylococcus aureusthat have otherwise been characterized as evolving clonally [26]. Although there is limited signal of re-combination within closely related lineages [15,70–74], analysis of species-wide diversity reveals evidence of widespread homoplasy in the genome [26]. Further, recombination has been shown to have played an important role in the emergence of certain lineages, notably the hospital-associated ST 34 and the globally distributed MRSA ST 239 [75,76]. STs 34 and 239 are hybrids resulting from large chromosomal replacement events. ST 34 is thought to have evolved from an ST 30 line-age via the introduction of a 244kb region from an ST 10 donor lineline-age [75]. ST 239 appears to have arisen from the integration of a 635kb region from an ST 30 donor into an ST 8 background [76]. In both hybrid lineages, the chromosomal replacements span the origin-of-replication.
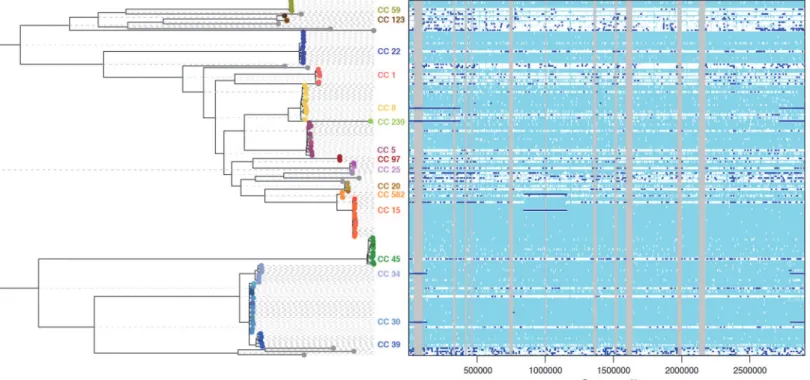
We applied ClonalFrameML to investigate 110S. aureuscarriage and reference genomes that represent species-wide diversity [26] using an extension to the standard ClonalFrame model that allows different recombination parameters to be inferred on different branches of the clonal gene-alogy. The mean parameters were estimated to beR/θ= 0.215,δ= 183bp andν= 7.20×10⁻³, but
substantial variation was detected between the branches of the tree (Fig. 5). In particular, large im-portations of 231kb and 555kb were detected, corresponding to the chromosomal replacements spanning the origin-of-replication in STs 34 and 239 respectively. Note that the positions and lengths of recombination events reported here are measured relative to the MRSA252 reference genome. Additionally, we found a new chromosomal replacement event of 310kb associated with ST 582, a close relative of ST 15. Unlike the previously described events, this large chromosomal replacement spans 845–1155kb, a region approximately 1Mb from the origin-of-replication. The nature and origin of this novel chromosomal replacement requires further investigation.
introduces DNA from a relative that does not possess these derived substitutions, then it becomes more parsimonious to attribute the mirrored substitutions to the sister clade rather than have them arise on the parent branch only to immediately revert them in the branch that receives the recombination event (S5 Fig.). This effect is likely to contribute to the well-recognized distortion of branch lengths leading to spurious inference of demography, selection and molecular clocks when phylogenetic methods are applied to recombining populations [27,28,77,78].
Conclusion
The advent of rapid, inexpensive whole genome sequencing is revealing more than ever the im-portance of recombination to bacteria. Accounting for recombination in phylogenetic analyses remains a fundamental yet challenging problem, and one that has become more difficult, not easier, with the volume of information provided by hundreds or thousands of bacterial whole genomes. We have introduced a new maximum likelihood method, ClonalFrameML, that im-plements the model underlying the popular Bayesian ClonalFrame approach in a computation-ally efficient manner, and we have demonstrated its ability to estimate recombination
parameters and detect importation events in the context of understanding short-term trans-mission dynamics and long-term bacterial evolution.
Availability and Future Directions
ClonalFrameML is freely available fromhttp://clonalframeml.googlecode.com/. Further work is planned to improve the front end, and to provide compatibility with the input files of the ClonalFrame software.
Figure 5. ClonalFrameML analysis of recombination inS. aureusbased on 110 genomes representing carriage and reference isolates mapped to MRSA252.Reconstructed substitutions (white vertical bars) are shown for each branch of the ML tree. Grey areas represent non-core regions of the MRSA252 genome. Dark blue horizontal bars indicate recombination events detected by the analysis.
Supporting Information
S1 Fig. Comparison of four runs of ClonalFrame on the first simulated dataset. (PDF)
S2 Fig. Example application of ClonalFrameML to a simulated dataset resulting in an un-derestimation of the recombination rate.True recombination events are shown in blue and events detected by ClonalFrameML are shown in red.
(PDF)
S3 Fig. Comparison of branch scores for a hundred datasets simulated under the Clonal-Frame model.The x-axis shows the branch score between true and ML tree, whereas the y-axis shows the branch score between true and ClonalFrameML tree. In the right panel all trees have been normalized to have a sum of branch lengths equal to one.
(PDF)
S4 Fig. Comparison of the distances between pairs of genomes in the maximum likelihood tree and in the ClonalFrameML tree for theC. difficileapplication.
(PDF)
S5 Fig. Recombination causes homoplasy and mirroring in phylogenetic trees.The branches of a simplified tree representingS. aureusSTs 15, 582, and 20 together with an out-group representing all other lineages are labelled A-E. A recombination event from ST 20 to ST 582 is labelled R. Below, patterns of genetic diversity are represented for mutations arising on branches A-E in the absence of recombination (clonal sites). Recombined sites show the effect of the recombination event R on patterns of diversity. Mutation events occurring on branch D are imported into lineage A, leading to homoplasy. Mutation events that occurred on branch B are displaced by the recombination event, leading to a spurious pattern resembling mutation on branch E, which we refer to as mirroring.
(PDF)
S1 Text. Instructions for installing the software and analysing the example dataset. (PDF)
S1 Table. Table of mathematical notation. (DOC)
Author Contributions
Conceived and designed the experiments: XD DJW. Performed the experiments: XD DJW. An-alyzed the data: XD DJW. Contributed reagents/materials/analysis tools: XD DJW. Wrote the paper: XD DJW.
References
1. Didelot X, Bowden R, Wilson DJ, Peto TEA, Crook DW (2012) Transforming clinical microbiology with bacterial genome sequencing. Nat Rev Genet 13: 601–612. doi:10.1038/nrg3226PMID:22868263
2. Köser CU, Ellington MJ, Cartwright EJP, Gillespie SH, Brown NM, et al. (2012) Routine Use of Microbial Whole Genome Sequencing in Diagnostic and Public Health Microbiology. PLoS Pathog 8: e1002824. doi:10.1371/journal.ppat.1002824PMID:22876174
3. Jolley K, Bliss CM, Bennett JS, Bratcher HB, Brehony CM, et al. (2012) Ribosomal Multi-Locus Se-quence Typing: universal characterisation of bacteria from domain to strain. Microbiology 158: 1005–
1015. doi:10.1099/mic.0.055459-0. PMID:22282518
5. Laabei M, Recker M, Rudkin JK, Aldeljawi M, Gulay Z, et al. (2014) Predicting the virulence of MRSA from its genome sequence. Genome Res 24: 839–849. doi:10.1101/gr.165415.113PMID:24717264
6. Dingle KE, Elliott B, Robinson E, Griffiths D, Eyre DW, et al. (2014) Evolutionary History of the Clostridi-um difficilePathogenicity Locus. Genome Biol Evol 6: 36–52. doi:10.1093/gbe/evt204PMID: 24336451
7. Stoesser N, Batty EM, Eyre DW, Morgan M, Wyllie DH, et al. (2013) Predicting antimicrobial susceptibil-ities forEscherichia coliandKlebsiella pneumoniaeisolates using whole genomic sequence data. J Antimicrob Chemother 68: 2234–2244. doi:10.1093/jac/dkt180PMID:23722448
8. Gordon NC, Price JR, Cole K, Everitt R, Morgan M, et al. (2014) Prediction ofStaphylococcus aureus
antimicrobial resistance by whole-genome sequencing. J Clin Microbiol 52: 1182–1191. doi:10.1128/ JCM.03117-13PMID:24501024
9. Young BC, Golubchik T, Batty EM, Fung R, Larner-Svensson H, et al. (2012) Evolutionary dynamics of
Staphylococcus aureusduring progression from carriage to disease. Proc Natl Acad Sci USA 109: 4550–4555. doi:10.1073/pnas.1113219109PMID:22393007
10. Golubchik T, Batty EM, Miller RR, Farr H, Young BC, et al. (2013) Within-Host Evolution of Staphylo-coccus aureusduring Asymptomatic Carriage. PLoS One 8: e61319. doi:10.1371/journal.pone. 0061319PMID:23658690
11. Walker TM, Ip CLC, Harrell RH, Evans JT, Kapatai G, et al. (2013) Whole-genome sequencing to delin-eateMycobacterium tuberculosisoutbreaks: a retrospective observational study. Lancet Infect Dis 13: 137–146. doi:10.1016/S1473-3099(12)70277-3PMID:23158499
12. Walker TM, Lalor MK, Broda A, Ortega LS, Morgan M, et al. (2014) Assessment ofMycobacterium tu-berculosistransmission in Oxfordshire, UK, 2007–12, with whole pathogen genome sequences: an ob-servational study. Lancet Respir Med 2: 285–292. doi:10.1016/S2213-2600(14)70027-XPMID: 24717625
13. Eyre DW, Golubchik T, Gordon NC, Bowden R, Piazza P, et al. (2012) A pilot study of rapid benchtop sequencing ofStaphylococcus aureusandClostridium difficilefor outbreak detection and surveillance. BMJ Open 2: e001124. doi:10.1136/bmjopen-2012-001124PMID:22674929
14. Mutreja A, Kim DW, Thomson NR, Connor TR, Lee JH, et al. (2011) Evidence for several waves of glob-al transmission in the seventh cholera pandemic. Nature 477: 462–465. doi:10.1038/nature10392 PMID:21866102
15. Holden MTG, Hsu L-Y, Kurt K, Weinert LA, Mather AE, et al. (2013) A genomic portrait of the emer-gence, evolution and global spread of a methicillin resistantStaphylococcus aureuspandemic. Ge-nome Res 23: 653–664. doi:10.1101/gr.147710.112PMID:23299977
16. Guindon S, Dufayard J-F, Lefort V, Anisimova M, Hordijk W, et al. (2010) New algorithms and methods to estimate maximum-likelihood phylogenies: assessing the performance of PhyML 3.0. Syst Biol 59: 307–321. doi:10.1093/sysbio/syq010PMID:20525638
17. Stamatakis A (2006) RAxML-VI-HPC: maximum likelihood-based phylogenetic analyses with thou-sands of taxa and mixed models. Bioinformatics 22: 2688–2690. doi:10.1093/bioinformatics/btl446 PMID:16928733
18. Price MN, Dehal PS, Arkin AP (2010) FastTree 2—approximately maximum-likelihood trees for large alignments. PLoS One 5: e9490. doi:10.1371/journal.pone.0009490PMID:20224823
19. Drummond AJ, Rambaut A (2007) BEAST : Bayesian evolutionary analysis by sampling trees. BMC Evol Biol 7: 214. doi:10.1186/1471-2148-7-214PMID:17996036
20. Ronquist F, Teslenko M, van der Mark P, Ayres DL, Darling A, et al. (2012) MrBayes 3.2: efficient Bayesian phylogenetic inference and model choice across a large model space. Syst Biol 61: 539–
542. doi:10.1093/sysbio/sys029PMID:22357727
21. Didelot X, Maiden MCJ (2010) Impact of recombination on bacterial evolution. Trends Microbiol 18: 315–322. doi:10.1016/j.tim.2010.04.002PMID:20452218
22. Ochman H, Lawrence JG, Groisman EA (2000) Lateral gene transfer and the nature of bacterial innova-tion. Nature 405: 299–304. doi:10.1038/35012500PMID:10830951
23. Vos M, Didelot X (2009) A comparison of homologous recombination rates in bacteria and archaea. ISME J 3: 199–208. doi:10.1038/ismej.2008.93PMID:18830278
24. Didelot X, Eyre DW, Cule M, Ip CLC, Ansari MA, et al. (2012) Microevolutionary analysis ofClostridium difficilegenomes to investigate transmission. Genome Biol 13: R118. doi: 10.1186/gb-2012-13-12-r118PMID:23259504
26. Everitt RG, Didelot X, Batty EM, Miller RR, Knox K, et al. (2014) Mobile elements drive recombination hotspots in the core genome ofStaphylococcus aureus. Nat Commun 5: 3956. doi:10.1038/ ncomms4956PMID:24853639
27. Schierup MH, Hein J (2000) Consequences of recombination on traditional phylogenetic analysis. Ge-netics 156: 879–891. PMID:11014833
28. Schierup MH, Hein J (2000) Recombination and the Molecular Clock. Mol Biol Evol 17: 1578–1579. PMID:11018163
29. Posada D, Crandall K (2002) The effect of recombination on the accuracy of phylogeny estimation. J Mol Evol 54: 396–402. doi:10.1007/s00239PMID:11847565
30. Croucher NJ, Harris SRR, Fraser C, Quail MA, Burton J, et al. (2011) Rapid pneumococcal evolution in response to clinical interventions. Science 331: 430–434. doi:10.1126/science.1198545PMID: 21273480
31. Didelot X, Achtman M, Parkhill J, Thomson NR, Falush D (2007) A bimodal pattern of relatedness be-tween theSalmonellaParatyphi A and Typhi genomes: Convergence or divergence by homologous re-combination? Genome Res 17: 61–68. doi:10.1101/gr.5512906.1PMID:17090663
32. Sheppard SK, Mccarthy ND, Falush D, Maiden MCJ (2009) Convergence ofCampylobacterSpecies : Implications for Bacterial Evolution. Science 320: 237–239. doi:10.1126/science.1155532PMID: 18403712
33. Sheppard SK, Didelot X, Jolley KA, Darling AE, Pascoe B, et al. (2013) Progressive genome-wide intro-gression in agriculturalCampylobacter coli. Mol Ecol 22: 1051–1064. doi:10.1111/mec.12162PMID: 23279096
34. Dingle KE, Didelot X, Ansari MA, Eyre DW, Vaughan A, et al. (2013) Recombinational switching of the
Clostridium difficileS-layer and a novel glycosylation gene cluster revealed by large scale whole ge-nome sequencing. J Infect Dis 207: 675–686. doi:10.1093/infdis/jis734PMID:23204167
35. Kennemann L, Didelot X, Aebischer T, Kuhn S, Drescher B, et al. (2011)Helicobacter pylorigenome evolution during human infection. Proc Natl Acad Sci USA 108: 5033–5038. doi:10.1073/pnas. 1018444108PMID:21383187
36. Didelot X, Nell S, Yang I, Woltemate S, van der Merwe S, et al. (2013) Genomic evolution and transmis-sion ofHelicobacter pyloriin two South African families. Proc Natl Acad Sci USA 110: 13880–13885. doi:10.1073/pnas.1304681110PMID:23898187
37. Yahara K, Furuta Y, Oshima K, Yoshida M, Azuma T, et al. (2013) Chromosome Painting In Silico in a Bacterial Species Reveals Fine Population Structure. Mol Biol Evol 30: 1454–1464. doi:10.1093/ molbev/mst055PMID:23505045
38. Falush D, Wirth T, Linz B, Pritchard JK, Stephens M, et al. (2003) Traces of human migrations in Helico-bacter pyloripopulations. Science 299: 1582–1585. doi:10.1126/science.1080857PMID:12624269
39. Croucher NJ, Finkelstein JA, Pelton SI, Mitchell PK, Lee GM, et al. (2013) Population genomics of post-vaccine changes in pneumococcal epidemiology. Nat Genet 45: 656–663. doi:10.1038/ng.2625 PMID:23644493
40. Golubchik T, Brueggemann AB, Street T, Gertz RE, Spencer C, et al. (2012) Pneumococcal genome sequencing tracks a vaccine escape variant formed through a multi-fragment recombination event. Nat Genet 44: 352–355. doi:10.1038/ng.1072PMID:22286217
41. Milkman R, Bridges MM (1990) Molecular Evolution of theEscherichia coliChromosome. III. Clonal Frames. Genetics 126: 505–517. PMID:1979037
42. Guttman DS (1997) Recombination and clonality in natural populations ofEscherichia coli. Trends Ecol Evol 12: 16–22. PMID:21237956
43. Didelot X, Urwin R, Maiden MCJ, Falush D (2009) Genealogical typing ofNeisseria meningitidis. Micro-biology 155: 3176–3186. doi:10.1099/mic.0.031534-0PMID:19643763
44. Didelot X, Falush D (2007) Inference of bacterial microevolution using multilocus sequence data. Ge-netics 175: 1251–1266. doi:10.1534/genetics.106.063305PMID:17151252
45. Maiden MC, Bygraves JA, Feil EJ, Morelli G, Russell JE, et al. (1998) Multilocus sequence typing: a portable approach to the identification of clones within populations of pathogenic microorganisms. Proc Natl Acad Sci USA 95: 3140–3145. PMID:9501229
46. Ansari MA, Didelot X (2014) Inference of the Properties of the Recombination Process from Whole Bac-terial Genomes. Genetics 196: 253–265. doi:10.1534/genetics.113.157172PMID:24172133
48. Jolley K, Wilson DJ, Kriz P, McVean G, Maiden M (2005) The influence of mutation, recombination, population history, and selection on patterns of genetic diversity inNeisseria meningitidis. Mol Biol Evol 22: 562–569. doi:10.1093/molbev/msi041PMID:15537808
49. Wilson DJ, Gabriel E, Leatherbarrow AJH, Cheesbrough J, Gee S, et al. (2009) Rapid evolution and the importance of recombination to the gastroenteric pathogenCampylobacter jejuni. Mol Biol Evol 26: 385–397. doi:10.1093/molbev/msn264PMID:19008526
50. Pupko T, Pe’er I, Shamir R, Graur D (2000) A fast algorithm for joint reconstruction of ancestral amino acid sequences. Mol Biol Evol 17: 890–896. PMID:10833195
51. Hedge J, Wilson DJ. (2014). Bacterial phylogenetic reconstruction from whole genomes is robust to re-combination but demographic inference is not. mBio 5(6): e02158-14. doi: 10.1128/mBio.02158-14 PMID:25425237
52. Durbin R, Eddy S, Krogh A, Mitchison G (1998) Biological Sequence Analysis: Probabilistic Models of Proteins and Nucleic Acids. Cambridge: Cambridge University Press.
53. Hasegawa M, Kishino H, Yano T (1985) Dating of the human-ape splitting by a molecular clock of mito-chondrial DNA. J Mol Evol 22: 160–174. PMID:3934395
54. Kingman JFC (1982) The coalescent. Stoch Process their Appl 13: 235–248. doi:10.1016/0304-4149 (82)90011-4
55. Guttman D, Dykhuizen D (1994) Clonal Divergence inEscherichia colias a Result of Recombination, Not Mutation. Science 266: 1380–1383. PMID:7973728
56. Grad YH, Kirkcaldy RD, Trees D, Dordel J, Harris SR, et al. (2014) Genomic epidemiology ofNeisseria gonorrhoeaewith reduced susceptibility to cefixime in the USA: a retrospective observational study. Lancet Infect Dis 14: 220–226. doi:10.1016/S1473-3099(13)70693-5PMID:24462211
57. Didelot X, Gardy J, Colijn C (2014) Bayesian inference of infectious disease transmission from whole genome sequence data. Mol Biol Evol 31: 1869–1879. doi:10.1093/molbev/msu121PMID:24714079
58. Harris SR, Cartwright EJP, Török ME, Holden MTG, Brown NM, et al. (2013) Whole-genome sequenc-ing for analysis of an outbreak of meticillin-resistantStaphylococcus aureus: a descriptive study. Lancet Infect Dis 13: 130–136. doi:10.1016/S1473-3099(12)70268-2PMID:23158674
59. Kuhner MK, Felsenstein J (1994) A simulation comparison of phylogeny algorithms under equal and unequal evolutionary rates. Mol Biol Evol 11: 459–468. PMID:8015439
60. Moodley Y, Linz B, Yamaoka Y, Windsor HM, Breurec S, et al. (2009) The peopling of the Pacific from a bacterial perspective. Science 323: 527–530. doi:10.1126/science.1166083PMID:19164753
61. Wiuf C, Hein J (2000) The coalescent with gene conversion. Genetics 155: 451–462. PMID:10790416
62. McVean GAT, Cardin NJ (2005) Approximating the coalescent with recombination. Philos Trans R Soc Lond B Biol Sci 360: 1387–1393. doi:10.1098/rstb.2005.1673PMID:16048782
63. Didelot X, Lawson DJ, Darling AE, Falush D (2010) Inference of homologous recombination in bacteria using whole-genome sequences. Genetics 186: 1435–1449. doi:10.1534/genetics.110.120121PMID: 20923983
64. Didelot X, Lawson DJ, Falush D (2009) SimMLST: simulation of multi-locus sequence typing data under a neutral model. Bioinformatics 25: 1442–1444. doi:10.1093/bioinformatics/btp145PMID: 19286834
65. Eyre DW, Cule ML, Wilson DJ, Griffiths D, Vaughan A, et al. (2013) Diverse Sources ofC. difficile Infec-tion Identified on Whole-Genome Sequencing. N Engl J Med 369: 1195–1205. doi:10.1056/
NEJMoa1216064PMID:24066741
66. Sebaihia M, Wren BW, Mullany P, Fairweather NF, Minton N, et al. (2006) The multidrug-resistant human pathogenClostridium difficilehas a highly mobile, mosaic genome. Nat Genet 38: 779–786. doi:10.1038/ng1830PMID:16804543
67. Maiden MCJ, Jansen van Rensburg MJ, Bray JE, Earle SG, Ford SA, et al. (2013) MLST revisited: the gene-by-gene approach to bacterial genomics. Nat Rev Microbiol 11: 728–736. doi:10.1038/ nrmicro3093PMID:23979428
68. Williams R, Meader E, Mayer M, Narbad A, Roberts AP, et al. (2013) Determination of the attP and attB sites of phage CD27 fromClostridium difficileNCTC 12727. J Med Microbiol 62: 1439–1443. doi:10. 1099/jmm.0.058651-0PMID:23699063
69. Ternan NG, Jain S, Srivastava M, McMullan G (2012) Comparative transcriptional analysis of clinically relevant heat stress response inClostridium difficilestrain 630. PLoS One 7: e42410. doi:10.1371/ journal.pone.0042410PMID:22860125
71. Harris SRR, Feil EJ, Holden MT, Quail MA, Nickerson EK, et al. (2010) Evolution of MRSA During Hos-pital Transmission and Intercontinental Spread. Science 327: 469–474. doi:10.1126/science.1182395 PMID:20093474
72. Castillo-Ramírez S, Corander J, Marttinen P, Aldeljawi M, Hanage WP, et al. (2012) Phylogeographic variation in recombination rates within a global clone of methicillin-resistantStaphylococcus aureus. Genome Biol 13: R126. doi:10.1186/gb-2012-13-12-r126PMID:23270620
73. Strommenger B, Bartels MD, Kurt K, Layer F, Rohde SM, et al. (2014) Evolution of methicillin-resistant
Staphylococcus aureustowards increasing resistance. J Antimicrob Chemother 69: 616–622. doi:10. 1093/jac/dkt413PMID:24150844
74. Kurt K, Rasigade J-P, Laurent F, Goering R V,Žemličková H, et al. (2013) Subpopulations of Staphylo-coccus aureusclonal complex 121 are associated with distinct clinical entities. PLoS One 8: e58155. doi:10.1371/journal.pone.0058155PMID:23505464
75. Miller RM, Price JR, Batty EM, Didelot X, Wyllie D, et al. (2014) Healthcare-associated outbreak of meti-cillin-resistantStaphylococcus aureusbacteraemia: role of a cryptic variant of an epidemic clone. J Hosp Infect 86: 83–89. doi:10.1016/j.jhin.2013.11.007PMID:24433924
76. Robinson DA, Enright MC (2004) Evolution ofStaphylococcus aureusby large chromosomal replace-ments. J Bacteriol 186: 1060. doi:10.1128/JB.186.4.1060PMID:14762000
77. Holden MTG, Lindsay JA, Corton C, Quail MA, Cockfield JD, et al. (2010) Genome sequence of a re-cently emerged, highly transmissible, multi-antibiotic- and antiseptic-resistant variant of methicillin-re-sistantStaphylococcus aureus, sequence type 239 (TW). J Bacteriol 192: 888–892. doi:10.1128/JB. 01255-09PMID:19948800
78. Anisimova M, Nielsen R, Yang Z (2003) Effect of recombination on the accuracy of the likelihood meth-od for detecting positive selection at amino acid sites. Genetics 164: 1229–1236. PMID:12871927