Grid Integration of Large PV Power Systems Using HVDC Link
Gamal Sowilam
*, Tamer Kawady
**and Raed Shalwala
****Umm Al-Qura University, Faculty of Eng. & Islamic Architecture Saudi Arabia / Helwan university, Faculty of Engineering, Egypt.
**Umm Al-Qura University, Faculty of Eng. & Islamic Architecture Saudi Arabia / Minoufiya University, Faculty of Engineering, Egypt.
*** Umm Al-Qura University, Faculty of Eng. & Islamic Architecture Saudi Arabia.
ABSTRACT
This paper explores the interconnection of large scale Photo-Voltaic (PV) systems to the grid though a High Voltage Direct Current (HVDC) link. HVDC link is recently utilized for transmission lines longer than 50 km. It is usually utilized to interconnect two asynchronous grids with the same or different frequencies while avoiding stability disturbances greatly. A suitable Maximum Power Point Tracking (MPPT) techniques is employed to control the performance of the integrated PV system. The system of the HVDC link has two 12-pulse converter using thyristor-bridges. The delay and the extinction angles at the rectifier and the inverter units control the flow and the quantity of the transmitted power from the PV system into the grid. Fixed capacitors and filters are used to provide the AC side with the required reactive power and reduce the harmonic contents. For evaluation purposes, different simulation investigations are carried out with a detailed modeling using the MATLAB. These tests corroborate the efficacy of HVDC link for integrating large PV systems to electrical grids.
Keywords:
PV power plant, HVDC link, Grid Integration, Bipolar link, 12-pulse rectifier, 12-pulse inverter,
PWM inverter, DC boost choppersI.
INTRODUCTION
Due to the increasing exhausting of fossil fuels and the exaggerated demands of energy resources in the world, renewable energy resources have nowadays an increasing importance. This encourages the research efforts in different countries all over the world to declare their own targets of penetrating levels of renewable energy systems in the future. As example, the European Union has set its target of renewable energy generation to be over 32% of its total generated power by 2030 [1]. Among the most common renewable energy resources, solar energy arises as the most practical and suitable one for almost all countries. Solar PV systems are the matured and financially viable option for power generation [2]. Large integrated PV power plants are mostly utilized nowadays to be connected to the transmission (or sub-transmission) level. As reviewed in the literatures, PV power plants experience a sharper growth of their penetration levels as compared with wind power resources from 2010 to present [3]. For Saudi Arabia in particular, a 16 GW of grid-integrated PV power plants is a national target up to 2032.
On the other hand, different kinds of problems arise with integrating PV systems to the grid as compared with the experienced ones with conventional power plants. The fluctuation of PV output power due to the variation of solar irradiance is one of the major problems for grid integration [4, 5]. This impacts the electrical grid remarkably. Among these serious impacts, the PV plants may
adversely influence the dispatch strategies, the spinning reserve routines, voltage stability and angular stability [6-9]. Hence, eliminating such problems is essential in modern power grids.
Gang Liu el. al. present a feasibility study of PV, wind, biomass and battery storage based Hybrid Renewable Energy (HRE) systems providing the electricity to a residential area in Australia [10]. Characterization of the waveform distortion during the operation of grid-connected PV inverters was investigated with recorded and experimental measurements by Schlabbach et. al. as shown in [11, 12]. Carbone [13] introduced the use of energy storage tools in grid-connected PV power plants. Energy storage batteries (installed in a distributed manner) can improve the energy production of grid-connected PV power plants. It therefore represents a valid alternative to other technical solutions such as the distributed active MPPTs based on a number of DC/AC or DC-DC power electronic converters. As seen in [14, 15], a DC-DC boost converter was utilized for integrating PV arrays, Fuel Cell (FC) stack and batteries as input power sources in a unified structure. In this structure, each switching cycle of the proposed boost converter is divided into five switching periods in comparison with the conventional structure. These switching periods introduce five different duty ratios for the proposed boost converter. Because the summation of these duty ratios should be equal, achieving a high level output voltage at the DC-link is not possible. Petra
Solar’s Generator Emulation Controls (GEC)
technology equipped DG inverters with voltage support through Volt/VAR drop, low-voltage
ride-through (LVRT), and micro grid forming
capabilities as described in [16]. Khalifa el. al. [17] proposed a control methodology for interfacing medium and large PV arrays to the power system distribution grid. It consists of a PV array in addition to a power conditioning system for grid interfacing purposes. The power conditioning system is composed of a DC-DC boost converter followed by a current controlled Voltage Source Inverter (VSI). The system was controlled to inject a clean sinusoidal current into the grid.
Marinopoulos and Bakas [18] presented four different system configurations for large scale PV systems with a typical system configuration of central inverters and medium voltage transformers as a reference. Other three alternatives were proposed including high power DC-DC converters connected in series or in parallel and cascaded DC/AC
inverters. Taking into account the current
developments in energy storage, new possibilities for combining PV systems with energy storage units for large scale power plants are now available. The output power characteristics of combining both PV arrays and wind turbines were also introduced. The perturbation and observation method is used to accomplish the maximum power point tracking algorithm for such input sources. The operation principle of the proposed multi-input inverters is explained as well.
In this paper, integrating large PV power plants into the grid via a HVDC link is tested and validated via a detailed dynamic simulation using the MATLAB. This well-known package is considered as an ideal candidate for simulating complicated power systems with its built-in models and rich libraries [19]. This integration methodology facilitates connecting large PV power plants to the transmission (or sub-transmission) level while eliminating the possible serious problems regarding the stability and power control issues. First, the selected system study is described in the next section. Then, a thorough investigation study is presented for investigating the performance of HVDC link in integrating large PV power plants to the power grid.
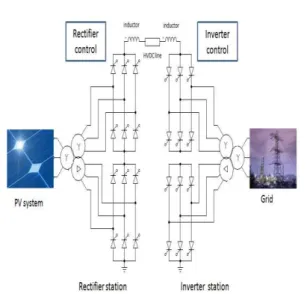
Fig. 1. The schematic diagram of the proposed system.
II.
DESCRIPTION
OF
THE
SELECTED
SIMULATION
SYSTEM
In order to investigate the performance of integrating large PV power plants into the grid, a 38MW PV power plant is considered as a simulation example. The simulated PV plant is integrated to the 220kV grid system through a HVDC link. A schematic diagram of overall system is shown in Fig. 1. It consists of three sub-systems including the PV sub-system, the HVDC link and the grid. A typical 3.2MW PV string containing 10 units of a 320kW array is connected as described in Fig. 2. A Boost DC chopper is dedicated with each 320kW PV array, where its data was listed in Appendix A. The boost converter is controlled with a MPPT technique in order to obtain the maximum power from each array. The complete simulated PV system consisted of twelve units of the 3.2 MW string to obtain a maximum power of 38.4 MW.
10 unit*320kW PV string
320kW PV array
320kW PV array
320kW PV array
320kW PV array
Boost DC Chopper U p to 1 0 un its To Inverter
Fig. 2. Arrangement of the selected 3.2 MW PV system.
The converter unit is composed of two 6-pulse converters connected in series. Both series converters at the rectifier station are connected via a smoothing reactor, while another two series ones are in opposite polarities to form the inverter station. Each converter is supplied through a (Y-earthed/Y) and (Y-earthed/) transformers (or via a three winding transformer with Y-earthed primary and both secondary's are of Y and respectively). These transformers act as a 30o phase shift for the AC voltage of the secondary sides between the Y and sides to produce the required 12-pulse rectifier system. Also it can boost the average output voltage more than the corresponding voltage of the monopolar-link. In order to reduce the ripples and the harmonic contents of the orders (5th, 7th, 11th and 13th) that are accompanied with the voltage waveforms, dedicated filters can be used. The ratings of the rectifier station transformer is 40MVA, 50Hz and 22kV/220kV/220kV, while the grid is with 220 kV and 60Hz. The length of HVDC link is 100km. 3.2MW PV system Three-Phase PWM Inverter 3.2MW PV system 3.2MW PV system 3.2MW PV system 3.2MW PV system U p t o 1 2 u ni ts Three-Phase PWM Inverter Three-Phase PWM Inverter Three-Phase PWM Inverter U p t o 1 2 u ni ts Three-Phase PWM Inverter Y
To HVDC Link
Rectifier Side (a) 3.2MW PV system 3.2MW PV system 3.2MW PV system 3.2MW PV system 3.2MW PV system Up t o 12 un its Three-Phase
PWM Inverter
To HVDC Link
Rectifier Side
Y
Control of inverter using regular sampled asymmetrical-double Edge
PWM
(b)
Fig. 3. (a) Description of the utilized inverters (a)
Configuration of the 38MW PV system with 12-inverters. (b) Configuration of the 38MW PV system
central inverter.
The control of the power can be achieved by controlling the firing angles of the rectifier station, where the rectifier operates in the
rectification mode with 0 90 . The extinction
angle of the inverter station, where the rectifier can operate in the inverter mode with the firing angle lying in a range of 90 < <180 . These firing angles are varied to examine the system performance and the characteristics of the HVDC system. Then, the effect of varying the irradiance of the PV power plant in addition to the change of the angles α and should be thoroughly investigated.
Rectifier Inverter R Grid AC1 -Rci Rcr V dor c os α V dr V di + +
-
-+ +-
-DC line V doi c os γ
Fig. 4. Two terminal DC network.
III.
DESCRIPTION
OF
THE
HVDC
CONTROL
DC line etc. [11]. Using Ohm’s law, the DC current in the DC link depicted in the aforementioned figure is given by equation (1).
(1)
Where
Vdr is DC-voltage output of the rectifier Vdi is DC-voltage output of the inverter R is the DC line resistance.
The power at the rectifier side of DC link is given by equation (2).
Pdr=Vdr Id (2)
The power at the inverter side of DC link is given by equation (3).
Pdi=Vdi Id (3)
From the converter theory, the relationships Vd-Id for the rectifier and the inverter are given by equations (4) and (5) as,
Vdr = Vdorcos α – Rcr Id (4)
Vdi = Vdoicos γ - RciId (5)
where Rcr and Rci depend on the overlap
angles at the rectifier and the inverter respectively. If the overlap angles is zero, their associated voltage drop equal to zero with overlap, Rcr equals to
3XcrId/ and Rci equals to 3XciId/. Id is the DC
current and Xcr is the commutation reactance (of the
HVDC transformer) at the rectifier. Xci is the
commutation reactance of the inverter.
Vdor = 1.35 VLr is the maximum DC voltage
of rectifier with firing angle =0. VLr is the rms
value of line input voltage of the rectifier, while Vdoi
=1.35 VLi is the maximum DC voltage for the inverter with γ=0 and VLi is the rms value of line
input voltage of the inverter. Using the equations describing Vdr and Vdi the DC line current is given
by either one of two options depending upon the choice of the control mode at the inverter:
Id = (Vdorcos α – Vdoi cos γ) / (Rcr + R - Rci) (6)
The DC output power of the rectifier and inverter are given by equations 7 and 8. Those equations shows the power transmitted depending on the Vdor, Vdoi, , γ and the DC current.
(7)
(8)
The reactive power is absent inside HVDC link, therefore the using of fixed capacitors and filters at each AC side to supplemented the reactive power as mentioned before.
The best choice select γ =180- is to reduce the voltage drop between output of the rectifier and the input of inverter inside the HVDC link.
IV.
APPLIED
SIMULATION
TESTS
Different test cases were applied using the developed dynamic simulation of the selected system in MATLAB. A constant solar irradiance was first considered. Then, the effects of varying the solar irradiance was extensively investigated. Also, the influences of a sudden change of the firing angle was tested. During these tests, the boost converters were controlled with a MPPT routine with an initial duty cycle of 0.4. The PV inverter operates at 50Hz modulation frequency and with a frequency ratio of 33. It has a modulation depth of 0.95 with a regular
sampled asymmetrical-double Edge PWM
technique.
4.1 Constant Solar Irradiance (Constant And
)
The behavior of the simulated system was illustrated in Fig. 5 at a constant solar irradiance of 1000W/m2 with a firing angle of the rectifier station of 35o and an extinction angle of 145o. The frequency of the rectifier station was 50Hz and the frequency of the inverter station was 60Hz. The MPPT routine was initiated after 0.5 sec. The resulting waveforms for the corresponding voltages,
currents, active and reactive power were
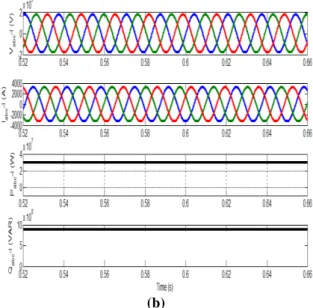
demonstrated in Fig. 5(a) generating a total power of 32 MW. Zooming the resulting quantities raises a pure sinusoidal of both voltages and currents as shown in Fig. 5(b).
(b)
Fig. 5 System performance at the inverter station (Grid side) with a solar irradiance of 1000W/m2,
α=35o and = 145o.
(a) Voltage, current and power measurement (b) Zoomed outputs at the inverter
station (Grid side) with a solar irradiance of
1000W/m2, α=35o
and = 145o.
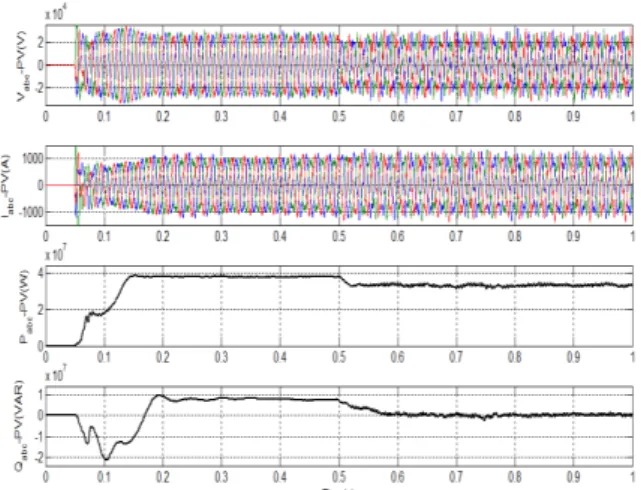
The measured DC voltage and current of the HVDC link was demonstrated in Fig. 6 having a DC voltage of 535 kV with approximated current of 60A. Fig. 7 emphasized the performance of the PV system with a three phase voltage of 22 kV and 36 MW after 0.2 second only. The variation of the resulting active power at different points of the simulated system was demonstrated in Fig. 8. The power at the gird side was reduced by the amount of the losses in the converter stations, the boost converter, the PV converter and the DC line with a total accumulated power losses of 3 MW.
Fig. 6 Rectifier DC voltage, DC current and inverter dc voltage with a solar irradiance of 1000W/m2,
α=35o
and = 145o.
Fig. 7 PV performance with a solar irradiance of 1000W/m2, α=35o and = 145o.
Fig. 8 Measured power variation at overall system with a solar irradiance of 1000W/m2, α=35o and
=145o.
4.2 Sudden Change Of The Solar Irradiance
With Constant α and
The solar irradiance was suddenly changed from 1000 W/m2 to 600 W/m2 after 0.5 sec. with a
constant α and at 35o and 145o respectively. As illustrated in Fig. 9, the resulting active power was remarkably reduced, while the corresponding DC current of the HVDC link was also reduced from 60A to 25A as illustrated in Fig. 10.
Fig. 9 Performance at the Grid-side for a sudden change of the solar irradiance from 1000W/m2 to
Fig. 10 Performance at the DC link for a sudden change of the solar irradiance from 1000W/m2 to
600W/m2 with constant α and .
Similarly, Fig. 11 illustrated the
performance of the PV system showing the reduction of its currents, active power and reactive power.
4.3 A Sudden Change of With Constant Solar Irradiance and
In order to investigate the effects of
controlling the firing angle of the rectifier station, α
was suddenly changed from 35o to 50o while keeping the solar irradiance and the angle constant at 1000W/m2 and 145o respectively. Fig. 12 shows the grid performance during this condition, where both voltages and currents were almost constant. On the other hand, the resulting active power was slightly reduced as a function on the firing angle α. Fig. 13 shows the performance of the HVDC link, where the DC voltages at rectifier and inverter stations were not changed. However, the DC current
is reduced depending on the value of firing angle α.
This, therefore, affects the measured power after the rectifier station as shown in Fig. 14.
Fig. 11 PV system performance for a sudden change of the solar irradiance from 1000W/m2 to 600W/m2
with constant α and.
Fig. 12 Grid side performance for a sudden change
of α from 35o
to 50o with constant solar irradiance and .
Fig. 13 Performance of HVDC link for a sudden
change in α from 350
to 50o with constant solar irradiance and.
Fig. 14 Power measurement for a sudden change in
α from 350
to 50o with constant solar irradiance and.
Fig. 15 Performance of PV system for a sudden
change in α from 350
to 50o with constant solar irradiance and .
4.4 Severe Test with Time Varying Solar Radiation
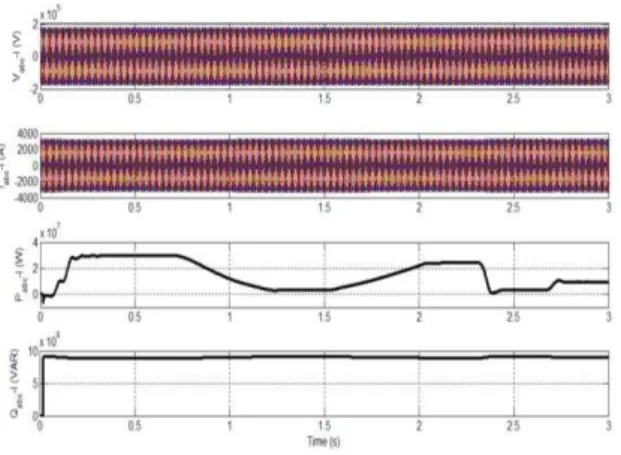
The overall PV system was subjected to a severe test with a time varying solar irradiance according to the seen profile in Fig. 16. This can be caused due to severe environmental and weather conditions. The PV system was subjected to this varying solar irradiance with a constant firing angles of the converter and inverter of 35o and 145o respectively. Fig. 17 shows the performance of the PV systems during this condition. As revealed from the results, the resulting voltages and currents were changed according to the irradiance variation. Active and reactive power components were consequently affected. Fig. 18 illustrated the behavior of the HVDC link during this condition. The resulting DC current followed similarly the shape of the irradiance of PV system, while its DC voltage level was almost unchanged. As noted from Fig. 19, the measured power at the grid side followed also the same profile of the solar irradiance, while its voltage and current waveforms were almost unchanged
0 0.5 1 1.5 2 2.5 3
200 300 400 500 600 700 800 900 1000 1100 1200
Time (s)
I
r
r
a
d
ia
n
c
e
(
W/
m
2)
Fig. 16 Time varying profile of the solar irradiance of the PV system.
Fig. 17 PV system performance during the time varying irradiance with α=35o and = 145o.
V.
CONCLUSION
In this paper, integrating large scale PV power plants into the power grid via HVDC links was explored. Different benefits are gained using this integration methodology including eliminating stability issues, higher capacity, lower losses, better voltage profile and better controllability. Also, utilizing bipolar-HVDC link facilitates integrating different PV units (even with different frequency) together (with different frequency of the grid) to the grid. A large PV example of a 36 MW was considered as a simulation example. Different investigation tests including the variations of the solar radiance and the converter control angle. A MPPT routine was utilized for maximizing the performance of large grid PVs. Controlling the firing
angles of the rectidier and inverter (α and ) helps supervising the integration profile effectively.
Fig. 18 HVDC link performance during the time
varying irradiance with α=35o
Fig. 19 Grid side performance during the time
varying irradiance with α=35o
and = 145o.
Appendix: PV String (32kw)
The type of the module: Sun-Power SPR-30 SWHT, Number of cells per module=96, Number of series-connected modules per string=35 and number of parallel strings 330.
ACKNOWLEDGEMENTS
The authors would like to thank Deanship of Scientific Research at Umm Al-Qura University (UQU), Saudi Arabia for the financial Support (Project ID: 43408007).
REFERENCES
[1]. Singh D, Sharma N, Soo Y, Jarial R. Global
status of renewable energy and market:
Future prospectus and target. In:
Sustainable Energy and Intelligent Systems Conference (SEISCON 2011); 20-22 July
2011; Chennai, India. pp. 171-176
Technical report, 2014.
[2]. Hocko P, Novak M, Kolcun M, Conka Z. Influence of photovoltaic power plants on the power system to the prediction for year 2020. In: 14th Environment and Electrical Engineering Conference (EEEIC); 10-12 May 2014; Krakow, Poland: IET. pp. 116-121.
[3]. Fulton S, Skumanich A. New growth
markets for PV: Micro-grids in developing countries - A case study. In: 38th IEEE
Photovoltaic Specialists Conference
(PVSC); 3-8 June 2012; Austin, USA: IEEE. pp. 3303-3306.
[4]. Jianguang L, Suogang D, Pengwu H. PV
Power Grid Technology Research. In: International Conference of Industrial
Control and Electronics Engineering
(ICICEE); 23-25 Aug. 2012; Xi'an, China. pp. 1488-1491.
[5]. Fuchs A, Demiray T. Large-scale PV
integration strategies in distribution grids. In: IEEE Power Tech Conference; June 29
2015-July 2 2015; Eindhoven, Netherlands: IEEE. pp. 1-6.
[6]. Liu Y, Bebic J, Kroposki B, de Bedout J, Ren W. Distribution system voltage performance analysis for high-penetration PV. In: IEEE energy 2030 conference; 17-18 November 2008; Atlanta, USA: IEEE. pp. 1-8.
[7]. Thomson M, Infield D. Impact of
wide-spread photovoltaics generation on
distribution system. IET Renewable Power Generation 2007; 1: 30–40.
[8]. Eftekharnejad S, Vittal V, Heydt GT, Keel B, Loehr J. Impact of increased penetration of photovoltaic generation on power systems. IEEE Transaction on Power Systems 2013; 1: 893–901.
[9]. Eftekharnejad S, Heydt G, Vittal V.
Optimal generation dispatch with high penetration of photovoltaic generation. IEEE Transaction on Sustainable Energy 2014; 1: 1013 - 1020.
[10]. Gang L, Rasul G, Amanullah O, Khan K. 978 Feasibility study of stand-alone PV-wind-biomass hybrid energy system in
Australia. In: Power and Energy
Engineering Conference (APPEEC); 25-28 March 2011; Wuhan, China. pp. 1 – 6.
[11]. Schlabbach J. Operation of Multiple
Inverters in Grid-Connected Large-Size Photovoltaic Installations. In: CIRD conference 2009; 8-11 June 2009; Prague, Czech Republic. pp. 10-12.
[12]. Dokopoulos K. Small Power Systems Fed by Hydro, Photovoltaic, Wind Turbines and Diesel Generators. In: Proceedings of the Third IEEE International Conference on
Electronics, Circuits, and Systems
ICECS96; 13-16 October 1996; Rodos, Greece: IEEE. pp. 1013-1016.
[13]. Carbone R. Grid-Connected Photovoltaic
Systems with Energy Storage. In:
International Conference on Clean
Electrical Power ICCEP2009; 9-11 June 2009; Capri, Italy. pp. 760-767.
[14]. Ahmed S, Sowilam G, Abd Elkader M.
Comparison study between three-phase three-level inverter techniques. In: The tenth international middle east power systems conference, MEPCON2005; 13-15 December 2005; Port Said, Egypt. pp. 353-362.
[15]. Lingling F, Zhixin M, Alexander D. Impact
[16]. Hosseini S, Nejabatkhah F, Danyali S, Kh S. Grid-Connected Three-Input PV/ FC/ Battery Power System with Active Power Filter Capability. In: 2nd IEEE PES International Conference and Exhibition on Innovative Smart Grid Technologies ISGT Europe; 5-7 December 2011; Manchester, UK: IEEE. pp. 1-7.
[17]. Hussam A, Ruba A, Cheung L. Enabling Large-Scale PV Integration into the Grid. In: Green Technologies Conference IEEE; 19-20 April 2012; Tulsa, OK. pp. 1-7. [18]. Khalifa S, ElSaadany F. Control of Three
Phase Grid Connected Photovoltaic Power Systems; 26-29 September 2010; Bergamo, Italy: IEEE. pp. 1 - 7.
[19]. Marinopoulos A, Bakas P.
Techno-economic evaluation of alternative
configurations for large scale PV power systems including energy storage. In: Ninth International Conference on Ecological
Vehicles and Renewable Energies