Longitudinal Study of Performance on the
Ruff Figural Fluency Test in Persons Aged 35
Years or Older
Marlise E. A. van Eersel1*, Hanneke Joosten1, Janneke Koerts3, Ron T. Gansevoort2, Joris P. J. Slaets1, Gerbrand J. Izaks1
1University of Groningen, University Medical Center Groningen, University Center for Geriatric Medicine, Groningen, The Netherlands,2University of Groningen, University Medical Center Groningen, Department of Nephrology, Groningen, The Netherlands,3University of Groningen, Department of Clinical and Developmental Neuropsychology, Groningen, The Netherlands
Abstract
The Ruff Figural Fluency Test (RFFT) is a cognitive test tomeasure executive function. Lon-gitudinal studies have shown thatrepeated testing improves performance on the RFFT. Such a practice effect may hinder the interpretation of test results in a clinical setting.
There-fore, we investigated the longitudinal performance on the RFFT in persons aged 35–82
years. Performance on the RFFT was measured three times over an average follow-up peri-od of six years in 2,515 participants of the Prevention of REnal and Vascular ENd-stage Dis-ease (PREVEND) study in Groningen, the Netherlands: 53% men; mean age (SD), 53 (10) years. The effect of consecutive measurements on performance on the RFFT was investi-gated with linear multilevel regression models that also included age, gender, educational level and the interaction term consecutive measurement number x age as independent vari-ables. It was found that the mean (SD) number of unique designs on the RFFT increased from 73 (26) at the first measurement to 79 (27) at the second measurement and to 83 (26)
at the third measurement (p<0.001). However, the increase per consecutive measurement
number was negatively associated with age and decreased with 0.23 per one-year
incre-ment of age (p<0.001). The increase per consecutive measurement number was not
de-pendent on educational level. Similar results were found for the median (IQR) number of perseverative errors which showed a small but statistically significant increase with
repeat-ing testrepeat-ing: 7 (3–13) at the first measurement, 7 (4–14) at the second measurement and 8
(4–15) at the third measurement (ptrend= 0.002). In conclusion, the performance on the
RFFT improved by repeating the test over an average follow-up period of three to six years. This practice effect was the largest in young adults and not dependent on educational level.
OPEN ACCESS
Citation:van Eersel MEA, Joosten H, Koerts J, Gansevoort RT, Slaets JPJ, Izaks GJ (2015) Longitudinal Study of Performance on the Ruff Figural Fluency Test in Persons Aged 35 Years or Older. PLoS ONE 10(3): e0121411. doi:10.1371/journal. pone.0121411
Academic Editor:Antonio Verdejo García, University of Granada, SPAIN
Received:August 1, 2014
Accepted:February 2, 2015
Published:March 23, 2015
Copyright:© 2015 van Eersel et al. This is an open access article distributed under the terms of the
Creative Commons Attribution License, which permits unrestricted use, distribution, and reproduction in any medium, provided the original author and source are credited.
Data Availability Statement:The data underlying the findings in the study are available on the Dryad Digital Repository athttp://datadryad.org(doi:10. 5061/dryad.mb32q).
Introduction
In aging adults, cognitive function changes over time. Although, the underlying mechanism is not completely understood, it is generally acknowledged that cerebrovascular and
neurodegen-erative changes play an important role [1,2]. Generally, one of the first changes in cognitive
function occurs in the domain of executive function because executive functions are sensitive
to early cognitive impairment [3,4]. Executive functions encompass a variety of higher-order
cognitive processes that include planning, inhibition, cognitive flexibility, decision-making and
self-monitoring, and are commonly assessed by fluency tests [3,5]. Fluency refers to the ability
to generate within limited time varied verbal or non-verbal responses to a specific instruction
while avoiding response repetition [6]. One test to measure non-verbal fluency is the Ruff
Fig-ural Fluency Test [6].
The Ruff Figural Fluency Test (RFFT) requires participants to draw as many different
de-signs as possible without replicating dede-signs [6,7]. The RFFT was designed as a variation on the
first figural fluency test of Jones-Gotman and Miller [6–8], and provides information regarding
different cognitive abilities such as planning strategies, divergent thinking and the ability to
shift between different cognitive tasks [6,7]. The RFFT was evaluated in several populations
and was found to discriminate well between healthy persons and persons with brain injury or
dementia [6,9,10]. In addition, the RFFT is sensitive to changes in executive function in both
young and older persons [6,11]. Yet, the RFFT may have an important limitation because for
various fluency tests the performance improves substantially by repeating the test [12–14].
Clearly, such a practice effect would impair the interpretation of test results in a clinical setting. Up till now, four studies have found that performance on the RFFT might also be dependent
on repeated testing [6,15–17]. However, these studies only included carefully selected and
small study populations of healthy persons. More importantly, measurement of performance on the RFFT was repeated after a relatively short follow-up period of three weeks to twelve
months [6,15–17]. However, in clinical practice, the follow-up period of patients with cognitive
complaints is often considerably longer. It is not clear if a practice is still relevant after that pe-riod of time. Thus, it is still unknown how performances on the RFFT after repeated measure-ment over a longer follow-up period can be interpreted.
The aim of this study was to investigate the longitudinal performance on the RFFT by re-peating the test over an average follow-up period of three and six years in a large cohort that in-cluded 2,515 community-dwelling persons aged 35 to 82 years old with different
educational levels.
Methods
Study Population
The data of this study were collected in the third, fourth and fifth survey of the Prevention of REnal and Vascular ENd-stage Disease (PREVEND) study. The PREVEND study was initiated in 1997 to investigate prospectively the natural course of microalbuminuria and its association
with renal and cardiovascular diseases in the general population [18,19]. Briefly, all habitants
of the city of Groningen, the Netherlands, aged 28–75 years old, were invited to participate in the study. Finally, 8,592 participants were selected for the first survey (1997–1998) based on their urinary albumin excretion and were followed over time. The RFFT was introduced at the third survey of the PREVEND study (2003–2006). A total of 4,158 participants completed the first measurement of the RFFT. Of those, twenty-three participants (0.6%) were excluded
because of incomplete demographic data [20]. Thus, the total study population included
4,135 persons, who were invited to perform the RFFT for a second time in the fourth survey Competing Interests:The authors have declared
(2006–2008) and for a third time in the fifth survey (2008–2012). Further details of the
PRE-VEND study can be found in Mahmoodiet al. and Lambers Heerspinket al. [18,19].
Ethics Statement
The PREVEND study was approved by the medical ethics committee (METc) of University Medical Center Groningen, Groningen, The Netherlands, and conducted in accordance with the guidelines of the Helsinki declaration. All participants gave written informed consent.
Ruff Figural Fluency Test
The Ruff Figural Fluency Test (RFFT) is a non-verbal fluency test that measures executive
function [6,7]. The test consists of five parts. Each part contains 35 five-dot patterns arranged
in five columns and seven rows on a white 8.5 by 11 inches sheet of paper. Each part has a
dif-ferent stimulus pattern (Fig. 1). In part 1, 2 and 3, the same five-dot pattern is used but part 2
and 3 include different distractors. In part 4 and 5, the five-dot pattern is a variation of the dot pattern in part 1 and without distractors. For each part, the task is to draw as many unique signs as possible within one minute by connecting the dots while avoiding repetitions of de-signs. Repetitions of designs are scored as perseverative errors. Performance on the RFFT is expressed as the total number of unique designs of all five parts and the total number of persev-erative errors. The relationship between the total number of unique designs and the total num-ber of perseverative errors is sometimes expressed as error ratio: the total numnum-ber of
perseverative errors is divided by the total number of unique designs [6,7]. In the PREVEND
study, performance on the RFFT was analyzed independently by two trained examiners. If the number of unique designs or perseverative errors as analyzed by the two examiners differed by more than two designs in one part or more than four designs in total, the analysis was repeated by a third independent examiner. Then the RFFT scores as analyzed by the two examiners who were most concordant were averaged. The Intraclass Correlation Coefficient (95% CI) between
two ratings was 1.00 (0.99 to 1.00) [11].
Other variables
Data on age at the first measurement, gender and educational level were obtained from a ques-tionnaire. Educational level was divided into four groups according to the International Stan-dard Classification of Education (ISCED): primary school (0 to 8 years of education; ISCED 0–1), lower secondary education (9 to 12 years of education; ISCED 2), higher secondary
edu-cation (13 to 15 years of eduedu-cation; ISCED 3–4), and university (16 years of education;
ISCED 5) [21].
Fig 1. Five-dot patterns in parts 1 to 5 of the Ruff Figural Fluency Test [6,7].
Statistical analysis
Parametric data are presented as mean and standard deviation (SD) and nonparametric data as median and interquartile range (IQR). Differences between unpaired observations were tested
by independent-samplesttest or, if appropriate, Mann-WhitneyUtest. Differences between
paired observations were tested by paired-samplesttest or, if appropriate, Wilcoxon
signed-rank test. Differences in proportion were tested by Chi-Square test. Trends were analyzed by ANOVA for parametric data and by Kruskal-Wallis H test for nonparametric data.
The effect of repeated testing and age on performance on the RFFT was investigated by line-ar multilevel analysis (lineline-ar mixed model analysis). The included levels were consecutive mea-surement number (lowest level; value: 1, 2 or 3) and participant (highest level). The number of unique designs was the dependent variable. Consecutive measurement number, age at the first measurement (years), gender and educational level were the independent variables. Interaction between consecutive measurement number and age was investigated by entering the product term consecutive measurement number x age into the regression model. Similarly, the interac-tion between consecutive measurement number and educainterac-tional level was investigated by en-tering the product term consecutive measurement number x educational level into the model. The same analyses were done with the number of perseverative errors as the dependent vari-able. For this variable, the analyses were repeated after log transformation because its distribu-tion was skewed. In all regression models, the number of unique designs, the number of perseverative errors, age at the first measurement and consecutive measurement number were entered as continuous variables. Educational level and gender were entered as categorical vari-ables. The level of statistical significance was set at 0.05. The multilevel analyses were per-formed using MLwiN Version 2.29 (Centre for Multilevel Modelling, University of Bristol,
Bristol, UK) [22], the other analyses were performed using IBM SPSS Statistics 20.0 (IBM,
Amonk, NY).
Results
Study population
A total of 2,515 participants (61%) completed the RFFT at all three measurements (Fig. 2). The
mean (SD) age of all participants at the first measurement was 53 (10) years, 53% were men
and 96% was of Western-European descent (Table 1). The mean (SD) follow-up time between
the first and second measurement was 2.8 (0.5) years and between the second and third mea-surement 2.7 (0.5) years. The mean (SD) total follow-up time was 5.5 (0.7) years.
Participants who did not perform the RFFT at the second or third measurement were older
(mean [SD] age, 58 [13] vs. 53 [10] years;p<0.001) and had a lower educational level
(p<0.001). There was no difference in gender (p= 0.16). The main reasons for
nonperfor-mance were refusal to participate (19%), withdrawal from the PREVEND study (18%) and death (2%).
Unique designs
At the first measurement, the mean (SD) number of unique designs was 73 (26) in the total study population. The number of unique designs was negatively associated with age (ptrend<0.001)(Table 2), and positively associated with educational level (ptrend<0.001)
(Table 3). Similar results were found at the second and third measurement.
During follow-up, the number of unique designs increased and was dependent on
unique designs increased to 79 (27) at the second measurement and to 83 (26) at the third
mea-surement (ptrend<0.001).
The increase in the number of unique designs during follow-up was also dependent on age (Fig. 3). The mean difference in the number of unique designs between the first and third
mea-surement diminished from +16 (95%CI, +14 to +18;p<0.001) in persons aged 35–39 years
to -1 (95%CI, -6 to +4;p= 0.59) in persons aged 75 years or older (Table 2). This was
con-firmed by multilevel analysis that did not only show a statistically significant effect for consecu-tive measurement number and age, but also for the interaction between consecuconsecu-tive
measurement number and age. The increase in number of unique designs between two
mea-surements decreased with 0.23 per one-year increment of age (p<0.001)(Table 4).
The increase in the number of unique designs during follow-up was not dependent on edu-cational level. In the raw data, the mean difference in the number of unique designs between
first and third measurement gradually increased from +5 (95%CI, +2 to +8;p= 0.001) in
per-sons educated at primary school level to +11 (95%CI, +10 to +12;p<0.001) in persons
educat-ed at university level (Table 3). However, after adjustment for age in multilevel analysis, there
Fig 2. Flowchart of participants who performed the Ruff Figural Fluency Test.Mean (SD) follow-up time between measurement 1 and 2 was 2.8 (0.5) years and between measurement 2 and 3 2.7 (0.5) years. Abbreviations: RFFT, Ruff Figural Fluency Test.
was no statistically significant interaction between consecutive measurement number and edu-cational level (data not shown).
Perseverative errors
At the first measurement, the median (IQR) number of perseverative errors was 7 (3–13) in the
total study population. The number of perseverative errors was not dependent on age (ptrend=
0.11)(Table 2), or educational level (ptrend= 0.18)(Table 3).
During follow-up, the number of perseverative errors increased and was dependent on
con-secutive measurement number (Table 2). In the total study population, the median (IQR)
num-ber of perseverative errors increased to 7 (4–14) at the second measurement and to 8 (4–15) at
the third measurement (ptrend= 0.002). The median (IQR) error ratio did not change over
time: 0.10 (0.05–0.19) at the first measurement, 0.10 (0.05–0.18) at the second measurement
and 0.10 (0.05–0.19) at the third measurement (p= 0.53).
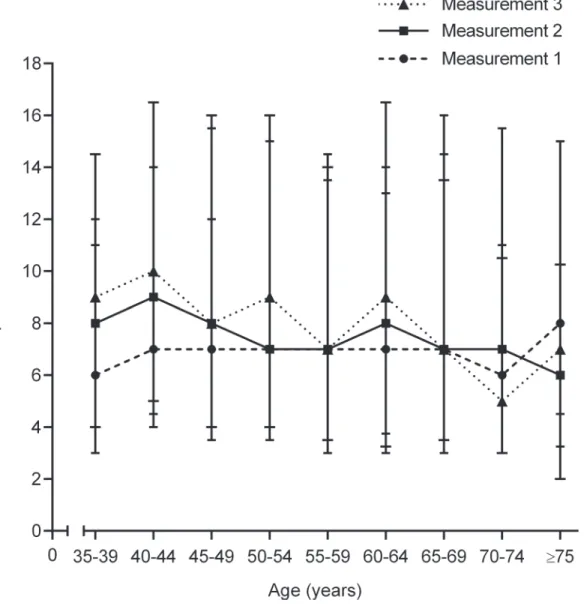
The increase in the number of perseverative errors during follow-up was also dependent on
age (Fig. 4). The mean difference in the number of perseverative errors between the first and
third measurement diminished from +2 (95%CI, +0 to +4;p= 0.02) in persons aged 35–39
years to -4 (95%CI, -9 to +1;p= 0.12) in persons aged 75 years or older. This was confirmed by
multilevel analysis that did not only show a statistically significant effect for consecutive mea-surement number and age, but also for the interaction between consecutive meamea-surement number and age. The increase in number of perseverative errors between two measurements
decreased with 0.05 per one-year increment of age (p= 0.002)(Table 5).
The increase in the number of perseverative errors during follow-up was not dependent on educational level. In the raw data, the mean difference in the number of perseverative errors
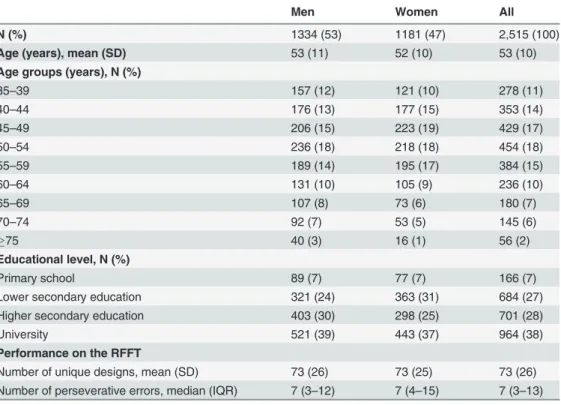
Table 1. Characteristics of the study population at measurement 1, 2003–2006.
Men Women All
N (%) 1334 (53) 1181 (47) 2,515 (100)
Age (years), mean (SD) 53 (11) 52 (10) 53 (10)
Age groups (years), N (%)
35–39 157 (12) 121 (10) 278 (11)
40–44 176 (13) 177 (15) 353 (14)
45–49 206 (15) 223 (19) 429 (17)
50–54 236 (18) 218 (18) 454 (18)
55–59 189 (14) 195 (17) 384 (15)
60–64 131 (10) 105 (9) 236 (10)
65–69 107 (8) 73 (6) 180 (7)
70–74 92 (7) 53 (5) 145 (6)
75 40 (3) 16 (1) 56 (2)
Educational level, N (%)
Primary school 89 (7) 77 (7) 166 (7)
Lower secondary education 321 (24) 363 (31) 684 (27)
Higher secondary education 403 (30) 298 (25) 701 (28)
University 521 (39) 443 (37) 964 (38)
Performance on the RFFT
Number of unique designs, mean (SD) 73 (26) 73 (25) 73 (26)
Number of perseverative errors, median (IQR) 7 (3–12) 7 (4–15) 7 (3–13)
Abbreviations: RFFT, Ruff Figural Fluency Test; SD, standard deviation; IQR, interquartile range.
between the first and third measurement gradually increased from-1 (95%CI, -4 to +2;
p= 0.58) in persons educated at primary school level to +1 (95%CI, +0 to +2;p= 0.01) in
per-sons educated at university level. However, after adjustment for age in multilevel analysis, there was no statistically significant interaction between consecutive measurement number and edu-cational level (data not shown). Essentially similar results were found when the number of per-severative errors was log transformed and the analysis was repeated (data not shown).
Discussion
In this large community-based cohort, the performance on the RFFT improved significantly by repeating the test over an average follow-up period of three to six years. Not only the number of unique designs increased but also the number of perseverative errors increased. Interesting-ly, the change in number of unique designs and perseverative errors between two measure-ments decreased with increasing age and was not dependent on educational level.
The results in this study were comparable to the findings in two other studies by Ruffet al.
and Bassoet al. [6,15]. In all studies, the number of unique designs increased by repeating the
RFFT. Surprisingly, the increase in number of unique designs was similar in the three study
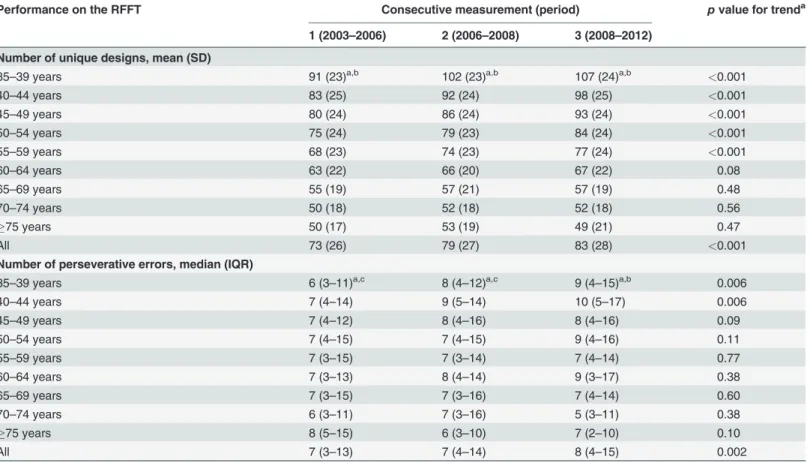
Table 2. Longitudinal performance on the Ruff Figural Fluency Test per age group.
Performance on the RFFT Consecutive measurement (period) pvalue for trenda
1 (2003–2006) 2 (2006–2008) 3 (2008–2012)
Number of unique designs, mean (SD)
35–39 years 91 (23)a,b 102 (23)a,b 107 (24)a,b <0.001
40–44 years 83 (25) 92 (24) 98 (25) <0.001
45–49 years 80 (24) 86 (24) 93 (24) <0.001
50–54 years 75 (24) 79 (23) 84 (24) <0.001
55–59 years 68 (23) 74 (23) 77 (24) <0.001
60–64 years 63 (22) 66 (20) 67 (22) 0.08
65–69 years 55 (19) 57 (21) 57 (19) 0.48
70–74 years 50 (18) 52 (18) 52 (18) 0.56
75 years 50 (17) 53 (19) 49 (21) 0.47
All 73 (26) 79 (27) 83 (28) <0.001
Number of perseverative errors, median (IQR)
35–39 years 6 (3–11)a,c 8 (4–12)a,c 9 (4–15)a,b 0.006
40–44 years 7 (4–14) 9 (5–14) 10 (5–17) 0.006
45–49 years 7 (4–12) 8 (4–16) 8 (4–16) 0.09
50–54 years 7 (4–15) 7 (4–15) 9 (4–16) 0.11
55–59 years 7 (3–15) 7 (3–14) 7 (4–14) 0.77
60–64 years 7 (3–13) 8 (4–14) 9 (3–17) 0.38
65–69 years 7 (3–15) 7 (3–16) 7 (4–14) 0.60
70–74 years 6 (3–11) 7 (3–16) 5 (3–11) 0.38
75 years 8 (5–15) 6 (3–10) 7 (2–10) 0.10
All 7 (3–13) 7 (4–14) 8 (4–15) 0.002
Abbreviations: RFFT, Ruff Figural Fluency Test; SD, standard deviation; IQR, interquartile range.
aTrends across consecutive measurements and age groups were analyzed by ANOVA for the number of unique designs and by Kruskal-Wallis H test for the number of perseverative errors.
bpvalue for trend across age groups is<0.001. cTrend across age groups is not statistically signi
ficant.
populations although the duration of follow-up was clearly different [6,15]. The duration of
follow-up in the study of Ruffet al. was six months and in the study of Bassoet al. twelve
months while the duration of follow-up was in our study three to six years. Therefore, it can be assumed that repeating the RFFT causes a practice effect that is independent of the duration of follow-up between two consecutive measurements. In theory, it is also possible that the in-crease of unique designs by repeating the RFFT was (partly) caused by a practice effect in ana-lyzing the performance on the RFFT by the examiners. However, in our study, the group of examiners was different for each consecutive measurement. Therefore, it is highly likely that re-peating the RFFT causes a practice effect in performing the test. Interestingly, this practice ef-fect persisted three to six years after the first measurement of the RFFT. On the other hand, this longstanding practice effect was not only found for the RFFT but also for other cognitive tests assessing the domains of memory and executive functions, such as the Verbal Learning
Test (VLT) and the Stroop Color-Word Test (SCWT) [23–25]. Salthouseet al. even found that
practice effects were detectable up to seven years after the first measurement of cognitive
func-tion [25]. Thus, our study is the first to show that the practice effect in performing the RFFT
can persist at least three to six years after the first measurement.
Practice effects are a well-known finding when repeating neuropsychological tests [14]. It is
generally assumed that practice effects can be ascribed to different factors such as reduced anxi-ety for or familiarity with the test, memory of specific test items or previous responses, and
learning or improving test strategies [12,14,26]. Practice effects appear in several cognitive tests
which assess various cognitive domains like memory, attention and executive functioning [12–
14]. Several factors might especially contribute to the practice effect in the RFFT. First, the
in-struction to the RFFT is rather long and comprises several essential elements. Therefore, the task may seem complicated when hearing the instruction for the first time. It is likely that the instruction becomes better understood while performing the test and that better understanding of the instruction leads to better performance. Second, persons who performed the RFFT for a second time probably remember several designs from the first time. It is plausible to assume
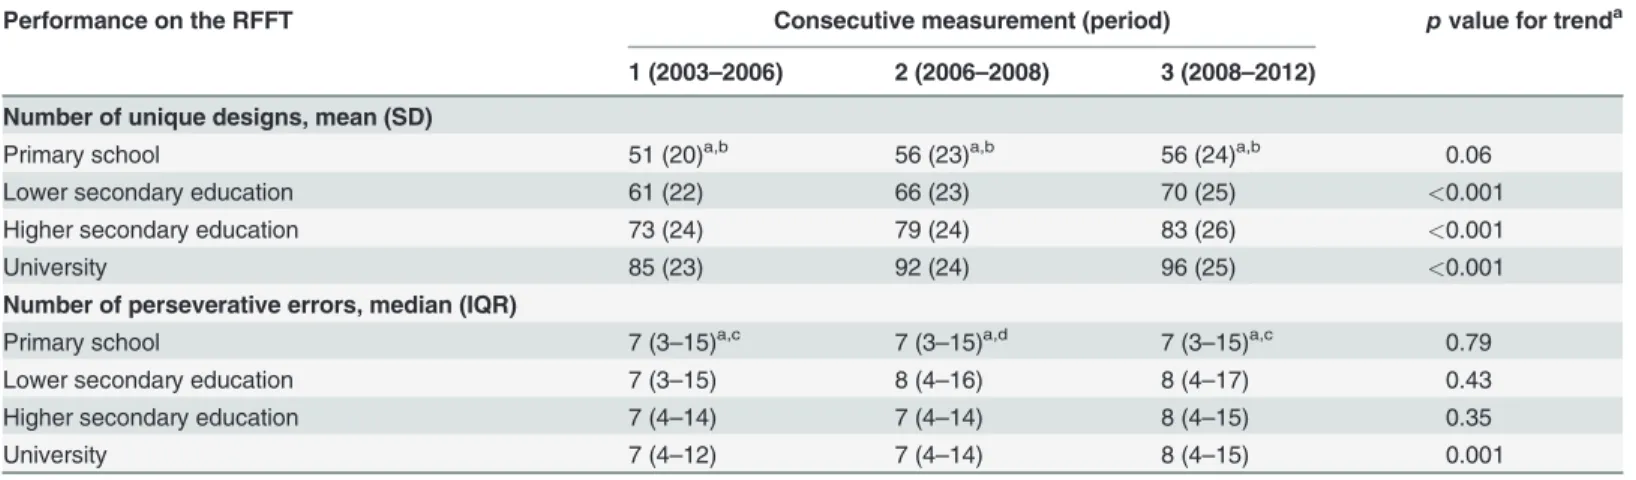
Table 3. Longitudinal performance on the Ruff Figural Fluency Test per educational level.
Performance on the RFFT Consecutive measurement (period) pvalue for trenda
1 (2003–2006) 2 (2006–2008) 3 (2008–2012)
Number of unique designs, mean (SD)
Primary school 51 (20)a,b 56 (23)a,b 56 (24)a,b 0.06
Lower secondary education 61 (22) 66 (23) 70 (25) <0.001
Higher secondary education 73 (24) 79 (24) 83 (26) <0.001
University 85 (23) 92 (24) 96 (25) <0.001
Number of perseverative errors, median (IQR)
Primary school 7 (3–15)a,c 7 (3–15)a,d 7 (3–15)a,c 0.79
Lower secondary education 7 (3–15) 8 (4–16) 8 (4–17) 0.43
Higher secondary education 7 (4–14) 7 (4–14) 8 (4–15) 0.35
University 7 (4–12) 7 (4–14) 8 (4–15) 0.001
Abbreviations: RFFT, Ruff Figural Fluency Test; SD, standard deviation; IQR, interquartile range.
aTrends across consecutive measurements and educational levels were analyzed by ANOVA for the number of unique designs and by Kruskal-Wallis H test for the number of perseverative errors.
bpvalue for trend across educational levels is<0.001. cTrend across educational levels is not statistically signi
ficant. dpvalue for trend across educational levels is<0.01.
that the memory of designs drawn at the first measurement also contributed to the increase in performance on the RFFT at the subsequent measurements. Third, persons may discover strat-egies to improve their performance while executing the RFFT. In general, there are two
differ-ent strategies to perform the RFFT: rotation and enumeration [7]. In rotation, the basic design
is unchanged (for example, one line connects two dots) but its orientation is systematically ro-tated in each subsequent five-dot pattern of the test. In enumeration, the orientation of the basic design is unchanged but the design is systematically extended by connecting a new line to
the previous one in each subsequent five-dot pattern of the test [7]. Learning and improving
these strategies at repeated measurements of the RFFT probably leads to an increase in the
number of unique designs per part and overall performance on the RFFT [16,27].
Practice effects have not been found for all figural fluency tests. When the Design Fluency
Test (DFT) which also requires the production of unique designs under time constraints [8],
was repeated after more than five years, performance had decreased across time [28]. Although
this might be due to different test characteristics of the RFFT and DFT, there are several other explanations. The follow-up period in the study of the DFT, for example, was almost twice the
follow-up period between the first and second measurement in our study [28]. It is likely that
practice effects that occurred, at least partially, decreased during this period. Furthermore, it is
Fig 3. Mean number of unique designs per measurement dependent on age at baseline (measurement 1).Bars represent 95% confidence intervals.
likely that the participants in the study of the DFT underwent structural and functional brain changes during the long follow-up period which might have resulted in cognitive decline coun-terbalancing possible practice effects. We think that currently a practice effect of the DFT can-not be excluded.
Interestingly, the practice effect and the increase in performance on the RFFT at the conse-cutive measurements decreased with increasing age. This was in contrast with the studies of Ruffet al. and Bassoet al., which did not show that the practice effect was dependent on age. A possible explanation for these divergent findings is the relatively smaller and more selected
study populations in the studies of Ruffet al. and Bassoet al. [6,15]. These studies also included
a relatively small number of elderly people. In our study, the practice effect clearly decreased in
persons aged 65 years or older but the study of Bassoet al. included only participants aged 20–
59 years old while the study of Ruffet al. had only 27 participants in the age group 55–70 years
[6,15]. This negative association between practice effect and age was not only found for the
RFFT but also for other cognitive tests that are commonly used to assess executive functions such as the Stroop Color-Word Test, Trail-Making Test part B and Wisconsin Card Sorting
Test [14,23,29]. For most tests, the negative association between practice effect and age was
only analyzed for two consecutive measurements [14,23,29]. However, in this study, we found
that the practice effect increased further between the second and third measurement. It has been suggested that such longitudinal changes in the performance on cognitive tests are not de-pendent on the interval between measurements but are largely attributable to learn new
strate-gies or to reduce anxiety when performing a test [30]. It is likely that these abilities decrease
with increasing age due to the accumulation of age-related cerebral changes such as
neurode-generative and vascular lesions [31].
Notably, the number of perseverative errors also increased by repeating the RFFT. Although this increase was small, it was proportional to the increase in the number of unique designs be-cause the error ratio did not change over time. This increase of perseverative errors was unex-pected as it was assumed that repeating the RFFT would cause a practice effect and improve
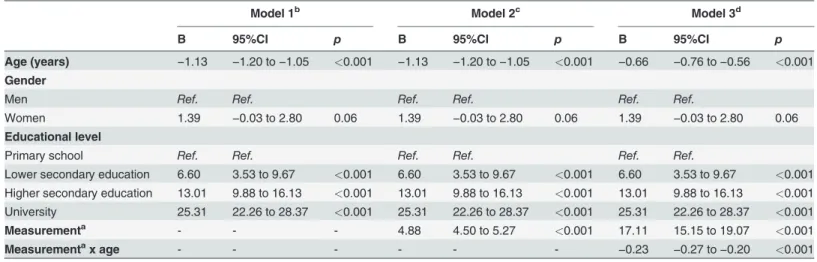
Table 4. Linear multilevel regression analysis of performance on the Ruff Figural Fluency Test: unique designs.
Model 1b Model 2c Model 3d
B 95%CI p B 95%CI p B 95%CI p
Age (years) −1.13 −1.20 to−1.05 <0.001 −1.13 −1.20 to−1.05 <0.001 −0.66 −0.76 to−0.56 <0.001 Gender
Men Ref. Ref. Ref. Ref. Ref. Ref.
Women 1.39 −0.03 to 2.80 0.06 1.39 −0.03 to 2.80 0.06 1.39 −0.03 to 2.80 0.06
Educational level
Primary school Ref. Ref. Ref. Ref. Ref. Ref.
Lower secondary education 6.60 3.53 to 9.67 <0.001 6.60 3.53 to 9.67 <0.001 6.60 3.53 to 9.67 <0.001
Higher secondary education 13.01 9.88 to 16.13 <0.001 13.01 9.88 to 16.13 <0.001 13.01 9.88 to 16.13 <0.001
University 25.31 22.26 to 28.37 <0.001 25.31 22.26 to 28.37 <0.001 25.31 22.26 to 28.37 <0.001
Measurementa - - - 4.88 4.50 to 5.27 <0.001 17.11 15.15 to 19.07 <0.001
Measurementax age - - - - -
-−0.23 −0.27 to−0.20 <0.001
Abbreviations: B, unstandardized B-coefficient; CI, confidence interval; Ref, reference category. a
Consecutive measurement number. b
For model 1:−2*log likelihood 65821.57.
c
For model 2:−2*log likelihood 65241.34.
d
For model 3:−2*log likelihood 65088.13.
performance not only by the production of more unique designs but also by avoidance of per-severative errors at the consecutive measurements. However, similar results were found by Ruffet al. [6]. This was in contrast with another figural fluency test, the Five-Point Test (FPT),
in which the number of perseverative errors decreased by repeating the test [32–34]. A possible
explanation for the difference between these figural fluency tests in the change of perseverative
errors is that the FPT is a simpler test to perform [34,35]. The FPT consists of only one part
containing 40 five-dot patterns without distractors while the RFFT has five parts each one
con-taining 35 five-dot patterns and different stimulus patterns [6,7,35]. As a result, the RFFT is
more difficult test in respect to fluid thinking, shifting cognitive sets and planning strategies, which unsurprisingly leads to more perseverative errors.
These findings have important implications for clinical care as it is common practice to re-peat a cognitive test to monitor recovery or progress of cognitive impairment. Our data show that in young persons even apparently large improvements in performance on the RFFT at re-peated testing may be the result of a practice effect and not the result of recovery. Similarly, a
Fig 4. Median number of perseverative errors per measurement dependent on age at baseline (measurement 1).Upper bars represent 75th percentile, lower bars represent 25th percentile.
stable performance on the RFFT at repeated testing does most likely not reflect a stable course of disease but progress. Although this problem is also present in older persons, it is much smaller in this age group. Thus, changes in performance on the RFFT at repeated testing should be interpreted differently for young and old patients.
Some limitations of this study have to be noted. First, the drop-out of participants was rela-tively high in our study and participants who did not perform the RFFT at the second and third measurement were older and had a lower educational level. This selection bias could have caused some overestimation of the practice effect in the older age groups. However, our study was the first to show a practice effect in the elderly of the general population as the four other longitudinal studies on repeated testing of the RFFT only included a relatively small number of
strongly selected older persons aged 70 years or younger [6,15–17]. Second, in contrast to the
other longitudinal studies [6,15–17], persons with neurological and psychiatric disorders were
not excluded from our study. Therefore, it is likely that the health status of our study popula-tion was worse which might have led to an underestimapopula-tion of the practice effect. On the other hand, our study was a better reflection of the health status of the general population and our findings were comparable to the findings of the other studies. It is generally recommended that the repeated performance of an older patient with cognitive complaints is compared to the re-peated performance of older persons from the general population who are not selected on health criteria. In older persons exclusion by health criteria mostly leads to small and selected
reference samples [36].
The present study also has several strengths. Our study was based on a large community-based cohort with a wide age-range and included a large number of both young and elderly people. Most importantly, our study had a long follow-up period of three to six years, which re-flects the follow-up period of patients with cognitive complaints in clinical practice.
In conclusion, in this study, the performance on the RFFT improved if the test was repeated over an average follow-up period of three to six years. This practice effect was dependent on
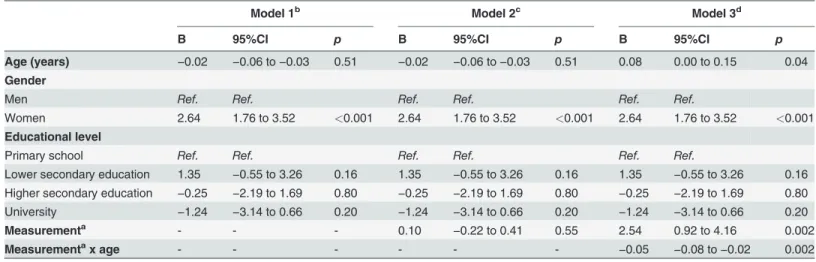
Table 5. Linear multilevel regression analysis of performance on the Ruff Figural Fluency Test: perseverative errors.
Model 1b Model 2c Model 3d
B 95%CI p B 95%CI p B 95%CI p
Age (years) −0.02 −0.06 to−0.03 0.51 −0.02 −0.06 to−0.03 0.51 0.08 0.00 to 0.15 0.04 Gender
Men Ref. Ref. Ref. Ref. Ref. Ref.
Women 2.64 1.76 to 3.52 <0.001 2.64 1.76 to 3.52 <0.001 2.64 1.76 to 3.52 <0.001 Educational level
Primary school Ref. Ref. Ref. Ref. Ref. Ref.
Lower secondary education 1.35 −0.55 to 3.26 0.16 1.35 −0.55 to 3.26 0.16 1.35 −0.55 to 3.26 0.16
Higher secondary education −0.25 −2.19 to 1.69 0.80 −0.25 −2.19 to 1.69 0.80 −0.25 −2.19 to 1.69 0.80
University −1.24 −3.14 to 0.66 0.20 −1.24 −3.14 to 0.66 0.20 −1.24 −3.14 to 0.66 0.20
Measurementa - - - 0.10 −0.22 to 0.41 0.55 2.54 0.92 to 4.16 0.002
Measurementax age - - - - -
-−0.05 −0.08 to−0.02 0.002
Abbreviations: B, unstandardized B-coefficient; CI, confidence interval; Ref, reference category. a
Consecutive measurement number. b
For model 1:−2*log likelihood 60760.87.
c
For model 2:−2*log likelihood 60760.52.
d
For model 3:−2*log likelihood 60751.38.
age and decreased with increasing age. The practice effect was not dependent on educational level.
Acknowledgments
The authors thank the PREVEND study group and the supporting staff of PREVEND for their role in the logistics of the study and the acquisition of the data used in this article, and professor Oliver M. Tucha of the Department of Clinical and Developmental Neuropsychology for his valuable comments and suggestions.
Author Contributions
Conceived and designed the experiments: RTG JPJS GJI. Analyzed the data: MEAE HJ GJI. Wrote the paper: MEAE GJI. Oversaw data collection: RTG GJI. Obtained funding: JPJS. Criti-cally reviewed the manuscript: HJ RTG JK JPJS.
References
1. Querfurth HW, LaFerla FM. Alzheimer's disease. N Engl J Med. 2010; 362: 329–344. doi:10.1056/
NEJMra0909142PMID:20107219
2. Gottesman RF, Hillis AE. Predictors and assessment of cognitive dysfunction resulting from ischaemic stroke. Lancet Neurol. 2010; 9: 895–905. doi:10.1016/S1474-4422(10)70164-2PMID:20723846
3. Bryan J, Luszcz MA. Measurement of executive function: Considerations for detecting adult age differ-ences. J Clin Exp Neuropsychol. 2000; 22: 40–55. PMID:10649544
4. Daigneault S, Braun CM, Whitaker HA. Early effects of normal aging on perseverative and non‐
persev-erative prefrontal measures. Dev Neuropsychol. 1992; 8: 99–114.
5. Lezak MD. Neuropsychological assessment. New York: Oxford university press; 2004; 611 p.
6. Ruff RM, Light RH, Evans RW. The Ruff Figural Fluency Test: A normative study with adults. Dev Neu-ropsychol. 1987; 3: 37–51.
7. Ruff RM. RFFT: Ruff Figural Fluency Test: Professional manual. Lutz: Psychological Assessment Re-sources; 1996.
8. Jones-Gotman M, Milner B. Design fluency: The invention of nonsense drawings after focal cortical le-sions. Neuropsychologia. 1977; 15: 653–674. PMID:896022
9. Ruff RM, Evans R, Marshall LF. Impaired verbal and figural fluency after head injury. Arch Clin Neurop-sychol. 1986; 1: 87–101. PMID:14589643
10. Fama R, Sullivan EV, Shear PK, Cahn-Weiner DA, Yesavage JA, Tinklenberg JR, et al. Fluency perfor-mance patterns in Alzheimer's disease and Parkinson's disease. Clin Neuropsychol. 1998; 12: 487–
499.
11. Izaks GJ, Joosten H, Koerts J, Gansevoort RT, Slaets JP. Reference data for the Ruff Figural Fluency Test stratified by age and educational level. PLoS One. 2011; 6: e17045. doi:10.1371/journal.pone. 0017045PMID:21347325
12. Bartels C, Wegrzyn M, Wiedl A, Ackermann V, Ehrenreich H. Practice effects in healthy adults: A longi-tudinal study on frequent repetitive cognitive testing. BMC Neurosci. 2010; 11: 118–2202–11–118.
13. Beglinger LJ, Gaydos B, Tangphao-Daniels O, Duff K, Kareken DA, Crawford J, et al. Practice effects and the use of alternate forms in serial neuropsychological testing. Arch Clin Neuropsychol. 2005; 20: 517–529. PMID:15896564
14. Calamia M, Markon K, Tranel D. Scoring higher the second time around: Meta-analyses of practice ef-fects in neuropsychological assessment. Clin Neuropsychol. 2012; 26: 543–570. doi:10.1080/
13854046.2012.680913PMID:22540222
15. Basso MR, Bornstein RA, Lang JM. Practice effects on commonly used measures of executive function across twelve months. Clin Neuropsychol. 1999; 13: 283–292. PMID:10726600
16. Ross TP, Lindsay Foard E, Berry Hiott F, Vincent A. The reliability of production strategy scores for the Ruff Figural Fluency Test. Arch Clin Neuropsychol. 2003; 18: 879–891. PMID:14609582
18. Mahmoodi BK, Gansevoort RT, Veeger NJ, Matthews AG, Navis G, Hillege HL, et al. Microalbuminuria and risk of venous thromboembolism. JAMA. 2009; 301: 1790–1797. doi:10.1001/jama.2009.565
PMID:19417196
19. Lambers Heerspink HJ, Brantsma AH, de Zeeuw D, Bakker SJ, de Jong PE, Gansevoort RT, et al. Al-buminuria assessed from first-morning-void urine samples versus 24-hour urine collections as a predic-tor of cardiovascular morbidity and mortality. Am J Epidemiol. 2008; 168: 897–905. doi:10.1093/aje/
kwn209PMID:18775924
20. van Eersel ME, Joosten H, Gansevoort RT, Dullaart RP, Slaets JP, Izaks GJ. The interaction of age and type 2 diabetes on executive function and memory in persons aged 35 years or older. PLoS One. 2013; 8: e82991. doi:10.1371/journal.pone.0082991PMID:24367577
21. United Nations Educational, Scientific and Cultural Organization. International standard classification of education ISCED 1997. Re-edition 2006. Montreal, Canada: United Nations Educational, Scientific and Cultural Organization. 2006. Available:http://www.uis.unesco.org/Library/Documents/isced97-en. pdf. Accessed 2015 Feb 21.
22. Rasbash J, Charlton C, Browne WJ, Healy M, Cameron B. MLwiN version 2.1. Centre for multilevel modelling, University of Bristol. 2009. Available:http://www.bristol.ac.uk/cmm/software/mlwin/. Ac-cessed 2015 Feb 21.
23. Van der Elst W, Van Boxtel MP, Van Breukelen GJ, Jolles J. Detecting the significance of changes in performance on the Stroop Color-Word Test, Rey's Verbal Learning Test, and the Letter Digit Substitu-tion Test: The regression-based change approach. J Int Neuropsychol Soc. 2008; 14: 71–80. PMID:
18078533
24. Ronnlund M, Nyberg L, Backman L, Nilsson LG. Stability, growth, and decline in adult life span develop-ment of declarative memory: Cross-sectional and longitudinal data from a population-based study. Psy-chol Aging. 2005; 20: 3–18. PMID:15769210
25. Salthouse TA, Schroeder DH, Ferrer E. Estimating retest effects in longitudinal assessments of cogni-tive functioning in adults between 18 and 60 years of age. Dev Psychol. 2004; 40: 813–822. PMID:
15355168
26. Hausknecht JP, Halpert JA, Di Paolo NT, Gerrard MOM. Retesting in selection: A meta-analysis of coaching and practice effects for tests of cognitive ability. J Appl Psychol. 2007; 92: 373–385. PMID:
17371085
27. Kingery LR, Schretlen DJ, Sateri S, Langley LK, Marano NC, Meyer SM. Interrater and test-retest reli-ability of a fixed condition Design Fluency Test. Clin Neuropsycholog. 2008; 20: 729–740.
28. Gardner E, Vik P, Dasher N. Strategy use on the Ruff Figural Fluency Test. Clin Neuropsychol. 2013; 27: 470–484. doi:10.1080/13854046.2013.771216PMID:23432362
29. Mitrushina M, Satz P. Effect of repeated administration of a neuropsychological battery in the elderly. J Clin Psychol. 1991; 47: 790–801. PMID:1757583
30. Salthouse TA. Effects of age on time-dependent cognitive change. Psychological Science. 2011; 22: 682–88. doi:10.1177/0956797611404900PMID:21467547
31. Raz N, Rodrigue KM. Differential aging of the brain: Patterns, cognitive correlates and modifiers. Neu-rosci Biobehav Rev. 2006; 30: 730–748. PMID:16919333
32. Fernandez AL, Moroni MA, Carranza JM, Fabbro N, Lebowitz BK. Reliability of the Five-Point Test. Clin Neuropsychol. 2009; 23: 501–509. doi:10.1080/13854040802279675PMID:18671154
33. Goebel S, Fischer R, Ferstl R, Mehdorn HM. Normative data and psychometric properties for qualitative and quantitative scoring criteria of the Five-Point Test. Clin Neuropsychol. 2009; 23: 675–690. doi:10.
1080/13854040802389185PMID:18923969
34. Tucha L, Aschenbrenner S, Koerts J, Lange KW. The Five-Point Test: Reliability, validity and normative data for children and adults. PLoS One. 2012; 7: e46080. doi:10.1371/journal.pone.0046080PMID: 23029395
35. Regard M, Strauss E, Knapp P. Children's production on verbal and non-verbal fluency tasks. Percept Mot Skills. 1982; 55: 839–844. PMID:7162920
![Fig 1. Five-dot patterns in parts 1 to 5 of the Ruff Figural Fluency Test [6,7].](https://thumb-eu.123doks.com/thumbv2/123dok_br/18403781.358994/3.918.301.857.114.256/fig-dot-patterns-parts-ruff-figural-fluency-test.webp)