Rev Saúde Pública 2004;38(5) www.fsp.usp.br/rsp
Validity of self-reported hypertension and its
determinants (the Bambuí study)
M aria Fernanda Lima-Costa, Sérgio Viana Peixoto and Josélia O liveira Araújo Firmo
Núcleo de Estudos em Saúde Pública e Envelhecimento (NESPE). Fundação Oswaldo Cruz. Universidade Federal de Minas Gerais. Belo Horizonte, MG, Brasil
Supported by Financiadora de Estudos e Projetos (FINEP - Process n. 66940009-00). Received on 4/9/2003. Reviewed on 5/4/2004. Approved on 17/5/2004. Correspondence to:
Maria Fernanda Lima-Costa
Centro de Pesquisas René Rachou - Fiocruz Av. Augusto de Lima, 1715
30190-002 Belo Horizonte, MG, Brasil E-mail: [email protected] Keywords
Blood pressure, Self-reported hypertension. Sensitivity and specificity.
Abstract
Objective
Assessing the validity of self-reported hypertension and its determinants among adults living in the community was the objective of this study.
Method
A simple random sample of residents in the city of Bambuí, State of Minas Gerais, Brazil aged ≥18 years was selected. Three blood pressure measurements were performed in 970 inhabitants. Sensitivity, specificity as well as positive and negative predictive values of self-reported hypertension were assessed in relation to hypertension (mean blood pressure ≥90 or ≥140 mm Hg and/or present use of anti-hypertensive drugs).
Results
Sensibility and specificity of self-reported hypertension were 72.1% (95% CI: 69.3-75.0) and 86.4% (95% CI: 84.3-88.6), respectively. Its prevalence was 27.2% (95% CI: 24.4-30.1), being reasonably similar to the prevalence of hypertension (23.3%; 95% CI: 20.7-26.1%). The validity of self-reported hypertension was higher among women, among individuals aged 40-59 and ≥60 years, among those who visited a doctor more recently (< two years) and among those with higher body mass index (≥25 kg/m2).
Conclusions
The results of this study show that self-reported hypertension is an appropriate indicator of hypertension prevalence, even in a population not living in a large urban center.
INTRODUCTION
Cardiovascular diseases are the leading causes of death in the Brazilian adult population, and of
hospi-tal admissions through the Sistema Único de Saúde
(Brazilian Unified Healthcare System), besides deliv-ery.10,11 Major causes of death among individuals over
age 25 years include cerebrovascular and ischemic dis-eases (98.2 and 91.5 per 100.000 population,
respec-tively).10 The major cause of hospital admission is
car-diac insufficiency, which accounts for 35% of all hos-pital admissions due to cardiovascular diseases in the
same age group.11
Arterial hypertension is the main modifiable risk factor for coronary disease, cerebrovascular diseases, congestive cardiac insufficiency, and other
cardiovas-cular diseases 13 The adequate treatment of arterial
hy-pertension significantly reduces cardiovascular
mor-bidity and mortality.4,12,15 Thus, knowledge of the
dis-tribution of hypertension among the population and the identification of vulnerable groups are of great interest to public health.
verifi-Rev Saúde Pública 2004;38(5) www.fsp.usp.br/rsp Validade da hipertensão arterial auto-referida
Lima-Costa MF et al
cohort study, in which all elderly inhabitants are
in-cluded.8 The present study is part of the former.
A complete census of the town of Bambuí was car-ried out in November 1994 in order to identify partici-pants for the health survey. A simple probabilistic sam-ple of 1,664 residents aged five years or older was selected, without reposition. The following parameters were used for calculating sample size: (a) size of the population =14,239; (b) precision =0.025; (c) confi-dence interval =0.95; (d) characteristic prevalence =0.50; and (e) losses =0.20. Of the residents included in the sample, 90.1% were interviewed and 82.5% ex-amined (physical measurements and laboratory exams). The participants of the study, both those interviewed and those examined, were similar to the town’s popula-tion of same age group in all sociodemographic char-acteristics analyzed: sex, age, marital status, family income, and schooling. Further details can be found in
Lima-Costa et al8 (2000). The present survey included
all participants of the Bambuí health survey aged ≥18
years whose blood pressure had been measured.
The dependent variable in this study is arterial hy-pertension, as defined by Joint Committee on Detec-tion, Evaluation and Treatment of High Blood
Pres-sure (JNC V)17 criteria (1993), that is, diastolic
pres-sure ≥90 mmHg and/or systolic pressure 140 mmHg
and/or current use of medication for arterial hyper-tension. Three measurements were performed, the first of which was discarded. Arterial pressure was consid-ered as the arithmetic mean of the second and third measurements. Measurements were taken with the subject seated, after a five-minute rest, and after at least 30 minutes without ingestion of caffeine and/or smoking. Medication use was assessed at the sub-ject’s home, through an interview which included the
verification of the medication package.1,8
Self-reported arterial pressure was determined us-ing a Portuguese translation of the question from
NHANES III mentioned above:19“Algum médico ou
profissional de saúde já disse que você tinha pressão alta ou hipertensão arterial?”.
The remaining exploratory variables studied were sex, age group, schooling (in completed years), monthly family income (in current Brazilian mini-mum wages), and time since last medical appoint-ment (in years), in addition to body mass index (BMI,
measured as weight (kg) /height (m)2).
Interviews were conducted at the subject’s home, and were composed of pre-coded questions. Interview-ers were selected from among membInterview-ers of the com-munity with at least 11 years of schooling and were
cation of the use of medication for its control.18 This has
encouraged the search for simple indicators, capable of being used in population-based studies. The simplest indicator of arterial hypertension is self-reported mor-bidity. Self-reported hypertension has been used in a number of health surveys, including the National Health and Nutrition Examination Survey (NHANES), in the
United States,19 and the Pesquisa Nacional por Amostras
de Domicílio (National Household Sample Survey
-PNAD 98), in Brazil.7 In the American survey,
informa-tion was obtained by means of the following quesinforma-tion: “Have you ever been told by a doctor or other health
professional that you had hypertension, also called high blood pressure?”.19 In the Brazilian survey, the
ques-tion adopted was: “Do you have hypertension (high
blood pressure)?”.7 The prevalence of self-reported
hy-pertension found in the United States was 27% among
participants ≥25 years old.20 In Brazil, the
correspond-ing prevalence was 20%.7
A number of different efforts have been made in or-der to validate self-reported morbidity related to arte-rial hypertension, as well as to discover its determi-nants. In the United States, high sensitivity (71%), specificity (90%), and positive (72%) and negative (89%) predictive values were found for the data
col-lected in NHANES III.20 In this survey, validity varied
with sex (greater among women), time since last medi-cal appointment (greater among those who had had medical appointments more recently), and presence of
overweight.20 No similar studies have been found in
Brazil. A study conducted among the employees of a state bank in Rio de Janeiro showed low sensitivity for
self-reported arterial hypertension,3 ranging form 42
to 50%, depending on the group studied. In another study conducted in the same city, an excellent reli-ability (Kappa =0.75) was found for the information regarding the history of diagnosis and treatment of arterial hypertension among participants of the
base-line of the Pró-Saúde Survey cohort.5
The present study is aimed at determining the valid-ity of self-reported hypertension among the partici-pants of the Bambuí health survey. An additional aim is to verify whether the validity of this indicator varies with sex, age group, schooling, family income, time since last medical appointment, and body mass index.
M ETH O D S
!
Rev Saúde Pública 2004;38(5) www.fsp.usp.br/rsp
Validade da hipertensão arterial auto-referida Lima-Costa MF et al
trained by the Project team. Health workers, also se-lected from among the members of the community, were trained to perform the anthropometrical and blood pressure measurements according to pre-estab-lished protocols. The equipments used were the fol-lowing: table sphygmomanometers – Tycos (5097-30, USA), stethoscopes – Littman (Cardiology II, USA), and anthropometers and digital scales – CMS Weighing Equipment Ltd. (UK). Data collection was
carried out between August and December 1996.8
Validity was determined based on four characteris-tics: sensitivity, specificity, and negative and positive predictive values. Sensitivity is the proportion of hy-pertensive subjects who reported a prior diagnosis of hypertension. Specificity is the proportion of normo-tensive subjects who reported not having previously been diagnosed as having hypertension. The positive predictive value is the proportion of hypertensive sub-jects among those who reported a prior diagnosis. The negative predictive value is the proportion of normo-tensive subjects among those who reported never hav-ing been diagnosed as havhav-ing arterial hypertension.
Multiple logistic regression was carried out in or-der to determine the variables independently associ-ated with hypertension. The initial model included all sociodemographic and anthropometric variables. Only variables which modified the magnitude of the odds ratio of self-reported hypertension to hyperten-sion in at least 10% were maintained in the final model. Statistical analyses were performed using Stata
v. 7.0 software.16
RESU LTS
Of the 1,086 participants of the Bambuí health sur-vey aged 18 years or older, 970 were included in the present study (116 were excluded for lacking blood pressure measurements). Global prevalences of self-reported hypertension and hypertension were 27.2% (95% CI =24.4-30.1) and 23.3% (95% CI =20.7-26.1), respectively.
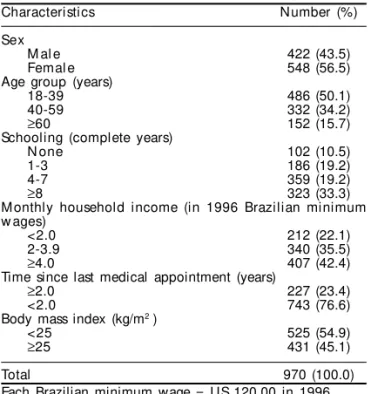
Sociodemographic and other characteristics of the studied sample are presented in Table 1. The predomi-nant groups in the sample were women (56.5%), young adults (50.1% were in the 18-39 years age group),
sub-jects with schooling ≥8 years (33.3%), with family
in-come ≥4 minimum wages (42.4%), who had had
medi-cal appointments less than two years prior to the
inter-view (76.6%), and with BMI >25.0 kg/m2 (54.9%).
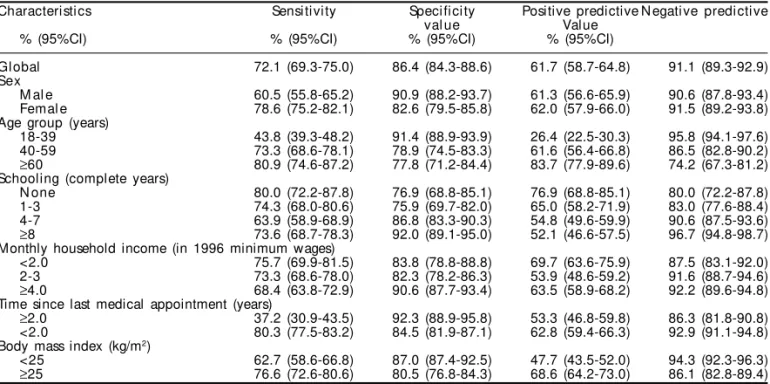
Table 2 presents the sensitivity, specificity, and posi-tive and negaposi-tive predicposi-tive values of self-reported hypertension in relation to hypertension as determined
by JNC V17 criteria. Global sensitivity and positive
predictive value were 72.1% (95% CI =69.3-75.0) and 61.7% (95% CI =58.7-64.8), respectively. Global specificity and negative predictive value were 86.4% (95% CI =84.3-88.6) and 91.1% (95% CI =89.3-92.9), respectively. The sensitivity of self-reported hyperten-sion was greater in women than in men, in the 40-59
and ≥60 years age groups in comparison with the
younger population, in subjects who had had medical appointments less than two years prior to the interview than in those who had not, and in subjects with BMI
≥25 kg/m2 in comparison with those with lower BMIs.
The final results of the multivariate analysis of fac-tors associated with hypertension are presented in Table 3. Independent associations were found for
self-reported hypertension, age group (40-59 and ≥60
years), time since last medical appointment (<2 years)
and BMI (≥25 kg/m2).
D ISCU SSIO N
The sensitivity and specificity of self reported hy-pertension found in the present study are very similar to those observed in the NHANES III survey, con-ducted in a representative sample of the United States
population.20 Sensitivity and specificity in that
sur-vey were 71% and 90%, respectively. In the present study, the corresponding values were 72% and 86%.
Generally speaking, our results confirm prior ob-servations regarding the greater validity of self-re-ported hypertension among women, overweight in-dividuals, and individuals with more recent medical
Table 1 - Study participants, according to sociodemographic and other selected characteristics, Bambuí Project, 1996.
Characteristics Number (%)
Sex
M al e 422 (43.5)
Femal e 548 (56.5)
Age group (years)
18-39 486 (50.1)
40-59 332 (34.2)
≥60 152 (15.7)
Schooling (complete years)
N one 102 (10.5)
1-3 186 (19.2)
4-7 359 (19.2)
≥8 323 (33.3)
Monthly household income (in 1996 Brazilian minimum w ages)
<2.0 212 (22.1)
2-3.9 340 (35.5)
≥4.0 407 (42.4)
Time since last medical appointment (years)
≥2.0 227 (23.4)
<2.0 743 (76.6)
Body mass index (kg/m2 )
<25 525 (54.9)
≥25 431 (45.1)
Total 970 (100.0)
" Rev Saúde Pública 2004;38(5) www.fsp.usp.br/rsp Validade da hipertensão arterial auto-referida
Lima-Costa MF et al
appointments.2,6,14,20 Considering all variables
stud-ied, the lowest sensitivity was found among subjects
with less recent medical appointments. Vargas et al20
(1997), in face of similar results, called attention to the possibility that part of this association be ex-plained by the greater probability of the healthcare user receiving medication against hypertension, which is one of the parameters considered in the defi-nition of arterial hypertension. In the present study, 125 subjects (12.9%) were classified as hypertensive based exclusively on the use of medication.
The same authors20 also point out that the greater
va-lidity of self-reported hypertension among women may be due to the greater utilization of the healthcare system and to overweight, both of which are more frequent among women. Our results support this hypothesis. The
multivariate analysis showed that the variable sex, when
included in the logistic model, did not alter the strength of the association between self-reported hypertension and hypertension, whereas time since last medical ap-pointment and BMI modified the magnitude of this association in an independent manner.
Prior studies have shown that the validity of
self-reported hypertension is not influenced by age.9,20
Our results do not confirm these observations. Con-sidering all characteristic studied, the second lowest sensitivity was found among the younger age group (18-39 years). This result cannot be due to confound-ing, since age modified the magnitude of the asso-ciation between self-reported hypertension and
hy-pertension regardless of sex, BMI, or use of healthcare services.
Prior observations have consistently shown that socioeconomic status does not affect the validity of self-reported morbidity for hypertension, both among non-Hispanic black and white Americans and among
Mexican-Americans.20 Our results support these
ob-servations. The validity of self-reported hypertension was not modified by family income or schooling.
In general, population-based studies of the
valid-Table 2 - Sensitivity, specificity, and positive and negative predictive values of self-reported arterial hypertension in relation to hypertension as determined by JNC V criteria,* according to sociodemographic and other selected characteristics. Bambuí Project, 1996.
Characteristics Sensitivity Specificity Positive predictive Negative predictive
value Value
% (95%CI) % (95%CI) % (95%CI) % (95%CI)
Global 72.1 (69.3-75.0) 86.4 (84.3-88.6) 61.7 (58.7-64.8) 91.1 (89.3-92.9) Sex
M al e 60.5 (55.8-65.2) 90.9 (88.2-93.7) 61.3 (56.6-65.9) 90.6 (87.8-93.4) Femal e 78.6 (75.2-82.1) 82.6 (79.5-85.8) 62.0 (57.9-66.0) 91.5 (89.2-93.8) Age group (years)
18-39 43.8 (39.3-48.2) 91.4 (88.9-93.9) 26.4 (22.5-30.3) 95.8 (94.1-97.6) 40-59 73.3 (68.6-78.1) 78.9 (74.5-83.3) 61.6 (56.4-66.8) 86.5 (82.8-90.2)
≥60 80.9 (74.6-87.2) 77.8 (71.2-84.4) 83.7 (77.9-89.6) 74.2 (67.3-81.2) Schooling (complete years)
N one 80.0 (72.2-87.8) 76.9 (68.8-85.1) 76.9 (68.8-85.1) 80.0 (72.2-87.8) 1-3 74.3 (68.0-80.6) 75.9 (69.7-82.0) 65.0 (58.2-71.9) 83.0 (77.6-88.4) 4-7 63.9 (58.9-68.9) 86.8 (83.3-90.3) 54.8 (49.6-59.9) 90.6 (87.5-93.6)
≥8 73.6 (68.7-78.3) 92.0 (89.1-95.0) 52.1 (46.6-57.5) 96.7 (94.8-98.7) Monthly household income (in 1996 minimum wages)
<2.0 75.7 (69.9-81.5) 83.8 (78.8-88.8) 69.7 (63.6-75.9) 87.5 (83.1-92.0) 2-3 73.3 (68.6-78.0) 82.3 (78.2-86.3) 53.9 (48.6-59.2) 91.6 (88.7-94.6)
≥4.0 68.4 (63.8-72.9) 90.6 (87.7-93.4) 63.5 (58.9-68.2) 92.2 (89.6-94.8) Time since last medical appointment (years)
≥2.0 37.2 (30.9-43.5) 92.3 (88.9-95.8) 53.3 (46.8-59.8) 86.3 (81.8-90.8) <2.0 80.3 (77.5-83.2) 84.5 (81.9-87.1) 62.8 (59.4-66.3) 92.9 (91.1-94.8) Body mass index (kg/m2)
<25 62.7 (58.6-66.8) 87.0 (87.4-92.5) 47.7 (43.5-52.0) 94.3 (92.3-96.3)
≥25 76.6 (72.6-80.6) 80.5 (76.8-84.3) 68.6 (64.2-73.0) 86.1 (82.8-89.4) *The Fifth Joint National Committee on Prevention, Detection, Evaluation and Treatment of High Blood Pressure (Diastolic pressure ≥90 mm Hg and/or systolic pressure ≥140 mm Hg and/or current history of treatment of arterial hypertension. 95%CI: 95% confidence interval).17
Table 3 - Fi nal resul ts of the mul tivari ate anal ysi s of characteri sti cs associ ated w i th arteri al hypertensi on according to JNC V criteria.* Bambuí Project, 1996. Characteristics Odds ratio (95%CI)**
Self-reported hypertension
N o 1.00
Yes 9.93 (6.58-14.98)
Age group (years)
18-39 1.00
40-59 3.81 (2.35-6.17)
≥60 10.91 (6.23-19.08)
Time since last medical appointment (years)
≥2.0 1.00
<2.0 1.83 (1.12-2.99)
Body mass index (kg/m2)
<25 1.00
≥25 2.73 (1.82-4.11)
*The Fifth Joint National Committee on Prevention, Detection, Evaluation and Treatment of High Blood Pressure (Diastolic pressure ≥90 mm Hg and/or systolic pressure ≥140 mm Hg and/or current history of treatment of arterial hypertension. **Odds ratio and 95% confidence interval adjusted for all variables listed on the table (956 subjects participated in the final analysis; pgoodness of fit =0.140).
#
Rev Saúde Pública 2004;38(5) www.fsp.usp.br/rsp
Validade da hipertensão arterial auto-referida Lima-Costa MF et al
REFEREN CES
1. Barreto SM, Passos VMA, Firmo JOA, Guerra HL, Vidigal PG, Lima-Costa MFF. Hypertension and clustering of cardiovascular risk factors in a community in Southeast Brazil – The Bambuí Health and Ageing Study. Arq Bras Cardiol 2001;77:576-81.
2. Bowlin SJ, Morrill BD, Nafziger AN, Jenkins PL, Lewis C, Pearson TA. Validity of cardiovascular disease risk factors assessed by telephone survey: the Behavioral Risk Factor Survey. J Clin Epidemiol 1993;46:561-71.
3. Centers for Disease Control and Prevention. Plan and operation of the Third National Health and Nutrition Examination Survey, 1988-94. National Center for Health Statistics. Vital Health Stat 1994;1:129.
4. Chor D. Hipertensão arterial entre funcionários de um Banco Estatal no Rio de Janeiro. Arq Bras Cardiol 1998;71:653-60.
5. Dalhof B, Lindholm LH, Hansson L, Schersten B, Tord E, Wester PO. Morbidity and mortality in the Swedish Trial in Old Patients with Hypertension (STOP-Hypertension). Lancet 1991;338:1281-5.
6. Faerstein E, Chor D, Lopes CS. Reliability of the information about the history of diagnosis and treatment of hypertension. Differences in regard to Sex, age, and educational level. The Pró-Saúde Study. Arq Bras Cardiol 2001;76:301-4.
7. Ford ES, Hareal Y, Heath G, Cooper RS, Caspersen CJ. Test characteristics of self-reported hypertension among the Hispanic population: findings from the Hispanic Health and Nutrition Examination Survey. J Clin Epidemiol 1990;43:159-65.
8. [JVC V] Fifth Report of the Joint Committee on Detection, Evaluation and Treatment of High Blood Pressure. Arch Int Med 1993;153:154-83.
9. [JVC VII] Seventh Report of the Joint National Committee on Prevention, Detection, Evaluation, and Treatment of High Blood Pressure. JAMA
2003;289:2560-72.
10. [IBGE] Fundação Instituto Brasileiro de Geografia e Estatística. Pesquisa Nacional por Amostra de Domicílios (PNAD 98). Rio de Janeiro; 1998.
11. Lima-Costa MFF, Uchoa E, Guerra HL, Firmo JOA, Vidigal PG, Barreto SM. The Bambuí Health and Ageing Study (BHAS): methodological approach and preliminary results of a population based cohort study of the elderly in Brazil. Rev Saúde Pública
2000;34:126-35.
12. Martin LM, Leff M, Colonge N, Garrett C, Nelson DE. Validation of self-reported chronic conditions and health services in a managed care population. Am J Prev Med 2000;18:215-8.
13. Ministério da Saúde. Secretaria de Informática. Departamento de Informática do Sistema Único de Saúde. Sistema de Informações sobre Mortalidade (SIM), 2000. [CD ROM]. Brasília (DF); 2002.
14. Ministério da Saúde. Secretaria de Informática. Departamento de Informática do Sistema Único de Saúde. Movimento de Autorização de Internação Hospitalar, 2000. [CD ROM]. Brasília (DF); 2001.
15. MRC Working Party. Medical reserach council trial of treatment of hypertension in older adults: principals results. Br Med J 1992;304:405-12.
16. National Hight Blood Pressure Education Program Working Group. National High Blood Pressure Education Program Working Group in the Elderly. Hypertension 1994;23:275-85.
17 Sharlin KS, Heath GW, Ford ES, Welty TK.
Hypertension and blood pressure awareness among Americans Indians of the Northern Plains. Ethnicity Dis 1993;3:337-43.
18. SHEP Cooperative Research Group. Prevention of stroke by antihypertensive drug treatment in older persons with isolated systolic hypertension. JAMA 1991;265:3255-64.
19. Vargas CM, Burt VL, Gillum RF, Pamuk ER. Validity of self-reported hypertension in the National Health and Nutrition Examination Survey III, 1988-1991. Prev Med 1997;26:678-85.
ity of self-reported hypertension that use measured blood pressure as the gold standard are subject to classification bias due to the tendency towards
re-gression to the mean.20 In the present study, three
blood-pressure measurements obtained on the same day were used, which may have reduced the strength of the associations found.
The results presented above show that self-reported
hypertension is an appropriate indicator for arterial hy-pertension, even in a population living outside large urban centers. The similarity between the present results
and those obtained in the NHANES III survey20 confirm