Atmos. Chem. Phys., 12, 271–285, 2012 www.atmos-chem-phys.net/12/271/2012/ doi:10.5194/acp-12-271-2012
© Author(s) 2012. CC Attribution 3.0 License.
Atmospheric
Chemistry
and Physics
The impact of channel effect on Asian dust transport dynamics:
a case in southeastern Asia
C.-Y. Lin1, Y.-F. Sheng1, W.-N. Chen1, Z. Wang2, C.-H. Kuo3, W.-C. Chen1, and T. Yang2
1Research Center for Environmental Changes, Academia Sinica, Taipei, Taiwan
2State Key Laboratory of Atmospheric Boundary Layer Physics and Atmospheric Chemistry (LAPC), Institute of Atmospheric Physics, Chinese Academy of Science, Beijing 100029, China
3Department of Geology, Chinese Culture University, Taipei, Taiwan
Correspondence to:C.-Y. Lin ([email protected])
Received: 8 August 2011 – Published in Atmos. Chem. Phys. Discuss.: 22 September 2011 Revised: 16 December 2011 – Accepted: 20 December 2011 – Published: 5 January 2012
Abstract. A super heavy dust event was identified with
un-precedented PM10in terms of speed and concentration in the southeastern Asia. The average concentration was observed exceeding the value of 1000 µg m−3for the duration lasting more than 10 h, with the highest value reached 1724 µg m−3 in northern Taiwan on 21 March 2010. We found that this case exhibited an uneven and intriguing spatial distribution of PM10concentration and transport speed between eastern and western Taiwan. Higher values were observed in the western and northern areas. The peak concentrations can vary up to 5-fold between western and eastern Taiwan, and ten-fold be-tween the northern tip and southern tip of Taiwan, only about 400 km apart. A high resolution, 10 km, numerical study by Weather Research Forecast (WRF) and WRF-chem models revealed that this intriguing spatial distribution of the Asian dust transport was resulting from a strong coupling effect of the geographic channel effect and blocking of the easterly from the Pacific Ocean. We are confident that this coupling effect can be revealed only by applying a high resolution nu-merical study in other similar regions.
1 Introduction
The impact of mineral dust on Atmos. Environ. and climate has been well documented in the last few decades. Aero-lian dust has the ability to affect the radiation balance, cloud physics and chemical processes, and hence could have an im-pact on the regional and even global climate. Over East Asia, the frequent outbreak of Asian dust following the continental outflow during spring is one of the largest environmental con-cerns in the region; for areas such as Japan (e.g. Kanayama et al., 2002; Uematsu et al., 2002; Uno et al., 2001, 2008, 2009;
Eguchi, 2009), Korea (Chun et al., 2001; In and Park, 2003; Kim et al., 2005), Taiwan (Lin et al., 2004, 2005, 2007a) and even as far south as Hong Kong (Gao et al., 2003; Fang et al., 1999; Wai and Tanner, 2005). Especially Japan and Ko-rea are frequently affected by the heavy dust events as they are located just downwind of the strong westerly winds that prevail during the dust season. For example, Sun et al. (2001) estimated that about 67 % of the pathways of suspended dust move across the continent, Korea, and Japan; north of 35◦
N to the North Pacific Ocean, while only 33 % move south of 30◦N. In other words, about one-third of total dust events could be transported towards the areas south of 25◦N, Tai-wan included.
Taiwan is located southeast off Mainland China. The prevailing northeasterly monsoon during winter and spring dominates the weather pattern and determines the air qual-ity through the significant long-range transport (LRT) events southward over Taiwan. However, the impact of LRT events on the air quality of Taiwan is quite inhomogeneous as to the spatial distributions. For example, Lin et al. (2004, 2005) indicated that the impact of LRT Asian dust and air pollu-tants on air quality over central and southwestern cities in Taiwan is insignificant. This phenomenon could be attributed to the blocking effect of the central mountain range (CMR). The CMR occupies about two thirds of Taiwan’s land mass (300 km×100 km) and lies NNE-SSW (Fig. 1c) with an av-erage terrain height of about 2000 m (Yeh and Chen, 1998; Lin and Chen, 2002; Lin et al., 2011) and some peaks of nearly 4000 m. The CMR significantly affects the local cir-culation and interferes with the prevailing winds (Lin and Chen, 2002; Lin et al., 2005), and hence could also affect LRT dust events and their spatial distribution over Taiwan.
272 C.-Y. Lin et al.: The impact of channel effect on Asian dust transport dynamics
(m)
b)
a)
MC KM
TM(707)
Hong Kong
MG
TC PCY
WL YM (750) SL (1724)
GY (1326)
CH (1075)
TN (1066)
ZY (976)
YL (909)
HL (598)
TT (185)
HC (132)
c)
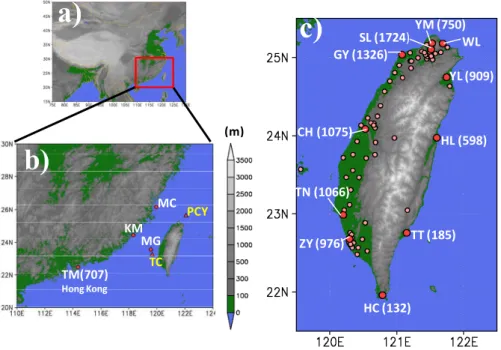
Fig. 1. (a)Location of Taiwan and surrounding countries in East Asia. (b)Location of Taiwan Environmental Protection Administration
(TEPA) island stations (MC, KM and MG) and Central Weather Bureau meteorological stations (PCY, TC) in the Taiwan Strait and Ta-Men (TM) station at Hong Kong. The number in parentheses indicates the peak concentration of the TM during this episode. (c)Location of TEPA ground monitoring stations (closed circles) of air quality network in Taiwan with topography. The numbers in parentheses indicate the peak concentrations of the selected stations (big closed circles) during this episode.
As a matter of fact, the unique structure of the CMR plays an important and dynamic role in affecting the prevailing northeasterly winds and fronts during winter (December– February) and spring (March–May), as has been documented by some researchers (Chen and Lin, 1999; Chen and Hui, 1990; Trier et al., 1990; Chien and Kuo, 2006). For exam-ple, Chien and Kuo (2006) documented from theoretical pro-posed that the CMR can induce divergence and convergence and modify the intensity of the front when it passes over Tai-wan. Lee and Hills (2003) indicated that the flow could be channeled and accelerated over the Taiwan Strait. Due to Wuyi Mountain along the coast of southeast China (highest peak at 2120 m) and the CMR of Taiwan, the winds are much stronger over the Taiwan Strait than over land on the both sides (Chang, 1989; Lee and Zhang, 1992). However, up to now, there is no literature that discusses this impact on dust transport. We examine this mechanism for a super dust transport event through a modeling study and data analysis in Sects. 3 and 4.
According to the hourly measurements of Taiwan En-vironmental Protection Administration (TEPA) air quality monitoring stations, a super heavy dust event was identi-fied on 21 March 2010. Within a few hours, the PM10 concentrations in northern Taiwan dramatically peaked to higher than 1000 µg m−3and were sustained for longer than 10 h at most of the monitoring stations. For example, the most serious was at Shihlin (SL) station (Fig. 1c); from
03:00 LST (97 µg m−3)to 10:00 LST (1393 µg m−3), peak-ing at 1724 µg m−3 at 12:00 LST (Fig. 2a); on 21 March 2010, brought along by the strong northeasterly. This was the highest Asian dust concentration event ever recorded in Taiwan. Following the transport of air masses southward, we have found that this case had significantly different spa-tial distributions of PM10 concentration and transport speed between western and eastern Taiwan. The PM10 concentra-tions mostly ranged from 1300 to 900 µg m−3over western Taiwan and Penghu Island (Taiwan Strait, MG station), and at Hong Kong it was as high as 707 µg m−3(Fig. 1b). How-ever, over stations Hualien (HL) and Taitung (TT) in east-ern Taiwan (Fig. 1c), peaks were only 598 and 185 µg m−3, respectively. Moreover, the concentration was only about 132 µg m−3at Hungchun (HC) station at the southern tip of Taiwan (Fig. 1c), which is at the same latitude as Hong Kong. This large discrepancy in the PM10 concentration between east and west Taiwan associated with dust transport, as well as the roles of the unique geographic structures in Taiwan and southeastern China, are investigated in this study. A high res-olution WRF/Chem model was used to study these processes in this complex terrain and to examine the mechanisms for the dust transport around and over Taiwan.
a)
b)
(Hong‐Kong)
c)
Fig. 2. (a)Hourly concentration variation of PM10 (µg m−3)for
the selected stations (SL, WL, YM, CH, TN and ZY) at Taiwan’s western plain during 12:00 LST, 20–23 March 2010. (b)Hourly concentration variation of PM10(µg m−3)for the selected stations
(YL, HL, TT and HC) at eastern Taiwan during 12:00 LST, 20–23 March 2010.(c)Hourly concentration variation of PM10(µg m−3)
for the island stations (MC, KM and MG) in the Taiwan Strait and station TM at Hong Kong during 12:00 LST, 20–23 March 2010.
2 Data source and model description
2.1 Data source
Measurements of hourly PM10 and other pollutants were taken from TEPA air quality monitoring stations (Fig. 1c), which include more than 70 stations in Taiwan. Meteorolog-ical parameters, i.e. surface temperature, wind direction and speed, and rainfall, as well as atmospheric concentrations of PM10and some air pollutant species (NOx, CO, SO2, VOC) are observed at TEPA stations in Taiwan. In this study, we mainly focused on the variations in PM10(the coarse ambient particle) concentration.
1
a)
b)
c)
d)
(μgm‐3) (μgm‐3)
(μgm‐3) (μgm‐3)
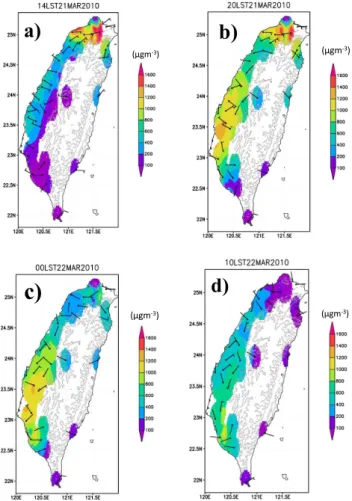
Fig. 3.Spatial distribution of observation PM10(µg m−3)
concen-tration and wind recorded in Taiwan at(a)14:00 LST, 21 March(b)
20:00 LST, 21 March(c)00:00 LST, 22 March(d)10:00 LST, 22 March.
Reported dusty locations over Asia, derived from the Global Telecommunication System (GTS) SYNOP report data, were used to roughly identify the simulation of dust storm transport. Vertically-resolved extinction and de-polarization measurements of atmospheric aerosols from CALIPSO have been employed in this study. NASA Cloud-Aerosol Lidar with Orthogonal Polarization (CALIOP) was launched onboard the CALIPSO satellite on 28 April 2006 (Winker et al., 2007). The CALIPSO Lidar Level 2 aerosol profile data using the CALIPSO Lidar Ratio selection algo-rithm was used in this study (Omar et al., 2009). The Level 2B (version 3.0) data products provided profiles of the ex-tinction coefficient at 532 nm and 1064 nm and of the particle depolarization ratio at 532 nm. CALIPSO, with its ability of depolarization measurement, can be applied to discriminate dust from other types of aerosols (Liu et al., 2008). Fur-thermore, the direct broadcast real-time retrievals of Aerosol Optical Depth (AOD) (550 nm) from the Moderate Resolu-tion Imaging Spectroradiometer (MODIS) instrument aboard
274 C.-Y. Lin et al.: The impact of channel effect on Asian dust transport dynamics
a)
b)
c)
d)
e)
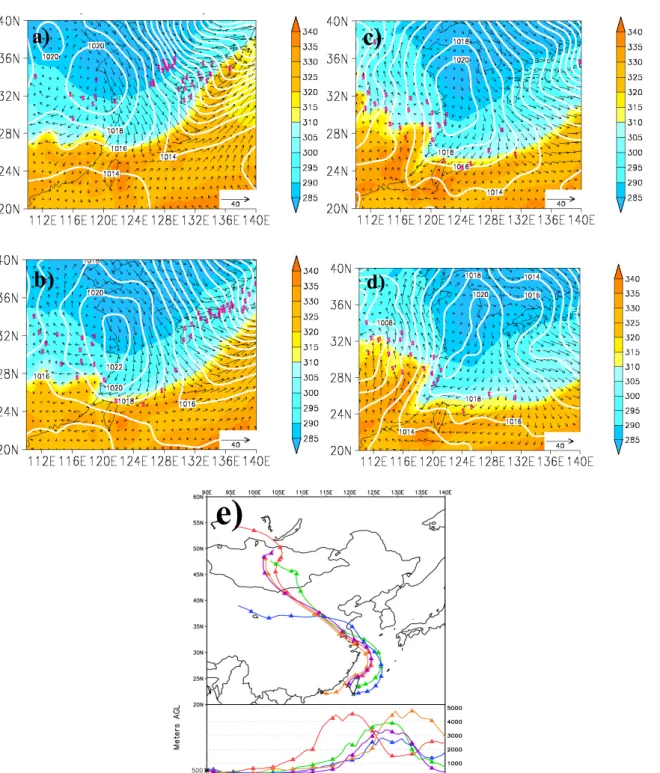
Fig. 4. (a)The ground dust reports (denoted by dollar signs) are from Global Telecommunication System (GTS) data. Wind field and theta-e
(colored) are deduced from NCEP GFS data at 925 hPa level and contour lines are represented for sea-surface pressure at 18:00 UTC 20 March 2010.(b)Same as(a)but for 00:00 UTC, 21 March 2010.(c)Same as(a)but for 06:00 UTC, 21 March 2010. (d)Same as(a)but for 12:00 UTC, 21 March 2010.(e)Result of the HYSPLIT model 3-day backward trajectory analysis at altitude of 500 m starting from the time of peak value for stations at Taiwan (WL, HL, HC, MG) and TM at Hong Kong.
PCY TC
a)
b)
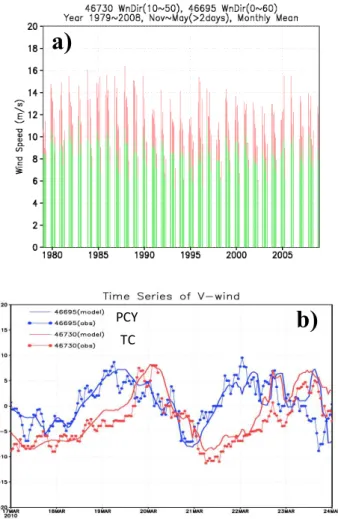
Fig. 5. (a)Time series of monthly average wind speed during
north-easterly monsoon (November–May) for station TC (red bars) and station PCY (green bars) between 1979 and 2008.(b)The observa-tion and simulaobserva-tion N-S component of wind speed at staobserva-tions PCY (blue) and TC (red) during 00:00 LST, 17–24 March 2010.
the Terra satellite have also been used for monitoring particle matter spatial distribution in East Asia.
2.2 Model description
In order to identify sources of the high dust concentration that occurred on 21 March 2010 and to examine how transport paths could affect the dust concentration profile in Taiwan, the HYSPLIT (Hybrid Single-Particle Lagrangian-Integrated Trajectory) model (Draxler and Hess, 1988) was used to trace the origins of the air masses. Furthermore, we employed the WRF/Chem (Ver. 3.2) (Grell et al., 2005) modeling sys-tem to identify the long-range transport associated with the dust episode over northern China in this study. The meteoro-logical initial and boundary conditions for WRF/Chem were obtained from National Center for Environmental Prediction (NCEP) Global Forecast System (GFS) 0.5◦×
0.5◦
analysis data sets (26 vertical levels) at a 6 h interval. The Yonsei
Uni-versity (YSU) (Hong and Dudhia, 2003) planetary bound-ary layer scheme was selected in this study. The horizontal resolution for our dust simulations was 10 km and the grid box had 541×391 points in both the east-west and north-south directions. There were 51 vertical levels and the lowest level was about 20 m above the surface. To assure the me-teorological fields were well simulated, the four-dimensional data assimilation (FDDA) scheme was activated based on the NCEP-GFS analysis data. The Georgia Tech/Goddard Ozone Chemistry Aerosol Radiation Transport (GOCART) (Chin et al., 2000, 2002) dust module was employed to represent dust emission in the WRF model.
3 Data analysis
3.1 Spatial distribution of PM10concentration
Figure 2a–c shows the time series of the hourly PM10 con-centration from air quality monitoring stations in Taiwan. At station WL (Fig. 2a), which is located at the windward side of the northern tip of Taiwan (Fig. 1c), the PM10 concen-tration dramatically increased within 6 h from 88 µg m−3(at 03:00 LST) to 1000 µg m−3(at 09:00 LST) and lasted about 12 h (09:00–21:00 LST) on 21 March 2010. It should be noted that the peak concentration here was also 1000 µg m−3 and it remained at the same value for 12 h. This is because the range of the maximum concentration measurement was set at 1000 µg m−3as the expected value at this station. Ac-tually, the peak value was artificially limited at 1000 µg m−3 at eight stations in northern Taiwan (15 stations in total over Taipei City and New Taipei City); therefore, these stations did not actually show the exact peak values. Fortunately, the peaked PM10 concentrations of five urban stations in north-ern Taiwan, Shihlin (SL) (Fig. 1c), Jhongshan (JS), Wanhua (WH), Guting (GT), and Shonshan (SS), were not limited, and PM10 concentrations of higher than 1500 µg m−3were measured at these during the duration of this episode. At ur-ban station SL (Fig. 2a), the peaked PM10concentration was as high as 1724 µg m−3at 12:00 LST, 21 March. This is the highest hourly concentration ever recorded for the monitor-ing stations of TEPA.
Following the air mass southward over Taiwan’s west-ern plain, the peak PM10 concentrations were; 1326 and 1075 µg m−3at Guan Yin (GY) and Changhua (CH), respec-tively (Fig. 1c). Even at southwestern Taiwan, e.g. at Zuoyin (ZY) (Figs. 1c and 2a), it peaked at higher than 900 µg m−3 despite a time lag of about 10 h due to the long-distance transport from the north. However, over eastern Taiwan, there was a significant concentration decrease from the north to the south (Fig. 1c). The peak concentration at Yilan (YL) was higher than 900 µg m−3, while at Hualien (HL) it was 598 µg m−3. However, the peak concentration at Taitung (TT) was lower than 200 µg m−3 (Figs. 1c and 2b). The peak of PM10 concentration at the southern tip of Taiwan,
276 C.-Y. Lin et al.: The impact of channel effect on Asian dust transport dynamics
280 560 840 1120
PM10 (μ g/m3)
a)
b)
c)
d)
e)
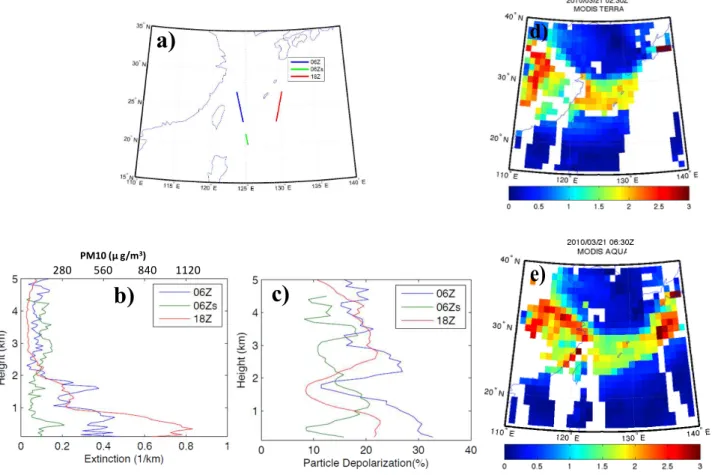
Fig. 6. (a)The CALIPSO orbit tracks around Taiwan at 06:00 UTC (blue and green), and 18:00 UTC (red), 21 March 2010.(b)The vertical
distribution of extinction coefficient and PM10concentration deduced from CALIPSO Lidar at orbit tracks in(a)around Taiwan. (c)The vertical distribution of the percentage of depolarization ratio from CALIPSO Lidar at orbit tracks in(a)around Taiwan. (d)The aerosol optical depth (AOD) deduced from the MODIS satellite at 02:30 UTC, 21 March 2010.(e)Same as(d)but for at 06:30 UTC.
Hunchun (HC) station, was only about 132 µg m−3(Figs. 1 and 2b). In other words, this super dust event did not seem to have had an impact on the southern tip of Taiwan. If we compare the peak concentrations of the stations in the east of Taiwan with those of similar latitude in the west, i.e. CH (1075 µg m−3)with HL (598 µg m−3)(central Taiwan) and ZY (976 µg m−3)with TT (185 µg m−3)(southern Taiwan) (Fig. 1c), the concentrations over western Taiwan is signifi-cantly higher than those over the east. The variation ratio was estimated at about factor of two to five between west and east over central and southern Taiwan. Furthermore, the variation of the peak concentration between the northern tip (WL, es-timated at>1500 µg m−3)and the southern tip (Hengchun, 132 µg m−3), only about 400 km apart, was greater than fac-tor of ten. Figure 3a–d shows the variations of the wind field and spatial PM10 concentration over Taiwan on 21 March 2010. It is important to note that the spatial distributions of PM10concentration in Taiwan were quite inhomogeneous for this case. Moreover, at Yang-Ming (YM) Mountain station (altitude about 800 m) in northern Taiwan, the PM10 concen-tration was dramatically down to about half of that of
moni-toring stations in Taipei, i.e. 750 µg m−3(Fig. 1c). Therefore, the vertical decrease in concentration is also noteworthy.
This super dust event not only impacted on the air qual-ity of Taiwan and the small islands in the Taiwan Strait, but also as far south as Hong Kong. The stations at the small islands from north to south are Matzu (MT), Kinmen (KM), and Magong (MG) (Fig. 1b). Unfortunately, the peak val-ues at these stations were also artificially set at 1000 µg m−3 (Fig. 2c) for the same reason we mentioned earlier. How-ever, one can clearly identify the evidence of the transport from the north. The air quality over Hong Kong, located in south China, was also significantly influenced by this episode as evidenced at Ta-Men (TM) station (Fig. 1b, lat-itude south from 22◦
N). The PM10 concentration at TM peaked at about 707 µg m−3 from 20:00 LST (Fig. 2c), 21 March to 09:00 LST, 22 March. Interestingly, the PM10 con-centration at station HC at the southern tip of Taiwan was only 132 µg m−3 although it lies at about the same latitude as Hong Kong station TM (Fig. 1b and c). The mechanisms causing these unique distributions are further examined from data analyses and simulation in the following sections.
a)
b)
c)
d)
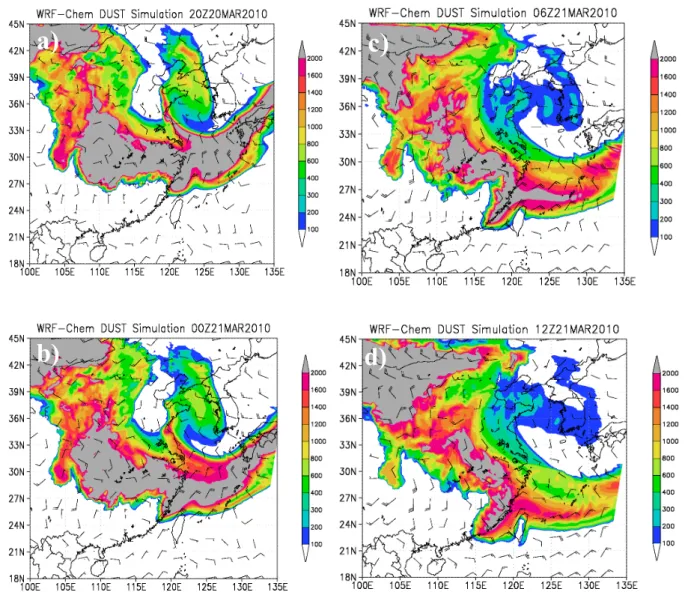
Fig. 7. The simulation spatial distribution of PM10 concentration and wind field at 1000 hPa. A full (half) wind barb indicates 5 ms−1
(2.5 m s−1). (a)20:00 UTC, 20 March 2010. (b)00:00 UTC, 21 March 2010. (c)06:00 UTC, 21 March 2010. (d)12:00 UTC, 21 March 2010.
3.2 Synoptic weather and GFS data analysis
Figure 4a–d shows 925 hPa recorded wind, theta-e (colored) and sea-surface pressure (contour) from NCEP GFS data set. The ground dust reports (denoted by dollar signs) from GTS data are also shown in Fig. 4a–d. According to GTS data, at 00:00 UTC (08:00 LST), 21 March, dust was already re-ported over southern China and Taiwan (Fig. 4b) and dust was still reported even at 06:00 UTC (14:00 LST, 21 March) (Fig. 4c) and 12:00 UTC (20:00 LST, 21 March) (Fig. 4d). Atmospheric conditions were considerably stable and it was evident that there was a separate high at about 1023 hPa at the coastal area around Shanghai at 18:00 UTC, 20 March (02:00 LST, 21 March, UTC + 8 h = LST), 2010 (Fig. 4a). It is clear that the front lies in a NE-SW direction, located from Japan to northeast off Taiwan at 18:00 UTC, 20 March 2010.
Following the movement of the front toward the east and south, the northwesterly continental outflow north of 28◦
N changed to north-northeasterly around northern Taiwan af-ter 00:00 UTC, 21 March 2010 (Fig. 4b). The processes concerned with the movement of continental outflow over East Asia have been described by Bole and Chen (1987). After that, the temperature gradient gradually decreased in the meridional direction, and the northeasterly flow gradually changed to easterly east of Taiwan due to a Pacific high dom-inating the flow pattern after 06:00 UTC, 21 March (Fig. 4c and d).
The easterly flow interacted with the CMR and then formed a cyclonic flow pattern over northern Taiwan and an anti-cyclonic curvature over southern Taiwan (Fig. 4c and d) (Lee and Zhang, 1992) due to the small Froude number of the flow (Hunt and Snyder, 1980; Lin and Chen, 2002; Lin
278 C.-Y. Lin et al.: The impact of channel effect on Asian dust transport dynamics
a)
(μgm-3)
(μgm-3)
b)
Fig. 8. Temporal variation of observation (solid) and simulation
(dashed) PM10 concentration around Taiwan at stations, SL, CH,
MG, HL and HC from 21:00 LST, 20 March to 07:00 LST, 22 March 2010.
et al., 2007b). We also noted that directional variation of the northerly flow was limited north of central Taiwan and east of the CMR between 00:00 UTC and 06:00 UTC, 21 March (Fig. 4b and c). However, over the Taiwan Strait, the speed of the southward cold front was accelerated (Chen and Hui, 1992; Lee and Hills, 2003; Chien and Kuo, 2006) due to the topographic channel effect between the Wu-Yi mountain of Southeast China and the CMR (Fig. 4b and c). The depth of the northeasterly continental outflow is usually below 1500 m as for the subsidence in the wake of a cold frontal passage. Therefore, the CMR has the ability to block the northeast-erly flow and the Pacific warm flow from the east. In other words, it is difficult for the easterly flow associated with a Pacific high to enter over the Taiwan Strait. It is believed that
Fig. 9. Schematic illustration of cross-sections (NE1, NE2, EW1
and EW2) in this study.
the blocking effect of the CMR might play an important role in this phenomenon (Lin et al., 2005, 2007b; Chen and Hui, 1990). Tracing the air mass trajectory back from the start of peak concentrations at the different locations around Taiwan (stations WL, HC, HL, and MG) and Hong Kong for 72 h at 500 m height (Fig. 4e), it is clear that air parcels were mainly from northern China and originated at high altitude (above 3 km) following a typically subsiding high-pressure system to Taiwan.
3.3 Surface wind data analysis
As mentioned in the introduction and NCEP GFS data analy-sis, the enhanced wind speed over the Taiwan Strait resulted in a channeling effect during the northeasterly monsoon. We examined the wind field variation over two stations on two small islands to identify the reasons for this phenomenon. One is the PCY station (46 695, 122.07◦
E, 25.62◦
N) located off northern Taiwan and the other is the TC station (46 730, 119.66◦
E, 23.26◦
N) located in the Taiwan Strait off China (Fig. 1b). The PCY station represents the upstream station during the strong northeasterly flow while the TC station is downwind. To reasonably identify the impact of chan-nel effect, the average wind directions between 0◦
and 60◦ at the PCY station and between 10◦
and 50◦
at the TC sta-tion, sustained for at least two days, were counted during the northeasterly monsoon (From November to May). Figure 5a shows the average monthly wind speeds at PCY (green bars) and TC (red bars) for the last three decades (1979–2008). The average wind speeds for TC and PCY are 11.97 m s−1 and 8.63 m s−1, respectively. It is important to note that the average wind speed at TC is about 3 m s−1greater than that at PCY. The climatological difference between these two stations roughly illustrates the channel effect of wind speed enhancement over the Taiwan Strait. Figure 5b shows the observation (solid with dot) and WRF simulation (solid)
a)
b)
c)
d)
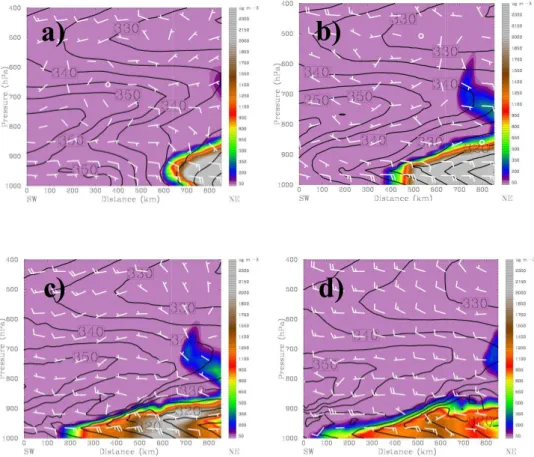
Fig. 10. The cross-section distribution of wind field, theta-e (contour) and PM10 concentration (colored) along NE1 in Fig. 9 at (a)
18:00 UTC, 20 March(b)00:00 UTC, 21 March(c)06:00 UTC, 21 March(d)12:00 UTC, 21 March. A full (half) wind barb indicates 5 m s−1(2.5 m s−1).
meridional component of wind field at stations PCY and TC from 17 to 23 March 2010. According to frontal passage around 21 March, wind directions were gradually changing from southerly (20 March, positive value) to northerly (nega-tive value). Although change of wind direction into northerly takes a few hours, the wind speed at TC was significantly stronger than that at PCY for both the observation and model simulation on 21 March 2010. This phenomenon is clearly a response to the mechanism of channel effect mentioned ear-lier, which in turn is clearly responsible for the spatial dis-tribution of PM10 concentration analyzed in Sect. 3.1. The southward transport of dust concentration west of the CMR is significantly faster than that on the east.
3.4 CALIPSO and AOD data analysis
Figure 6b–c shows the average vertical aerosol extinction, mass concentration (PM10), and particle depolarization pro-files of the CALIPSO lidar retrieved at path around Tai-wan between 23◦
N and 27◦
N (blue line in Fig. 6a) at 06:00 UTC, 21 March 2010. According to Sugimoto et al. (2011), the dust mass concentration (PM10)could be es-timated by adopting a dust mass/extinction conversion factor
(about 1400 µg m−3km) based on in-situ surface dust mea-surement. In order to increase signal-to-noise ratio, the res-olution of altitude for particle depolarization had been re-duced from 30 m to 400 m. Figure 6b shows the significant aerosol layer is below 2 km and that it peaked at around 1 km with extinction coefficient about 0.4 km−1 (PM10≈ 600 µg m−3)at 06:00 UTC, 21 March; the particle depolar-ization ranged from 20 % to 30 % (Fig. 6c) indicates this aerosol layer is predominated by dusts (Murayama et al., 1999; Chen et al., 2007). However, for the section along this path (green line in Fig. 6a) south of 22◦
N (ranging be-tween 20◦
N and 22◦
N), the vertical profile of extinction co-efficient is about 0.1 km−1. A thin layer with higher extinc-tion is about 0.2 km−1 and with the lowest depolarization (<10 %) at 0.5 km. The low particle depolarization of this thin layer is significantly different from dust air mass, i.e. the north section (blue line in Fig. 6b–c). This thin layer is probably a mixture of dust and spherical water droplet or fine mode anthropogenic aerosols. In other words, the dust southward transport east of Taiwan is mainly north of 22◦
N. At 18:00 UTC, 21 March, another CALIPSO track passed around 130◦
E, which shows that the average extinction coef-ficient between 23◦
N and 27◦
N (red line in Fig. 6a) reached
280 C.-Y. Lin et al.: The impact of channel effect on Asian dust transport dynamics
a)
b)
c)
d)
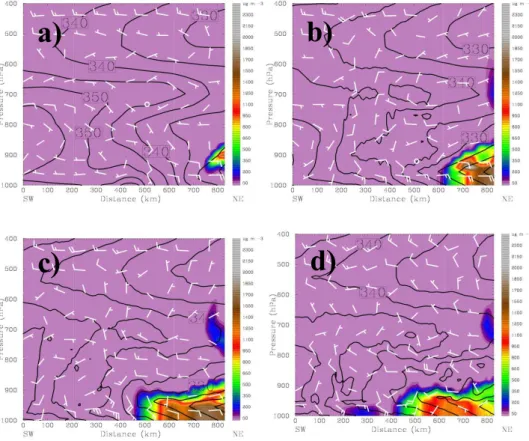
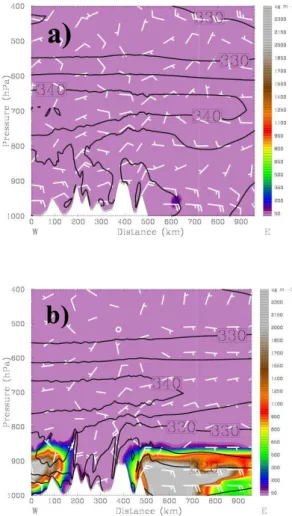
Fig. 11. The cross-section distribution of wind field, theta-e (contour) and PM10 concentration (colored) along NE2 in Fig. 9 at (a)
18:00 UTC, 20 March(b)00:00 UTC, 21 March(c)06:00 UTC, 21 March(d)12:00 UTC, 21 March. A full (half) wind barb indicates 5 m s−1(2.5 m s−1).
as high as 0.8 km−1(PM10≈1100 µg m−3)and that particle depolarization below 1 km was around 20 % (Fig. 6b–c). The vertical retrievals indicated the dusts were transported from north to south within 12 h and the major depth of the dust concentration was mainly below 1 km. The aerosol extinc-tion and particle depolarizaextinc-tion significantly decreased from 0.4–0.8 km−1and 30 % to 0.1 km−1and 10 %, respectively, between 500 and 2000 m (Fig. 6b–c). This is consistent with our earlier conclusion that dust concentration significantly decreased vertically in northern Taiwan.
The aerosol optical depth (AOD) (550 nm) derived from MODIS satellite indicated a high AOD belt around 2.0 located between 25 and 30◦
N at 02:30 UTC, 21 March (Fig. 6d). Later on, at 06:30 UTC, the high AOD ranged from 2.5 to 3.0 over the Taiwan Strait while only at about 0.5 over eastern Taiwan (Fig. 6e). The spatial distribution of AOD clearly identified the dust transport inhomogeneous aerosol concentrations over both sides of the CMR.
4 Model simulation and discussion
4.1 Spatial distribution
Figure 7a–d shows the WRF/chem model simulated spatial distribution of Asian dust transport from China to Taiwan between 20 and 21 March 2010. An east-west high dust con-centration belt (40–45◦
N) was located over northern China and shifted in a north-south direction to around 105–115◦
E (Fig. 7a). Following the continental outflow associated with a high pressure system, the high concentration dust belt formed a U-shape over East Asia during study period (Fig. 7a–d). As mentioned earlier in Fig. 4a–b, a separate high pressure sys-tem was located around Shanghai that dominated the strong northeasterly flow over the Yellow Sea and East China Sea and pushed the dust air mass southward (Fig. 7a–d). It is ob-vious that the dust air mass was transported faster over the Taiwan Strait than over eastern Taiwan (Fig. 7b–d) because of the channel effect between Wu-Yi Mountain and the CMR of Taiwan. Moreover, the spatial dust concentration east of the CMR was mainly north of 24◦
N (Fig. 7d) and also iden-tified by the measurement of CALIPSO lidar and MODIS (Fig. 6a–e).
a)
b)
Fig. 12. The cross-section distribution of wind field, theta-e
(con-tour) and PM10concentration (colored) along EW1 in Fig. 9 at(a)
14:00 UTC, 20 March(b)20:00 UTC, 20 March. A full (half) wind barb indicates 5 m s−1(2.5 m s−1).
As the continental high pressure moved to the ocean (Fig. 4c–d), the easterly flow associated with the high pres-sure system prevailed east of the CMR after 06:00 UTC, 21 March (Fig. 7c–d). At this stage, the wind direction changed to easterly while still prevailing northeasterly over the Tai-wan Strait. This easterly flow plays a role in cutting off the southward transport of dust air masses east of the CMR. Due to the CMR blocking effect, the wind field over the Taiwan Strait is not easily affected by this easterly flow. Therefore, the CMR does not only block the easterly flow from the Pa-cific Ocean, but also enhances the speed of the northerly flow over the Taiwan Strait due to the channel effect. Our simula-tion compares reasonably well with the reported observasimula-tion (Figs. 2 and 3) for the dust in-homogenous spatial distribu-tion and peak concentradistribu-tion. The simulated dust transport also indicated that the dust transport was primarily north of 24◦
N over eastern Taiwan while significant masses of dust could be transported over the Taiwan Strait and as far south as Hong Kong.
Figure 8 shows the time series comparison between ob-servation and simulation PM10 concentration around Tai-wan at stations, SL, CH, MG, HL and HC (Fig. 8a–b) from 21:00 LST, 20 March to 07:00 LST, 22 March 2011. In the northern Taiwan, the peak concentration simulated quite well while it was about 2-h late for the peak occurrence at station SL. At station HC, the variation of simulation dust concen-tration underestimated over western Taiwan. This is probably due to our model resolution. However, our model captured the characteristics of the dust transport at station HL, HC and MG even though observation data missing for station MG af-ter 19:00 LST, 21 March 2010.
4.2 NE-SW cross section
In order to indentify the mechanisms of the dust transport to Taiwan and its surroundings, two NE-SW cross-sections and E-W cross-sections as shown in Fig. 9 have been examined. Figure 10a–d shows a NE-SW cross-section over the Taiwan Strait (line NE1 in Fig. 9). The strong northerly flow car-ried a significant dust concentration mainly below 850 hPa (Fig. 10a–d). The vertical structure of theta-e contours indi-cates that the unstable layer is shallow and just below 950 hPa after 00:00 UTC, 21 March (Fig. 10b–d). This is due to the continental cold and dry air mass over the warm ocean. The depth of the dust concentration was roughly along the 330 K theta-e line as the air masses were transported ward. As the dust air masses were being transported south-ward, their depth became thinner (Fig. 10b–d). For example, at 06:00 UTC, 21 March along cross section NE1, as dust was transported south from 22◦
N (Fig. 10c, around 200 km mark), the depth was only about 500 m (below 950 hPa). Above this elevation, the wind field was replaced by a strong southerly flow (Fig. 10c–d). The most southerly dust trans-port was around the 100 km mark (21.8◦N); it was nearly stationary (Fig. 10c–d) due to the northerly flow being re-placed by the southerly after 06:00 UTC, 21 March.
Figure 11a–d shows another NE-SW cross section located east of Taiwan, i.e. line NE2 in Fig. 9. Along cross-section NE2, the speed of the southward-transported northerly flow was slower than that of the flow transported along cross-section NE1 at the same time (Figs. 10a–d and 11a–d). A strong upward motion could also easily be found along this cross section during the study period, resulting in the lead-ing edge of the continental outflow (northerly) interactlead-ing with the southerly flow (Fig. 11a–d). Interestingly, if we check the theta-e contour line of 330 K, it is nearly stationary around the 400–500 km mark along the cross section between 06:00 UTC and 12:00 UTC, 21 March 2010 (Fig. 11c–d). In other words, the farthest southward transport only reached about the middle of this cross section, i.e. around the 400– 500 km mark around 24◦
N. It is important to note that the transport mechanisms at the NE-SW cross sections are sig-nificantly different between the two sides of the CMR due to
282 C.-Y. Lin et al.: The impact of channel effect on Asian dust transport dynamics
a)
b)
c)
d)
Fig. 13. The cross-section distribution of wind field, theta-e (contour) and PM10concentration along EW2 in Fig. 9 at(a)18:00 UTC, 20
March(b)00:00 UTC, 21 March(c)06:00 UTC, 21 March(d)12:00 UTC, 21 March. A full (half) wind barb indicates 5 m s−1(2.5 m s−1).
the mountain channel effect that enhanced the northeasterly wind speed over the Taiwan Strait.
4.3 E-W cross-section
To understand the spatial discrepancy in transport mecha-nisms, two E-W cross-sections (EW1 and EW2) have been conducted. Figure 12a–b shows the E-W cross section at 27◦
N (EW1 in Fig. 9), which represents the upstream con-tinental outflow to Taiwan. The light dust concentration along with the strong northerly flow first appeared over the ocean at the 630 km mark in Fig. 12a at about 950 hPa at 14:00 UTC, 20 March 2010. Following the strong north-easterly flow, the dust concentration was nearly homogenous along this cross-section within 200 km (marked from 500– 700 km) away from the coast (Fig. 12b) and the depth was about 1500 m (850 hPa) at 20:00 UTC, 20 March.
Figure 13a–d is the E-W cross section at 24.5◦
N passing through central Taiwan (EW2 in Fig. 9). Before the dust air mass was transported to this cross section, the wind speed at both sides of the CMR was nearly the same in the boundary layer at 18:00 UTC, 20 March (Fig. 13a). At 00:00 UTC, 21 March, the dust air mass had been transported to this cross-section over the Taiwan Strait, while there wasn’t any dust east of the CMR (Fig. 13b). It should be noted that the dust
concentration is quite inhomogeneous at downstream over both sides of CMR along this cross section. Actually, de-duced from the northeasterly prevailing wind, the wind speed of the easterly wind component over the Taiwan Strait was stronger than that east of the CMR along EW2 at 00:00 UTC, 21 March. It is estimated that the wind speed over the Tai-wan Strait was about 2–4 m s−1greater than that east of the CMR during the northeasterly prevailing wind period, not only for the simulation (Fig. 7c), but also for the true obser-vation (Fig. 5). The dust transport west of the CMR was ear-lier and had higher concentration than that east of the CMR also clearly identified at this cross section (Fig. 13b–d). The dust concentration over the Taiwan Strait (western Taiwan) is about a factor of 2–3 of that east of the CMR at this cross-section (Fig. 13b–d).
The above discussion implies that the existence of the CMR played significant roles in dominating the local circu-lations and in the spatial distribution of the dust concentra-tion during this episode. The effects of the CMR include (a) the enhancement of the prevailing northeasterly flow over the Taiwan Strait due to the channel effect and, (b) block-ing of the easterly from the Pacific Ocean from enterblock-ing over the Taiwan Strait. That is why the spatial distribution of dust concentration showed significantly inhomogeneous over eastern and western Taiwan.
C.-Y. Lin et al.: The impact of channel effect on Asian dust transport dynamics 283
a)
b)
c)
d)
e)
Fig. 14. (a)Schematic illustration of cross-sections A and B.(b)
Temporal variation of N-S component of wind speed during 20–23 March 2010 for control run along cross A. The contour is shown in 3 m s−1interval.(c)Same as(b)but for along cross B.(d)Same as
(b)but for Case QT along cross A.(e)Same as(b)but for case QT along cross B.
5 Sensitivity study of topographic height
In order to further examine the role of the CMR, the altitude of the mountain has been artificially reduced to a quarter of its original height (Case QT). Figure 14a shows the north-south cross sections A (121◦
E, 25.5–27.5◦
N) and B (120◦ E,
23.5–25.5◦N) representing upstream and downwind, respec-tively, during northeasterly flow. Figure 14b–e show the time series of the simulation average wind speed at 10 m at cross sections A and B for the original (control) run and case QT.
As mentioned earlier, the southerly flow (positive value) prevailed before frontal passage at these two cross-sections before 12:00 UTC, 20 March for the control run and case QT (Fig. 14b–e). For the control run, after the frontal pas-sage on 12:00 UTC, 20 March, the northeasterly prevailed and the wind direction along cross-section A had changed to northerly (negative value) earlier than downwind over the Taiwan Strait (Cross-section B) (Fig. 14b–c). The in-tensity of the northerly flow at cross-section B was signifi-cantly greater than at cross-section A from 00:00 UTC, 21– 22 March due to the channel effect (Fig. 14b–c). At cross-section A, a southerly wind speed developed between 25.5– 26◦N at around 00:00 UTC, 22 March. This is because the circulation of the high pressure system had already moved to the ocean (center, around south Japan) and thus a southerly wind component occurred (Fig. 14b). However, at cross sec-tion B, the northerly flows still prevailed over the Taiwan Strait because the southeasterly flow (induced by the high pressure system over the ocean) had been blocked by the CMR (Fig. 14c).
For case QT, the northerly flow started to develop at the same time for the control run (Fig. 14a and c; Fig. 14b and d). However the intensity of the northerly flow was signifi-cantly weaker for case QT than for the control run at cross section B (Fig. 14c and e). Furthermore, the northerly wind was replaced by the southerly after 12:00 UTC, 22 March for case QT at both cross section A and B (Fig. 14d–e). The du-ration of the northerly flow prevailing over the Taiwan Strait (cross-section B) was maintained longer for the control run (Fig. 14c) than for case QT (Fig. 14e). This is because the CMR at its real topographic height in the control run could effectively obstruct the easterly flow (associated with the Pa-cific high) from entering over the Taiwan Strait. Thus, at the same cross section B, the northerly flow could prevail for a longer time for the control run than for case QT (Fig. 14c and e). Again, the sensitivity discussion in this section clearly indicates the important effects of topographic blocking and channeling on the prevailing northeasterly wind and its ef-fect on spatial distribution of LRT Asian dust in Taiwan.
6 Summary
A super heavy dust event was identified using data from Taiwan Environmental Protection Administration (TEPA) air quality monitoring stations. A dramatically elevated con-centration of PM10, along with a strong northeasterly was observed in Taiwan on 21 March 2010. At Shihlin station, the PM10 concentration was as high as 1724 µg m−3 and at most stations the hourly concentrations were higher than 1000 µg m−3; these levels were sustained for more than 10
284 C.-Y. Lin et al.: The impact of channel effect on Asian dust transport dynamics
h over northern Taiwan. We have found that spatial distri-butions of PM10 concentration and transport speed for this case were significantly different between eastern and west-ern Taiwan. The peak PM10 concentrations over Taiwan’s western plain and island stations in the Taiwan Strait mostly ranged from 1500 to 900 µg m−3, and even as far south as Hong Kong the concentration was higher than 700 µg m−3. However, over eastern Taiwan, peaks at stations Hualien (HL) and Taitung (TT) were only 598 and 185 µg m−3, re-spectively. Moreover, the peak concentration was only about 132 µg m−3at Hungchun (HC) station at the southern tip of Taiwan. In other words, the peak concentrations ranged from factors of two to five between western and eastern Taiwan, and the range was greater than a factor of ten between the northern tip and southern tip of Taiwan, only about 400 km apart. The CALIPSO retrieval data and MOIDS aerosol op-tical data are also indicating the uneven dust distribution around Taiwan.
Numerical results from the WRF/chem model suggest that the simulated of this super heavy dust storm transport agree well with the uneven spatial distribution of PM10 concentra-tion over Taiwan. The simulaconcentra-tion results also suggested that the geographical structure of the Central Mountain Range (CMR) in Taiwan plays an important role in the discrepan-cies found in spatial distributions of PM10 concentrations over western and eastern of Taiwan. The effects of the CMR include (a) the enhancement of the prevailing northeasterly flow over the Taiwan Strait due to the channel effect and, (b) blocking of the easterly from the Pacific Ocean from en-tering over the Taiwan Strait. Data analyses and simulation suggest these effects were the major reasons that the spa-tial distribution of PM10 concentrations of this super heavy dust episode over Taiwan was significantly inhomogeneous. These phenomena affected not only the air quality distribu-tion over Taiwan, but also the biogeochemistry cycle over the sea surrounding Taiwan and are worthy of further study.
Acknowledgements. This work was supported by Taiwan National Science Council through grants NSC 99-2111-M-001-007-MY3 and NSC 99-2621-M-001-001.
Edited by: B. N. Duncan
References
Boyle, J. S. and Chen, T.-J.: Synoptic aspects of the wintertime East Asian monsoon, in Monsoon Meteorology, edited by: Chang, C. P. and Krishnamurti, T. N., 125–160, Oxford Univ. Press, New York, 1987.
Chang, K. M.: Prediction of the strength of overnight easterly winds in Hong Kong in Winter, Hong Kong Observatory Technical Note No. 79, 1989.
Chen, G. T. J. and Lin, K. C.: A diagnostic case study of a winter low-level front over southern China, Mon. Weather Rev., 127, 1096–1107, 1999.
Chen, W.-N., Chang, S.-Y, Chou, C. C.-K, Chen, Y.-W., and Chen, J.-P.: Study of relationship between water-soluble Ca2+and li-dar depolarization ratio for spring aerosol in the bounli-dary layer, Atmos. Environ., 41, 1440–1455, 2007.
Chen, Y.-L. and Hui, N. B.-F.: Analysis of a shallow front during the Taiwan Area Mesoscale Experiment, Mon. Weather Rev., 118, 2649–2667, 1990.
Chien, F. C. and Kuo, Y. H.: Topographic Effects on a Winter-time Cold Front in Taiwan, Mon. Weather Rev, 134, 3297–3316, 2006.
Chin, M., Rood, R. B., Lin, S.-J., Muller, J.-F., and Thompson, A. M.: Atmospheric sulfur cycle simulated in the global model GOCART: Model description and global properties, J. Geophys. Res., 105, 25671–24687, 2000.
Chin, M., Ginoux, P., Kinne, S., Torres, O., Holben, B., Duncan, B. N., Martin, R. V., Logan, J. A., Higurashi, A., and Nakajima, T.: Tropospheric aerosol optical thickness from the GOCART model and comparisons with satellite and sunphotometer mea-surements, J. Atmos. Sci., 59, 461–483, 2002.
Chun, Y., Kim, J., CHoi, J. C., Boo, K. O., Oh, S. N., and Lee, M.: Characteristic number size distribution of aerosol during Asian dust period in Korea, Atmos. Environ., 35, 2715–2721, 2001. Draxler, R. R. and Hess, G. D.: An overview of the Hysplit-4
mod-eling system for trajectories, dispersion, deposition, Aust. Mete-orol. Mag., 47, 295–308, 1998.
Eguchi, K., Uno, I., Yumimoto, K., Takemura, T., Shimizu, A., Sug-imoto, N., and Liu, Z.: Trans-pacific dust transport: integrated analysis of NASA/CALIPSO and a global aerosol transport model, Atmos. Chem. Phys., 9, 3137–3145, doi:10.5194/acp-9-3137-2009, 2009.
Fang, M., Zheng, M., Wang, F., Chim, K. S., and Kot, S. C.: The long range transport of aerosols from northern china to Hong Kong – a multi-technique study, Atmos. Environ., 33, 1803– 1817, 1999.
Gao, T., Su, L., Ma, Q., Li, H., Li, X., and Yu, X.: Climatic analyses on increasing dust storm frequency in the springs of 2000 and 2001 in Inner Mongolia, Int. J. Climatol., 23, 1743–1755, 2003. Grell, G. A., Steven, E. P., and Rainer, S.: Fully coupled
“on-line”chemistry within the WRF model, Atmos. Environ., 39, 6957–6975, 2005.
Hong, S.-Y. and Dudhia, J.: Testing of a new non-local bound-ary layer vertical diffusion scheme in numerical weather predic-tion applicapredic-tions, 16th Conference on NumericalWeather Predic-tion,Seattle, WA, 2003.
Hunt, C. R. and Snyder, W. H.: Experiments on stably and neu-trally stratified flow over a model three-dimensional hill, J. Fluid Mech., 96, 671–704, 1980.
In, H. J. and Park, S. U.: The soil particle size dependent emission parameterization for an Asian dust (Yellow Sand) observed in Korea in April 2002, Atmos. Environ., 37, 4625–4636, 2003. Kanayama, S. ,Yabuki ,S., Yanagisawa, F., and Motoyama, R.:
The chemical and strontium isotope composition of atmospheric aerosols over Japan: the contribution of long-range-transported Asian dust (Kosa), Atmos. Environ., 36, 5159–5175, 2002. Kim, S.-W., Yoon, S.-C., Jefferson, A., Ogren, J. A., Dutton, E.
G., Won, J.-G., Ghim, Y. S., Lee, B.-I., and Han, J.-S.: Aerosol optical, chemical and physical properties at Gosan, Korea during Asian dust and pollution episodes in 2001, Atmos. Environ., 39, 39–50, 2005.
Lee, K. L. and Zhang, M.: A numerical study on the orographic ef-fect on the cold surge in Southern China.Proceedings of the Sec-ond International Conference on East Asia and Western Pacific Meteorology and Climate, 7–10 Hong Kong, September 1992. Lee, Y. C. and Hills, P. R.: Cool season pollution episodes in Hong
Kong, 1996–2002, Atmos. Environ., 37, 2927–2939, 2003. Lin, C.-Y. and Chen, C.-S., : A study of orographic effects on
mountain-generated precipitation systems under weak synoptic forcing, Meteorol. Atmos. Phys., 81, 1–25, 2002.
Lin, C.-Y., Liu, S. C., Chou, C. C.-K, Liu, T. H., Lee, C.-T., Yuan, C.-S., Shiu, C.-J., and Young, C.-Y.: Long-Range Transport of Asian Dust and Air Pollutants to Taiwan, Terr. Atmos. Oceanic Sci., 15, 759–784, 2004.
Lin, C.-Y., Liu, S. C., Chou, C. C.-K, Huang, S.-J., Liu, C.-M., Kuo, C.-H., and Young, C.-Y.: Long-range transport of aerosols and their impact on the air quality of Taiwan, Atmos. Environ., 39, 6066–6067, 2005.
Lin, C.-Y., Wang, Z., Chen, W.-N., Chang, S.-Y., Chou, C. C. K., Sugimoto, N., and Zhao, X.: Long-range transport of Asian dust and air pollutants to Taiwan: observed evidence and model simu-lation, Atmos. Chem. Phys., 7, 423–434, doi:10.5194/acp-7-423-2007, 2007a.
Lin, C.-Y., Wang, Z., Chou, C. C.-K., Chang, C.-C., and Liu, S. C.: A numerical study of an autumn high ozone episode over southwestern Taiwan, Atmos. Environ., 41, 3684–3701, doi:10.1016/j.atmosenv.2006.12.050, 2007b.
Lin, C.-Y., Hsu, H.-M., Sheng, F., Kuo, C.-H., and Liou, Y.-A.: Mesoscale processes for super heavy rainfall of Typhoon Morakot (2009) over Southern Taiwan, Atmos. Chem. Phys., 11, 345–361, doi:10.5194/acp-11-345-2011, 2011.
Liu, Z., Liu, D., Huang, J., Vaughan, M., Uno, I., Sugimoto, N., Kit-taka, C., Trepte, C., Wang, Z., Hostetler, C., and Winker, D.: Air-borne dust distributions over the Tibetan Plateau and surround-ing areas derived from the first year of CALIPSO lidar obser-vations, Atmos. Chem. Phys., 8, 5045–5060, doi:10.5194/acp-8-5045-2008, 2008.
Murayama, T., Okamoto, H., Kaneyasu, N., Kamataki, H., and Miura, K.: Application of lidar depolarization measurement in the atmospheric boundary layer: Effects of dust and sea-salt par-ticles, J. Geophys. Res., 104, 31781–31792, 1999.
Omar, A. H., Winker, D. M., Vaughan, M. A., Hu Y., Trepte, C. R., Ferrare, R. A., Lee, K. P., Hostetler, C. A., Kittaka, C., Rogers, R. R., Kuehn, R. E., and Liu, Z.: The CALIPSO automated Aerosol classification and Lidar ratio selection algorithm, J. At-mos. Ocean. Tech., 26, 1994–2014, 2009.
Sugimoto, N., Hara, Y., Shimizu, A., Yumimoto, K., Uno, I., and Nishikawa, M.: Comparison of Surface Observations and a Re-gional Dust Transport Model Assimilated with Lidar Network Data in Asian Dust Event of March 29 to April 2, 2007, SOLA, 7A (Special Edition), 13–16, 2011.
Sun, J., Zhang, M., and Liu, T.: Spatial and temporal characteris-tics of dust storms in China and its surrounding regions, 1960– 1999: Relations to source area and climate, J. Geophys. Res., 106, 10325–10333, 2001.
Trier, S. B., Parsons, D. B., and Matejka, T. J.: Observations of a subtropical cold front in a region of complex terrain, Mon. Weather Rev., 118, 2449–2470, 1990.
Uematsu, M., Yoshikawa, A., Muraki, H., Arao, K., and Uno, I.: Transport of mineral and anthropogenic aerosols during a Kosa event over East Asia, J. Geophys. Res., 107, 4059, doi:10.1029/2001JD000333, 2002.
Uno, I., Amano, H., Emori, S., Kinoshita, K., Matsui, I., and Sugi-moto, N.: Trans-Pacific yellow sand transport observed in April 1998: A numerical simulation, J. Geophys. Res., 106, 18331– 18344, 2001.
Uno, I., Yumimoto, K., Shimizu, A., Hara, Y., Sugimoto, N., Wang, Z., Liu, Z., and Winker, D. M.: 3-D Struc-ture of Asian Dust Transport revealed by CALIPSO Lidar and a 4DVAR Dust Model, Geophys. Res. Lett., 35, L06803, doi:10.1029/2007GL032329, 2008.
Uno, I., Eguchi, K., Yumimoto, K., Takemura, T., Shimizu, A., Ue-matsu, M., Liu, Z., Wang, Z., Hara, Y., and Sugimoto, N.: Asian dust transported one full circuit around the globe, Nature Geosci., 2, 557–560, 2009.
Wai, K. M. and Tanner, P. A.: Relationship between ionic composi-tion in PM10and the synoptic-scale and mesoscale weather
con-ditions in a south China coastal city:A 4-year study, J. Geophys. Res., 110, D18210, doi:10.1029/2004JD005385, 2005.
Winker, D. M., Hunt, W. H., and McGill, M. J.: Initial perfor-mance assessment of CALIOP, Geophys. Res. Lett., 34, L19803, doi:10.1029/2007GL030135, 2007.
Yeh, H. C. and Chen, Y. L.: Characteristics of rainfall distribu-tions over Taiwan during the Taiwan area mesoscale experiment (TAMEX), J. Appl. Meteor., 37, 1457–1469, 1998.