DOI: 10.17015/ejbe.2015.016.08
Effects of Brand on Consumer Preferences:
A study in Turkmenistan
Abdurrahman ISIK
*, Mehmet Fatih YASAR
**Abstract
Using a measurement model of brand name and consumer preferences, this study aims to investigate the effects of brand name on consumer preferences in Turkmenistan. This study sought to investigate specifically, the influence of brand
a e o co su e ’s p eferences by utilizing structural equation modeling (SEM) technique. Moreover, all possible correlations between these dimensions or domains of brand name and consumer preferences are also empirically tested. In the context of the study, the introduced model was tested by a questionnaire instrument with 10 items excluding the demographic variables. A total of 422 completed copies of questionnaires were evaluated for analysis. The results suggest that, brand name variable have statistically significant relationships with consumer preferences variable. The findings of the study indicated positive correlations among the two variables with high factor loadings. Brand name of a product has significant impact on the overall preferences of the consumers.
Keywords: Brand, Consumer Preferences, Turkmenistan JEL Code Classification: M20, M31
UDC:339.13(575.4)
*
Nigerian Turkish Nile University, Nigeria. E-mail: a.isik@ntnu.edu.ng
**
1. Introduction
In a world where every product is bigger or better compared to its competitors, consumers have begun to face an important problem: the increased uncertainty about various products attributes. This arises from various asymmetric information consumers have access to, regarding a specific product. Consumers tend to asses certain product attributes in a holistically manner rather than a case by case basis (Ainslie & Rossi, 1998). Therefore both extrinsic and intrinsic factors must be accounted when trying to differentiate a product from its competitors. In these circumstances, brands can potentially play many different roles in the consumer decision process. (Romani et al. 2012) shows that consumers' psychological, sociological and economic processes are simultaneously involved in choice behavior. In these days, a product or a service is almost irrelevant without the brand. It cannot be identified or associated with what influences in fact our purchasing process (Mindrut et al. 2015). The study of consumer's behavior and the attempt to model the decision-making process of consumers is a longstanding interest for marketing and decision theory scientists (Matsatsinis & Samaras, 2000). Consumer–brand relationships (CBR) are important for the profitability of companies and enhancing the understanding of CBR is of great interest to researchers.
A o ga isatio ’s a d i age a e as i po ta t as the goods o se i es it produces. A strong brand image is a powerful asset. A recognised and trusted brand identity makes people confident that the organisation is dependable. Developing a corporate brand is important because a positive brand image will give consumers, and other interested stakeholders, confidence about the full range of products and activities associated with a particular company. Therefore, it was aimed in this study to investigate the relative influence of the brand image on consumer preferences and the formation of strong consumer preferences-brand relationships in Turkmenistan.
2. Literature Review
2.1. Brand
Consumer perception towards brand is an important aspect of marketing mix (Gabor & Contiu, 2012). Jin and Weber (2013) proposed that, brands served primarily as a way for customers to identify and recognize goods and their manufacturer. The focus of brand value creation was on individual goods whereby firms used brands to show ownership and take responsibility for their goods. This in turn helped customers ide tif a d e og ize a fi ’s goods o sight. From the 1930s onwards, brands were viewed as images that firms create to enable customers to both differentiate a brand from its competitors and identify the needs a brand promises to satisfy (Jin & Weber, 2013).
Another aspect of brand is that, it is strongly believed by academics and practitioners that brand reputation is becoming increasingly important. Brands should have a positive reputation to be successful and therefore profitable, (Veloutsou & Moutinho, 2009). On the other hand, Schmitt (2012) describes a comprehensive model of five brand-related processes: identifying, experiencing, integrating, signaling and connecting with the brand.
The personal experience of using a brand can be of assorted shapes from the personal experience of using an indistinguishable product without the brand (Sheena & Naresh, 2012). Brands can form relations with other brands. Brands can be anthropomorphized, and many of them are appreciated as cultural symbols. Finally, consumers can organize communities around brands. Consumers know and experience these characteristics about brands and respond to them. The model presented here accounts for these essential characteristics of brands (Schmitt, 2012).
2.2. Consumer Preferences
A broad variety of efforts and theories that attempt to describe the factors which influence the consumers and their behaviours when making purchasing decisions. The goal of the investigation of consumer behavior is to discover patterns of consumers' attitudes in their decision to buy or to ignore a product. (Matsatsinis, Samaras, 2000). Co su e s’ p efe e es fo p oducts or brands arise from the combination of many different factors. Some factors come from features of the product itself (e.g., price, durability), while others are attributes of consumers themselves (e.g., goals, attitudes, discretionary income), (Venkatraman, Clithero, Fitzsimons, and Huettel, 2012).
Ge, Brigden and Häu l p oposed that o su e s ofte ake hoi es i
set of previously discovered alternatives and searching to discover additional alternatives before making a choice. A substantial body of prior work examines consumer choice from pre-determined sets of alternatives. As a result, we know much about the influence of choice set composition and decision context on choice (Ge, Brigden, and Häubl, 2015). Aditionally, consumer characteristics such as patriotism, protectionism and social economic conservatism are effecting their choices (Spillan & Harcar, 2010).
2.3. Brand and Consumer Preferences
Often, consumers will tend to choose a brand that they consider congruent with their self-image. In this particular way each consumer at an individual basis will try to reflect his or her own identity through choice. When part of a larger social group, consumer choices tend to converge to a certain pattern thus forming the
asi s of a i di idual so ial ide tit Cătăli , A d eea, .
Brand preference is regarded as a key step in consumer decision making, involving elements of choice. In establishing brand preference, consumers compare and rank
different brands by fo usi g o thei u i ue ess defi ed a d p efe e e as the
extent to which the customer favors the designed service provided by his or her present company, in comparison to the designated service provided by other companies in his or he o side atio set, ith a o side atio set efe i g to brands that a consumer would consider buying in the near future (Jin & Weber, 2013). Also, usto e ’s ad iso has a positi e effe t o esta lishi g a positi e
effect on brand and consumer p efe e es Gü gö & Bilgi , .
2.4. Theorethical Framework
The theory of consumer choice was used as the theoretical frameworks for this study. Main assumption of this theory is that, consumer fully understands their own preferences, allowing for a simple but accurate comparison between any two bundles of good presented. All consumers seek to maximize utility. In the mainstream economics tradition, this activity of maximizing utility has been deemed as the "rational" behavior of decision makers (Varian, 2006). Consumer theory is therefore based around the problem of generate refutable hypotheses about the nature of consumer demand from this behavioral postulate. The crux of the matter is that the role of brand concept and consumer preferences cannot be over-emphasized in Turkmenistan.
2.5. Study Hypothesis
The essential predictions associated with this brand and consumer preferences effect of research captured by the following research hypothesis which was formulated to be tested based on the theoretical framework of the study and the findings of the literature review;
2.6. Theoretical Model
This study has two latent variables, one exogenous variable, one endogenous variable. The conceptual model of this study is presented in Figure 1.
Figure 1: Hypothesized Model
3. Methodology
3.1. Study Design and Sample
The research was conducted in Turkmenistan. Approximately 600 hardcopies of questionnaires were delivered in person by the designated research assistants randomly using a simple random sampling method. The participants were provided two options for returning the copies of questionnaires: return their questionnaires to the designated research assistants in person, or to use the stamped envelope provided on which the return address was written. A total of 527 survey forms were collected and 105 survey forms were excluded from the analysis due to missing data. Thus, exactly 422 (80%) complete forms were evaluated for further analysis. All data was collected in 2014.
3.2. The survey instrument
The survey instrument consisted of questions derived from the literature. There were 5 questions in brand section, and 5 questions in the consumer preference section. Also, the survey instrument consisted of a demographic information section.
a) Demographic Information: Information about the demographic characteristics of the participants was collected covering their, age, gender, marital status, income, education level and occupation.
b) Brand Scale: The indicators of brand section were developed by Isik (2013). To be used in numerous studies have confirmed its validity and reliability as a measure of Brand. The Brand variable was measured using 5 questions (see Appendix A). A five-point Likert scale was used for each of the 5 questions, scored from 1 to 5 where the number (1) means Strongly Disagree, (2) Disagree, (3) Neutral, (4) Agree, and (5) Strongly Agree. The five-point Likert scale was again used for all these
uestio s. The C o a h’s alpha s o e fo brand was 0.77. Skewness and Kurtosis
scores are between -1 and +1 which indicate that the distribution is normal.
c) Consumer Preference Scale: Consumer preferences section indicators were developed by Isik (2013) and was measured using 5 questions (see Appendix A). A five-point Likert scale was used for each of the 5 questions, scored from 1 to 5 where the number (1) means Strongly Disagree, (2) Disagree, (3) Neutral, (4) Agree, (5) Strongly Agree. The five-point Likert scale was again used for all these
uestio s. The C o a h’s alpha s o e was 0.70. Skewness and Kurtosis scores are
between -1 and +1 which indicate that it has a normal distribution.
3.3. Analysis
The SPSS 18.0 software was used to assess the data. The Structural Equation Model (SEM), using AMOS 18.0 software program, was used to analyze the data. Structural Equation Model (SEM), a statistical process that evaluate how well the collected sample data fit to the theoretically driven developed model. Unlike other statistical analyses, using SEM in data analysis has the strength to extract measurement error from estimates of observed variables, which provides more accuracy in estimating the strength and degree of relationship (Byrne, 2001). Kula (2011) indicates the advantages of SEM that, it technique which allows the researcher to simultaneously estimate a measurement model, specifying relations between measured variables and underlying latent variables. SEM consists of measurement models of exogenous and endogenous variables, and control variables to investigate the structural relationship between them. The literature suggests that various goodness-of-fit indices can be used for Structural Equation Modeling (Byrne, 2010: Kline, 2011). The following indices are the most commonly used goodness-of-fit statisti s i the elated lite atu e: χ -p-χ /df, RM“EA-PCLOSE, TLI-CFI values and HOLTER Index value (Uryan, 2010: 70-73; Kula, 2011: 65-74). The significance level for acceptance was set as p<0.05.
4. Findings
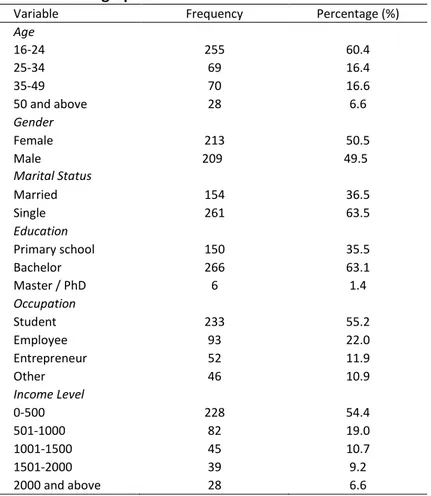
4.1. Demographic variables
1.4 % respectively. Those respondents with primary school degrees are 150 (35.5
%). I te s of espo de ts’ o upatio , of the total espo de ts . %
were students, 93 of the total respondents (22.0%) were employees, and 52 of the total respondents (11.9%) were entrepreneurs. Remaining 10.9 % of the respondents were others. Majority of the respondents in terms of income level, 228 (54.4) of the total 422 respondents were between 0 and 500. 82 respondents were in 501-1000, 45 respondents were in 1001-1500, 39 respondents were in 1501-2000. The percentage distributions of these three groups by income level were 19.0 %, 10.7 %, and 9.2 %, respectively. Finally, only 6.6% (28) of the total respondents have 2000 and above income level.
Table 1. Demographic variables
Variable Frequency Percentage (%)
Age
16-24 255 60.4
25-34 69 16.4
35-49 70 16.6
50 and above 28 6.6
Gender
Female 213 50.5
Male 209 49.5
Marital Status
Married 154 36.5
Single 261 63.5
Education
Primary school 150 35.5
Bachelor 266 63.1
Master / PhD 6 1.4
Occupation
Student 233 55.2
Employee 93 22.0
Entrepreneur 52 11.9
Other 46 10.9
Income Level
0-500 228 54.4
501-1000 82 19.0
1001-1500 45 10.7
1501-2000 39 9.2
2000 and above 28 6.6
n= 422
data well. The goodness of values of generic and revised models (Schumacker and Lomax, 2004, p.82; Schreiber et al., 2006) are demonstrated in the Table 2.
Table 2. Goodness of Fit Statistics of Generic and Revised Models
Index Criteria Generic Model Revised Model
Chi-s ua e χ Low 82.524 69.960
Chi-square associated p
value (p) . 0.000 0.003
Likelihood Ratio χ /df 1.919 1.706
Root Mean Square Error of Approximation (RMSEA)
. < alue . ; a epta le
. ; good 0.047 0.041
RMSEA associated p value
(PCLOSE) . 0.619 0.811
Tucker-Lewis Index (TLI) . alue < . acceptable;
. good 0.947 0.959
Comparative Fit Index (CFI)
. alue < . acceptable
. good 0.959 0.970
Hoelter's Critical N (Hoelter Index)
alue < acceptable
good 303 343
Brand and consumer preference are not exactly measured (latent) variables. Structural Equation Model was used to investigate the relationship between the two variables.
The goodness-of-fit statistics for both generic (hypothesized) and revised SEM models are presented in Table 2. All critical ratios in the revised model were statisti all sig ifi a t p . . The e ised odel p odu ed ette good ess-of-fit scores. The model improvement can be clearly observed in Table 2. The chi-square difference between the generic and revised model was 12.564, indicating that the chi-square value significantly decreased in the revised model. Significant improvements were also observed for the chi-square likelihood ratio and the RMSEA value. While the likelihood ratio went down from 1.919 to 1.706, an important change was observed in root mean square error of approximation (RMSEA) value which decreased from .047 to .041.
The only goodness-of-fit statistic not within acceptable limits was the chi-square p value (.000). It was found to be lower than the suggested level (.05). However, the probability value may be misleading because it is sensitive to sample size. When the sample size is large, the chi-square probability value tends to be significant even if there is a small difference between the covariance structure of the hypothesized model and the observed covariance matrix (Byrne, 2001). Additionally, it is se siti e to the size of o elatio s: igge o elatio s ge e all lead to higher values of chi-s ua e “ahin, 2010, p. 131).
decisions in SEM analyses. Therefore, it is recommended that along with the chi-square test, other goodness-of-fit tests such as the RMSEA and CFI also be used for a reliable assessment (Schumaker and Lomax, 2004).
A substantial improvement was achieved for the TLI, CFI and Hoelter Index scores of the revised model compared to generic model. While TLI scores increased from .94 to .96, which indicates perfect model fit, the CFI value rose to .96 from .97, indicating a perfectly model fit. Hoelter index value of 343 (compared to 303 in the generic model) in the revised model demonstrates that the revised model has adequate sample size at the determined threshold level.
Overall, results revealed that the revised Structural Equation Modelling model provided an adequate model fit, meaning that the Structural Equation Modelling fit the data well.
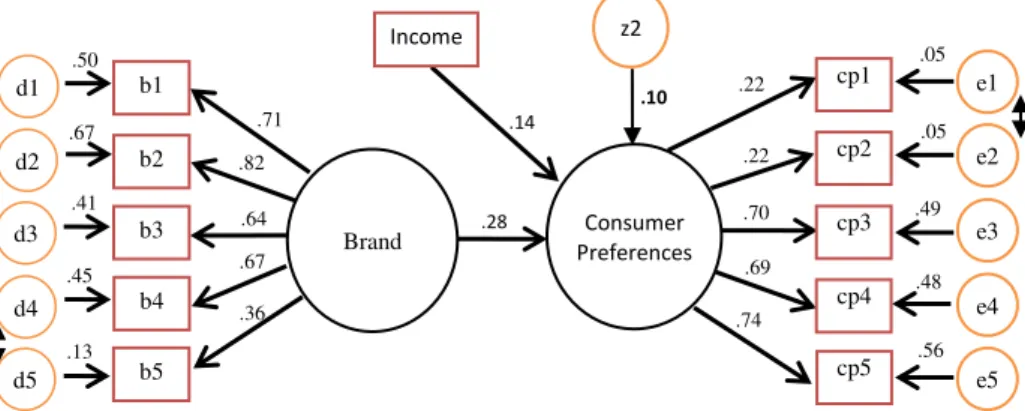
The revised structural equation model is presented in Figure 2.
Figure 2. The Relationship between the Brand and Consumer Preference
with Structural Equations Modelling
The revised structural equation model reveals that, the indicator has a significant relationship with latent variable (p<0.5). It was found that, brand variable positively correlated with consumer preference (p<0.5). Moreover, income level positively correlated with consumer preference (p<0.5). As a result, research hypotheses H1 was supported.
According to the abovementioned results, brand and consumer preference have been found significantly associated (P<0.001). In this context, the relationship weight of brand and consumer preference (standardized regression weight) was 0.28. Consequently, brand variable explain 10% of the change (variance) on consumer preference. As a result; the value (Z1) is % 90.
5. Discussion and Conclusion
The purpose of this study was to examine the relationship between brand and consumer preference with Structural Equation Model in Turkmenistan.
This study reveals several attractive findings that merit further discussions. The findings are also in line with previous findings in brand and consumer decision making studies (Matsatsinis & Samaras, 2000; Murthi & Rao, 2012; Venkatraman, et al., 2012; Diels, Wiebach, and Hildebrandt, 2013; Romani, Grappi, & Dalli, 2012).The results of this study provide support for the concept that brand variable effects o su e ’s p eferences. The SEM results of this study revealed that the hypothesis one (H1) has a statistically significant relationship with a positive regression coefficient of .28. This finding illustrates that, brand name of a product has more likely a strong impact on the decision making process of a consumer. This implies that brand creates consumer awareness and desirability that can facilitate consumer decision making and activate brand purchase. Peoples brand experiences
uilt o su e ’s p efe e es to a d e tai a ds directly or indirectly.
Overall, the results of this study indicated that brand image has positive and significant impact on consumer preferences. By drawing the attention of practitioners to the key factors underlying brand effects, the result of this study may also provide a bridge from theory to business practice and inspire managers to create functionally useful, meaningful and culturally relevant brands. This study provides a useful source of information for academic researchers and business practitioners who wish to conduct research and/or manage workers in Turkmenistan. Also, Managers should have lessons to learn from this study that, they should go beyond if they are to optimize people-centered business advantage in the marketplace by putting more emphasis on branding due to the perception that people are more tend to have products with reputable brand names.
This study recommends several points for future research. These recommendations are retrieved from the analyses of the results of this study. Brand and consumer preferences may not be fully explained with the dimensions used in this study. Consequently, deeply examining the dimensions of brand and consumer preferences would be an important contribution and a potential topic for future research. Finally, it is also recommended that more research on the relationships between brand and consumer preferences be conducted in Turkmenistan to understand consumer behaviors.
References
Ainslie, A., & Rossi, P. E. (1998). Similarities in Choice Behavior Across Product Categories.
Marketing Science, 17(2), 91-106.
Byrne, B. M. (2010). Structural Equation Modeling with AMOS: Basic concepts, applications, and programming. Ed. 2, Routledge: Taylor & Francis Group, New York, NY
Cătăli , M. C., & Andreea, P. (2014). Brands as a Mean of Consumer Self-expression and Desired Personal Lifestyle. Procedia - Social and Behavioral Sciences, 109, 103-107. http://dx.doi.org/10.1016/j.sbspro.2013.12.427
Diels, J. L., Wiebach, N., & Hildebrandt, L. (2013). The Impact of Promotions on Consumer Choices and Preferences in Out-of-Stock Situations. Journal of Retailing and Consumer Services,20(6), 587-598. http://dx.doi.org/10.1016/j.jretconser.2013.04.009
Ga o , M. R., & Co ţiu, L. C. . Is Dacia–Logan Car Brand on the First Place of Romanian Youth Preferences? Testing the Influence of Advertising Campaigns with Nonparametric Statistics. Procedia-Social and Behavioral Sciences,58, 1344-1352.
http://dx.doi.org/10.1016/j.sbspro.2012.09.1118
Ge, X., Brigden, N., & Häu l, G. . The Preference-Signaling Effect of Search. Journal of Consumer Psychology,25(2), 245-256. http://dx.doi.org/10.1016/j.jcps.2014.09.003
Gü gö , M. Ö. & Bilgi , F. ). . Custo e ’s Ad iso , O ga izatio al Ope ess a d
Capability: the Locus of Value Creation. Eurasian Journal of Business and Economics, 4 (7), 81-97.
Jin, X., & Weber, K. (2013). Developing and Testing a Model of Exhibition Brand Preference: The Exhibitors' Perspective. Tourism Management,38, 94-104.
http://dx.doi.org/10.1016/j.tourman.2013.02.018
Isik, A., (2013) Effect of Consumer Behavior in Turkmenistan, Interdisciplinary Trends in Science and Technology, 164-172.
Kline, R. B. (2011). Principles and Practice of Structural Equation Modeling, Ed. 3. New York, NY: The Guilford Press.
Kula, S. (2011), Occupational Stress and Work-Related Wellbeing of Turkish National Police (TNP) Members, University of Central Florida, Orlando (unpublished dissertation).
Matsatsinis, N. F., & Samaras, A. P. (2000). Brand Choice Model Selection Based on
Co su e s’ Multi ite ia P efe e es and E pe ts’ K o ledge. Computers & Operations Research,27(7-8), 689-707. http://dx.doi.org/10.1016/S0305-0548(99)00114-8
Mindrut, S., Manolica, A., & Roman, C. T. (2015). Building Brands Identity. Procedia Economics and Finance,20, 393-403. http://dx.doi.org/10.1016/S2212-5671(15)00088-X
Mu thi, B., & Rao, R. C. . P i e A a e ess a d Co su e s’ Use of Deals i B a d
Choice. Journal of Retailing,88(1), 34-46. http://dx.doi.org/10.1016/j.jretai.2011.07.001
Romani, S., Grappi, S., & Dalli, D. (2012). Emotions That Drive Consumers Away from Brands: Measuring Negative Emotions Toward Brands and Their Behavioral Effects. International Journal of Research in Marketing,29(1), 55-67.
http://dx.doi.org/10.1016/j.ijresmar.2011.07.001
Sheena, & Naresh, G. (2012). Do Brand Personalities Make a Difference to Consumers?
Procedia - Social and Behavioral Sciences,37, 31-37.
Sahin, I. (2010). Organizational Social Capital and Perceived Performance of Drug Law Enforcement Departments: A Case Study in Turkey. University of Central Florida, Orlando, FL (unpublished dissertation).
Schreiber, J. B., Stag F. K. E., King J., Nora A. and Barlow E. A. (2006). Reporting Structural Equation Modeling and Confirmatory Factor Analysis Results: A Review. The Journal of Educational Research, 99 (6), pp. 323-337. http://dx.doi.org/10.3200/JOER.99.6.323-338 Schumacker, R.E and Lomax, R.G. (2004). A Begi e ’s Guide to St uctu al E uatio
Modeling, Second Edition, Lawrence Erlbaum Associates, Publishers, Mahwah, New Jersey.
Spillan, J. E. & Harcar, T. (2013). A Comparative Study of Patriotism, Protectionism, Social Economic Conservatism between Indian and Vietnamese Consumers: The Effects of these Constructs on Buying Inclinations. Eurasian Journal of Business and Economics, 6 (12), 1-26.
Uryan, Y. (2010). Organizational Safety Culture and Individual Safety Behavior: A Case Study of the Turkish National Police Aviation Department, University of Central Florida, Orlando (unpublished dissertation).
Varian, H. R. (2006). Revealed Preference. Samuelsonian Economics and the Twenty-First Century, 99-115. http://dx.doi.org/10.1093/acprof:oso/9780199298839.003.0007
Veloutsou, C., & Moutinho, L. (2009). Brand Relationships Through Brand Reputation and Brand Tribalism. Journal of Business Research,62(3), 314-322.
http://dx.doi.org/10.1016/j.jbusres.2008.05.010
Venkatraman, V., Clithero, J. A., Fitzsimons, G. J., & Huettel, S. A. (2012). New Scanner Data for Brand Marketers: How Neuroscience Can Help Better Understand Differences in Brand Preferences. Journal of Consumer Psychology,22(1), 143-153.