Developing Coeliac Disease on Intestinal Microbiota of
Infants: The PROFICEL Study
Giada De Palma1, Amalia Capilla2, Esther Nova3, Gemma Castillejo4, Vicente Varea5, Tamara Pozo3, Jose´ Antonio Garrote6, Isabel Polanco7, Ana Lo´pez8, Carmen Ribes-Koninckx8, Ascensio´n Marcos3, Marı´a Dolores Garcı´a-Novo9, Carmen Calvo6, Luis Ortigosa10, Luis Pen˜a-Quintana11, Francesc Palau2, Yolanda Sanz1*
1Instituto de Agroquı´mica y Tecnologı´a de Alimentos, Consejo Superior de Investigaciones Cientı´ficas (IATA-CSIC), Valencia, Spain,2Instituto de Biomedicina de Valencia (CSIC), CIBER de Enfermedades Raras (CIBERER), Valencia, Spain,3Department Metabolismo y Nutricio´n, ICTAN-CSIC, Madrid, Spain,4Unidad de Gastroenterologı´a Pedia´trica, Hospital Universitario Sant Joan de Reus, Tarragona, Spain,5Gastroenterologı´a, Nutricio´n y Hepatologı´a Pedia´trica, Hospital Universitario Sant Joan de Deu and Unidad de Gastroenterologı´a Pedia´trica del Institut Dexeus, Barcelona, Spain,6Unidad de Gastroenterologı´a Pedia´trica, Hospital Clı´nico Universitario de Valladolid, Valladolid, Spain,7Servicio de Gastroenterologı´a y Nutricio´n Pedia´trica, Hospital Universitario La Paz, Madrid, Spain,8Unidad de Gastroenterologı´a Pedia´trica, Hospital Universitario La Fe, Valencia, Spain,9Unidad de Gastroenterologı´a, Hospital Universitario Infantil Nin˜o Jesu´s, Madrid, Spain,10Unidad de Gastroenterologı´a, Hepatologı´a y Nutricio´n Pedia´trica, Hospital Universitario Nuestra Sen˜ora de Candelaria, Santa Cruz de Tenerife, Canarias, Spain,11Unidad de Gastroenterologı´a, Hepatologı´a y Nutricio´n Pedia´trica, Hospital Universitario Materno-Infantil de Canarias, Universidad de Las Palmas de Gran Canaria, Las Palmas de Gran Canaria, Spain
Abstract
Interactions between environmental factors and predisposing genes could be involved in the development of coeliac disease (CD). This study has assessed whether milk-feeding type and HLA-genotype influence the intestinal microbiota composition of infants with a family history of CD. The study included 164 healthy newborns, with at least one first-degree relative with CD, classified according to their HLA-DQ genotype by PCR-SSP DQB1 and DQA1 typing. Faecal microbiota was analysed by quantitative PCR at 7 days, and at 1 and 4 months of age. Significant interactions between milk-feeding type and HLA-DQ genotype on bacterial numbers were not detected by applying a linear mixed-model analysis for repeated measures. In the whole population, breast-feeding promoted colonization ofC. leptumgroup,B. longumandB. breve, while formula-feeding promoted that ofBacteroides fragilisgroup, C. coccoides-E. rectalegroup, E. coliand B. lactis. Moreover, increased numbers ofB. fragilisgroup andStaphylococcusspp., and reduced numbers ofBifidobacteriumspp. andB. longum were detected in infants with increased genetic risk of developing CD. Analyses within subgroups of either breast-fed or formula-fed infants indicated that in both cases increased risk of CD was associated with lower numbers ofB. longumand/or Bifidobacterium spp. In addition, in breast-fed infants the increased genetic risk of developing CD was associated with increasedC. leptumgroup numbers, while in formula-fed infants it was associated with increasedStaphylococcusand B. fragilisgroup numbers. Overall, milk-feeding type in conjunction with HLA-DQ genotype play a role in establishing infants’ gut microbiota; moreover, breast-feeding reduced the genotype-related differences in microbiota composition, which could partly explain the protective role attributed to breast milk in this disorder.
Citation:De Palma G, Capilla A, Nova E, Castillejo G, Varea V, et al. (2012) Influence of Milk-Feeding Type and Genetic Risk of Developing Coeliac Disease on Intestinal Microbiota of Infants: The PROFICEL Study. PLoS ONE 7(2): e30791. doi:10.1371/journal.pone.0030791
Editor:Markus M. Heimesaat, Charite´ - Campus Benjamin Franklin, Germany
ReceivedNovember 23, 2011;AcceptedDecember 29, 2011;PublishedFebruary 3, 2012
Copyright:ß2012 De Palma et al. This is an open-access article distributed under the terms of the Creative Commons Attribution License, which permits unrestricted use, distribution, and reproduction in any medium, provided the original author and source are credited.
Funding:This study was supported by public grants AGL2007-66126-C03-01-03/ALI and Consolider Fun-C-Food CSD2007-00063 from the Spanish Ministry of Science and Innovation. GDP was recipient of I3P scholarship from Consejo Superior de Investigaciones Cientı´ficas (CSIC), Spain. The funders had no role in study design, data collection and analysis, decision to publish, or preparation of the manuscript.
Competing Interests:The authors have declared that no competing interests exist. * E-mail: [email protected]
Introduction
Celiac disease (CD) is a chronic inflammatory disorder of the small intestine that presents in genetically predisposed individuals following gluten consumption [1]. This disease often manifests in early childhood with small intestinal villous atrophy and signs of malabsorption [1]. Currently, a strict gluten-free diet is the only available treatment for patients but compliance with this dietary practice is extremely complex and, therefore, preventive strategies are being investigated [2].
The major genetic risk factor in CD is represented by Human Leukocyte Antigen (HLA)-DQ genes. Several studies have
documented that the HLA-DQA1*05 and DQB1*02 alleles, encoding for particular DQ2 molecules, confer high susceptibility to CD [3]. This heterodimer can be encoded both incisortrans
disease risk, including the type of milk-feeding, incidence of infections and intestinal dysbiosis [6–8].
Gut colonization starts immediately after birth and depends on multiple factors such as the type of delivery, contamination from the environment, the type of milk-feeding and, possibly, the genotype [9–11]. An adequate gut microbial colonization process contributes to the physiological development of the gut and the maturation of the immune system, thereby determining the risk of developing disease later in life. The early stage of colonization is characterized by the presence of higher levels of facultative anaerobes (enterobacteria, enterococci and streptococci) than of strictly anaerobic bacteria (e.g. bifidobacteria, bacteroides, clos-tridia, etc.); however, these proportions are reversed within a week following birth. In breast-fed infantsBifidobacterium spp. predom-inate, representing up to 90% of the total faecal microbiota, whereas in formula-fed infants the microbiota is more heteroge-neous [9,12,13]. Breast-milk has been shown to be a continuous source of commensal bacteria to the infant gut, including species of the generaLactobacillusandBifidobacterium[14,15]. It also contains prebiotic substances which are considered the main factors that stimulate the growth ofBifidobacterium spp. [16]. Epidemiological studies suggest that breast-feeding confers a protective effect against the risk of CD development, particularly when gluten is introduced in the diet while the infant is still breast-fed [1,17]. However, the mechanisms underlying the beneficial effects of breast-milk on CD risk and their relationship with the gut microbiota are unknown. A preliminary study was previously conducted to test whether the HLA-DQ genotype could influence the composition of the gut microbiota, although the population under study was composed by a small number of exclusively breast-fed infants [18] and the aim was to establish the basis for this long-term study, including a representative cohort of infants. The objective of this study was to assess the gut microbial colonization process during the first 4 months of life in breast-fed and formula-fed babies at risk of developing CD, by using quantitative PCR (qPCR). The ultimate purpose of our research is to gain a better understanding of the effects of early events leading to the acquisition of intestinal microbiota and their interactions with predisposing genes on CD risk.
Methods
Subjects and study design
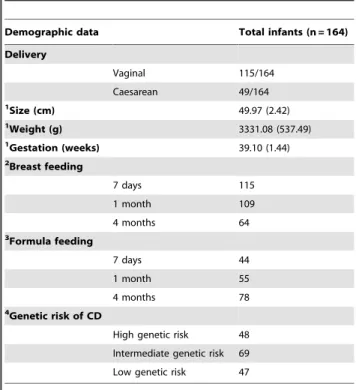
A prospective observational study was carried out with a cohort of 164 healthy full-term newborns recruited between June 2006 and November 2010, who had a first-degree relative affected by CD. Data of mode of delivery, size, weight, weeks of gestation and type of feeding were recorded at birth and over the study period (Table 1). Infants were grouped for factors that influence the gut microbial colonization process, including age, genetic risk of CD development (HLA-DQ status), and type of milk-feeding (admitted randomly). The infants classified into the breast-fed group were those that received exclusively breast-feeding during the first 7 days of life, during the first month of life or during the first 4 months of life. Infants classified into the formula-fed group were those that received either exclusively formula or both formula and breast-milk at each sampling time. Infants were also grouped according the duration of feeding (never fed, breast-fed less than 1 month, breast-breast-fed more than 1 month but less than 4 months and breast-fed for the 4 months). The study was approved by the ethics committees of Consejo Superior de Investigaciones Cientı´ficas (CSIC) and the Hospitals involved in the study, including Hospital Universitario Sant Joan de Reus, Hospital Universitario Sant Joan de Deu, Institut Dexeus, Hospital
Clı´nico Universitario de Valladolid, Hospital Universitario La Paz, Hospital Infantil Universitario La Fe, Hospital Universitario Infantil Nin˜o Jesu´s, Hospital Universitario Ntra Sen˜ora de Candelaria and Hospital Universitario Materno-Infantil de Canarias and conducted in accordance with the Helsinki Declaration of 1975 as revised in 1983. Written informed consent was obtained from the parents of infants included in the study.
HLA-DQ Genotyping
DNA was extracted from yugal mucosa cells by scraping the inner side of the infants’ cheek with sterile swabs (Copan innovation, Sarstedt, Germany) and purified according to the DNA IQTM Casework Sample Kit for MaxwellH 16 protocol (Promega Biotech Iberica, Spain). Low-resolution HLA-DQB1 typing was performed by PCR-SSP (Polymerase Chain Reaction-Sequence Specific Primers) analysis [19]. Each PCR reaction was performed on about 20 ng of extracted DNA, 0.5 U of DNA polymerase (BIOTOOLS B&M S.A, Spain), 16PCR Master Mix (Dynal AllSet+TM
SSP or Olerup SSPTM) containing nucleotides (200mmol L21each), PCR buffer, 5% glycerol and 100mg mL21 cresol red, 0?25mmol L21of each allele- or group-specific primer pair and 0?1mmol L21 of internal positive control primer pair matching a segment of the human growth hormone gene in a final volume of 10mL. An initial denaturation step at 94uC for 2 min was followed by 10 two-temperature cycles (94uC for 10 s and 65uC for 60 s) and 20 three-temperature cycles (94uC for 10 s, 61uC for 50 s and 72uC for 30 s). Detection of amplified alleles was carried out on 2% agarose gels after ethidium bromide staining. HLA-DQA1 alleles were genotyped in a stepwise fashion
Table 1.Demographic data of infants under study.
Demographic data Total infants (n = 164) Delivery
Vaginal 115/164
Caesarean 49/164
1Size (cm) 49.97 (2.42)
1Weight (g) 3331.08 (537.49)
1
Gestation (weeks) 39.10 (1.44)
2Breast feeding
7 days 115
1 month 109
4 months 64
3Formula feeding
7 days 44
1 month 55
4 months 78
4Genetic risk of CD
High genetic risk 48
Intermediate genetic risk 69
Low genetic risk 47
1Data are expressed as mean and standard deviation in brackets.
2Infants who were exclusively breast-fed at each sampling time were included in the breast-feeding group.
3Infants who received either exclusively formula or both formula and breast-milk were included in the formula-feeding group.
4Genetic risk of developing CD was established according to the HLA-DQ genotype (see Materials and Methods section for details).
for high resolution typing to hone the risk classification of each individual.
Faecal sampling and DNA extractions
Stool samples were collected from every subject at 7 days, 1 month and 4 months of age and frozen at220uC immediately. Samples (1 g) were diluted 1:10 (w/v) in PBS (pH 7.2) and homogenized by thorough agitation in a vortex. Aliquots were used for DNA extraction using the QIAamp DNA stool Mini kit (Qiagen, Hilden, Germany) following the manufacturer’s instruc-tions. DNA extractions from different pure cultures of reference strains were done following the same protocol.
Quantitative PCR (qPCR) analysis of faecal bacteria qPCR was used to quantify the different bacterial groups of the faecal microbiota using genus-, group- and species-specific primers as previously described [20,21]. Briefly, PCR amplification and detection were performed with an ABI PRISM 7000-PCR sequence detection system (Applied Biosystems, UK) using SYBRH Green PCR Master Mix (SuperArray Bioscience Corporation, USA). The bacterial concentration from each sample was calculated by comparing the Ct values obtained from standard curves of reference strains. Standard curves were created using serial 10-fold dilutions of pure culture DNA corresponding to 102 to 109 cells, as determined by microscopy counts after staining with 49, 6 diamino-2-phenylindole in an epifluorescence micro-scope (Olympus BX51, Tokio, Japan).
Statistical analyses
Data were analysed using the SPSS 19.0 software for Windows (SPSS Inc, Chicago, IL, USA). The demographic characteristics of the study subjects are given as mean values (standard deviations [SDs]) for continuous variables and as numbers and proportions for categorical variables. Differences in demographic characteristic measures between the study groups were assessed using the Chi-Square Pearson test for categorical variables and ANOVA andpost hocLSD test for continuous variables. Microbiological data were transformed from exponential numbers into logarithms to adjust to normal and, in the tables, are expressed as mean values of log cells/g faeces and standard deviations (SDs). A mixed model with repeated measures with three fixed factors [genetic risk, type of milk-feeding and age (repeated measure)] was applied to determine the effects of genetic risk and type of feeding on bacterial counts. Interactions (magnitudinal) between these three factors were also analysed and not detected. Interactions between faecal microbial counts and type of delivery were not found and, therefore, data from infants with different type of delivery were grouped for statistical analyses. Differences between bacterial numbers at each sampling time (age) were analysed by ANOVA and post hoc LSD test. Correlations between factors (bacterial counts, age and genetic risk) were determined by Pearson correlation coefficients and correlations between bacterial counts and type of milk-feeding were tested by applying the Chi-Square Pearson test. In all cases, p-values less than 0.050 were considered statistically significant.
Results
Subjects and genetic risk of CD
The demographic characteristics of the infants under study are shown in Table 1. All newborns were full-term and most were delivered naturally (115 of 164). The size and weight of the infants at the moment of delivery were within standard parameters.
Infants were classified into three main groups according to their HLA-DQ genotype, and probabilities of developing CD were estimated according to previous studies [22,23]. The first group included those individuals carrying the DQ2 haplotype in bothcis
(DQA1*0501-DQB1*0201 in homozygosis) and trans conforma-tions (DQA1*0201-DQB1*0202 with DQA1*0505-DQB1*0301 in heterozygosis). The second group included those subjects carrying the DQ2 haplotype incisconformation along with any other haplotype, as well as subjects carrying the DQ8 haplotype (DQA1*0301-DQB1*0302) in homozygosis. The third group included those individuals with other common genotypes not associated with CD. Of the 164 infants under study, 28.40% were classified in the first risk group, with the highest probability (.20%) of developing CD (the high genetic risk group) and 42.59% in the second group, with a .7% probability of developing CD (the intermediate genetic risk group). The remaining 29.01% of infants comprised the third group, with the lowest probability (,1%) of developing CD (the low genetic risk group).
Influence of milk-feeding type on faecal microbiota of infants at risk of developing CD
The effect of milk-feeding type on the composition of the faecal microbiota, irrespectively of genotype, was evaluated over the study period. The type of milk feeding significantly influence different bacterial group counts by analysing data with the linear mixed model with time sampling as the repeated measure. C. leptum group (P= 0.005), B. longum (P= 0.050), and B. breve
(P= 0.008) numbers were significantly higher in breast-fed than in formula-fed infants, whereasBacteroides fragilisgroup (P= 0.004),
C. coccoides-E. rectale group (P,0.001), E. coli (P = 0.026), and B. lactis(P= 0.002) numbers were higher in formula-fed infants than in breast-fed infants.
Correlations between milk-feeding type and several bacterial group counts at each sampling time were also analysed. Increased numbers of C. leptumgroup and B. breve correlated with breast-feeding at 7 days of age (r =20.255, P= 0.012; r =20.197,
P= 0.036, respectively). Moreover, formula-feeding correlated with increased numbers ofE. coli,C. coccoides-E. rectale group and
B. lactis at 1 month of age (r = 0.218, P= 0.006; r = 0.217,
P= 0.011; r = 0.574, P = 0.002, respectively), and with increased numbers ofC. coccoides-E. rectale andBacteroides fragilis groups at 4 months of age (r = 0.280,P= 0.001; r = 0.267,P= 0.004, respec-tively).
When analysing the cumulative effect of breast-feeding on the microbiota composition of 4-month-old infants, statistically significant negative correlations were established between in-creasedBacteroides fragilisandC. coccoides-E. rectalegroup counts and longer breast-feeding duration (r =20.218,P= 0.020; r =20.245, P = 0.003, respectively).
Influence of HLA-DQ genotype on the fecal microbiota of infants at risk of developing CD
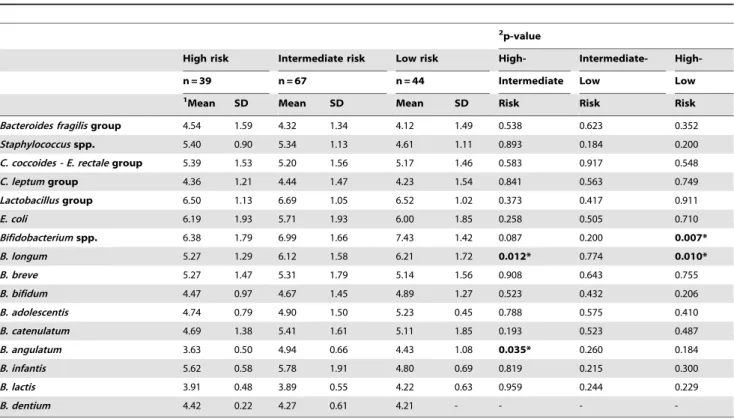
The influence of HLA-DQ genotype, irrespective of milk-feeding type, on fecal microbiota composition was established by applying a linear mixed-model analysis with sampling time as the repeated measure. According to this analysis, the effect of the genetic risk on bacterial numbers was significant forBifidobacterium
fecal microbiota composition at each sampling time (7 days, 1 and 4 months) is also shown in Tables 2, 3 and 4.
Correlations between genetic risk and several bacterial group counts at different infant ages (sampling time) were also established. Statistically significant correlations were found between increased numbers of both Bifidobacterium spp. (r = 0.235, P= 0.007 at 7 days; r = 0.268,P= 0.001 at 1 month; r = 0.257, P= 0.001 at 4 months) and B. longum (r = 0.209,
P= 0.013 at 7 days; r = 0.207,P= 0.011 at 1 month; r = 0.200,
P= 0.016 at 4 months) and reduced genetic risk during the whole sampling period. In contrast, increased numbers of Staphylococcus
spp. at 1 and 4 months (r =20.465, P= 0.001 at 1 month; r =20.278, P= 0.038 at 4 months) and B. lactis at 4 months (r =20.332,P= 0.026) correlated with increased genetic risk.
Influence of the HLA-DQ genotype in the faecal microbiota of either breast-fed or formula fed infants
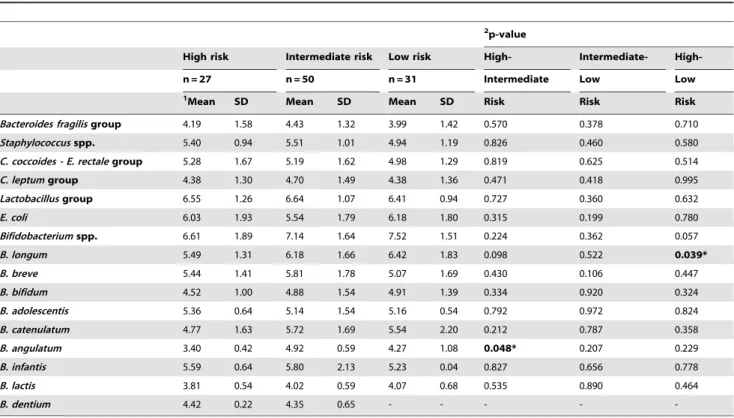
The microbiota composition of infants grouped according to milk-feeding type was also analysed as a function of HLA-DQ genotype over the study period to eliminate the effects of milk-feeding type. In breast-fed infants, the effect of genetic risk of CD was significant on bacterial counts of Bifidobacterium spp. (P= 0.046), which decreased when the genetic risk was increased, and on bacterial counts ofStaphylococcusspp. (P= 0.030),C. leptum
group (P= 0.047), B. adolescentis ((P= 0.028) and B. dentium
(P= 0.009), which increased when the genetic risk was also increased, according to linear mixed-model analysis with sampling time (age) as the repeated measure. The differences in mean bacterial numbers according to the genetic risk of developing CD in breast-fed infants analysed at each sampling point are also shown in Tables 5, 6 and 7.
Correlations between genetic risk and bacterial counts were also analysed and these were significant between increased genetic risk of CD development and increasedC. leptumgroup counts in breast-fed infants (r =20.408,P= 0.004).
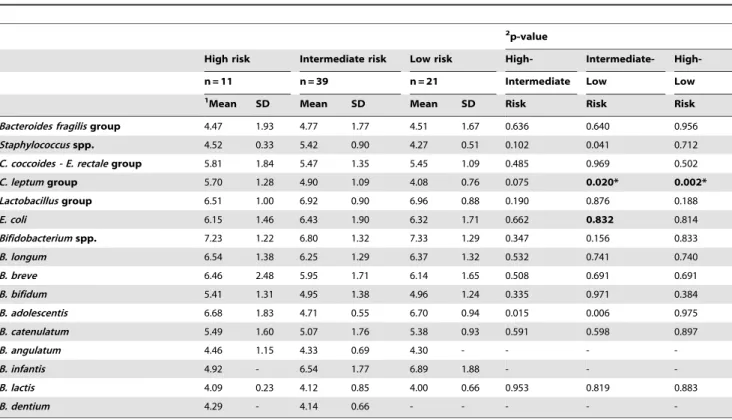
In formula-fed infants, the effect of genetic risk onBifidobacterium
spp. and B. longum counts was found significant (P,0.001 and
P,0.001, respectively) by applying a linear mixed model analysis with sampling time as the repeated measure, and those infants with reduced genetic risk had increased numbers of these bacterial groups. The effect of genetic risk on numbers ofB. fragilisgroup andStaphylococcusspp. was also significant, following the opposite trend (P= 0.008 and P= 0.004, respectively). The differences in mean bacterial numbers according to the genetic risk of developing CD in formula-fed infants analysed at each sampling point are also shown in Tables 8, 9 and 10.
Statistically significant correlations were also established between the genetic risk of CD development and bacterial group numbers in formula-fed infants at different sampling times. At 7 days, reduced numbers of Bifidobacterium spp. correlated with increased genetic risk of developing CD (r = 0.362,P= 0.028). At 1 month, reduced numbers ofBifidobacterium spp. andB. longum
correlated with increased genetic risk of developing CD (r = 0.511,P,0.001 and r = 0.454, P= 0.001, respectively), and increased numbers ofStaphylococcusspp. correlated with increased genetic risk of developing CD (r =20.573, P= 0.013). At 4 months, reduced numbers of Bifidobacterium spp. and B. longum
correlated with increased genetic risk of developing CD (r = 0.412,P,0.001 and r = 0.336, P= 0.002, respectively), and increased numbers of Staphylococcus spp. and B. lactis correlated with increased genetic risk (r =20.345, P= 0.040 and r =20.442,P= 0.010, respectively).
Table 2.Faecal microbiota of infants with different HLA-DQ genotype at 7 days of age analysed by qPCR.
2p-value
High risk Intermediate risk Low risk High- Intermediate-
High-n = 39 n = 67 n = 44 Intermediate Low Low
1Mean SD Mean SD Mean SD Risk Risk Risk
Bacteroides fragilisgroup 4.54 1.59 4.32 1.34 4.12 1.49 0.538 0.623 0.352 Staphylococcusspp. 5.40 0.90 5.34 1.13 4.61 1.11 0.893 0.184 0.200 C. coccoides - E. rectalegroup 5.39 1.53 5.20 1.56 5.17 1.46 0.583 0.917 0.548 C. leptumgroup 4.36 1.21 4.44 1.47 4.23 1.54 0.841 0.563 0.749 Lactobacillusgroup 6.50 1.13 6.69 1.05 6.52 1.02 0.373 0.417 0.911
E. coli 6.19 1.93 5.71 1.93 6.00 1.85 0.258 0.505 0.710
Bifidobacteriumspp. 6.38 1.79 6.99 1.66 7.43 1.42 0.087 0.200 0.007* B. longum 5.27 1.29 6.12 1.58 6.21 1.72 0.012* 0.774 0.010*
B. breve 5.27 1.47 5.31 1.79 5.14 1.56 0.908 0.643 0.755
B. bifidum 4.47 0.97 4.67 1.45 4.89 1.27 0.523 0.432 0.206
B. adolescentis 4.74 0.79 4.90 1.50 5.23 0.45 0.788 0.575 0.410
B. catenulatum 4.69 1.38 5.41 1.61 5.11 1.85 0.193 0.523 0.487
B. angulatum 3.63 0.50 4.94 0.66 4.43 1.08 0.035* 0.260 0.184 B. infantis 5.62 0.58 5.78 1.91 4.80 0.69 0.819 0.215 0.300
B. lactis 3.91 0.48 3.89 0.55 4.22 0.63 0.959 0.244 0.229
B. dentium 4.42 0.22 4.27 0.61 4.21 - - -
-1Data are expressed as mean and standard deviation of log cells/g faeces. 2Statistical significant differences were calculated using ANOVA and
Table 3.Faecal microbiota of infants with different HLA-DQ genotype at 1 month of age analysed by qPCR.
2p-value
High risk Intermediate risk Low risk High- Intermediate-
High-n = 48 n = 69 n = 47 Intermediate Low Low
1Mean SD Mean SD Mean SD Risk Risk Risk
Bacteroides fragilisgroup 5.00 1.93 4.48 1.64 4.60 1.36 0.176 0.760 0.363 Staphylococcusspp. 6.12 1.09 5.17 1.01 4.66 0.93 0.014* 0.149 0.001* C. coccoides - E. rectalegroup 5.75 1.20 5.55 1.70 5.53 1.36 0.517 0.950 0.512 C. leptumgroup 4.69 1.79 4.83 1.40 4.52 1.61 0.731 0.383 0.679 Lactobacillusgroup 6.72 1.08 6.93 1.04 6.79 0.97 0.291 0.475 0.746
E. coli 6.38 1.74 6.01 2.05 6.45 1.68 0.317 0.234 0.871
Bifidobacteriumspp. 6.47 1.47 7.19 1.26 7.49 1.45 0.010* 0.282 0.001* B. longum 5.55 1.67 6.11 1.58 6.44 1.63 0.001* 0.305 0.011*
B. breve 5.33 1.65 5.53 1.72 5.29 1.61 0.596 0.511 0.908
B. bifidum 4.98 1.38 4.78 1.53 4.77 1.29 0.503 0.958 0.510
B. adolescentis 5.48 1.14 4.71 0.68 5.44 1.37 0.140 0.122 0.936
B. catenulatum 4.90 1.59 5.31 1.74 4.69 1.34 0.344 0.139 0.663
B. angulatum 4.71 0.41 4.59 0.78 4.58 0.38 0.705 0.966 0.663
B. infantis 5.57 0.90 6.23 1.64 4.95 0.52 0.260 0.055 0.307
B. lactis 4.27 0.91 3.87 0.65 4.02 0.40 0.237 0.648 0.503
B. dentium 4.51 0.60 4.86 0.62 5.38 1.38 0.590 0.522 0.207
1Data are expressed as mean and standard deviation of log cells/g faeces. 2Statistical significant differences were calculated using ANOVA and
post hocLSD test. Significant differences were established at p,0.050. doi:10.1371/journal.pone.0030791.t003
Table 4.Faecal microbiota of infants with different HLA-DQ genotype at 4 months of age analysed by qPCR.
2p-value
High risk Intermediate risk Low risk High- Intermediate-
High-n = 42 n = 65 n = 47 Intermediate Low Low
1Mean SD Mean SD Mean SD Risk Risk Risk
Bacteroides fragilisgroup 5.52 2.09 4.88 1.86 4.91 1.60 0.137 0.932 0.188 Staphylococcusspp. 5.52 1.20 5.40 0.94 4.80 0.79 0.720 0.060 0.040* C. coccoides - E. rectalegroup 6.00 1.43 6.04 1.55 5.88 1.26 0.898 0.590 0.716 C. leptumgroup 4.89 1.65 5.02 1.25 4.83 1.07 0.653 0.501 0.851 Lactobacillusgroup 6.70 0.98 6.99 0.94 6.95 0.92 0.117 0.816 0.210
E. coli 6.48 1.62 6.61 1.94 6.60 1.60 0.726 0.977 0.767
Bifidobacteriumspp. 6.74 1.11 6.77 1.29 7.55 1.11 0.893 0.001* 0.002* B. longum 6.06 1.40 6.22 1.32 6.76 1.31 0.570 0.040 0.019*
B. breve 5.99 1.73 5.94 1.66 5.98 1.62 0.886 0.901 0.982
B. bifidum 5.10 0.94 5.01 1.39 5.04 1.33 0.746 0.926 0.824
B. adolescentis 5.83 1.03 4.99 0.74 6.06 1.42 0.056 0.035* 0.648 B. catenulatum 5.65 1.67 5.42 1.74 5.57 1.32 0.608 0.722 0.866
B. angulatum 4.79 1.00 4.70 0.71 4.23 0.88 0.806 0.190 0.115
B. infantis 6.03 1.38 6.24 1.33 6.56 1.73 0.750 0.612 0.334
B. lactis 4.98 0.88 4.30 0.81 4.25 0.69 0.026 0.865 0.019*
B. dentium 4.54 0.48 4.37 0.71 4.74 - - -
-1Data are expressed as mean and standard deviation of log cells/g faeces.
Table 5.Faecal microbiota of breast-fed infants with different HLA-DQ genotype at 7 days of age analysed by qPCR.
2p-value
High risk Intermediate risk Low risk High- Intermediate-
High-n = 27 n = 50 n = 31 Intermediate Low Low
1Mean SD Mean SD Mean SD Risk Risk Risk
Bacteroides fragilisgroup 4.19 1.58 4.43 1.32 3.99 1.42 0.570 0.378 0.710 Staphylococcusspp. 5.40 0.94 5.51 1.01 4.94 1.19 0.826 0.460 0.580 C. coccoides - E. rectalegroup 5.28 1.67 5.19 1.62 4.98 1.29 0.819 0.625 0.514 C. leptumgroup 4.38 1.30 4.70 1.49 4.38 1.36 0.471 0.418 0.995 Lactobacillusgroup 6.55 1.26 6.64 1.07 6.41 0.94 0.727 0.360 0.632
E. coli 6.03 1.93 5.54 1.79 6.18 1.80 0.315 0.199 0.780
Bifidobacteriumspp. 6.61 1.89 7.14 1.64 7.52 1.51 0.224 0.362 0.057 B. longum 5.49 1.31 6.18 1.66 6.42 1.83 0.098 0.522 0.039*
B. breve 5.44 1.41 5.81 1.78 5.07 1.69 0.430 0.106 0.447
B. bifidum 4.52 1.00 4.88 1.54 4.91 1.39 0.334 0.920 0.324
B. adolescentis 5.36 0.64 5.14 1.54 5.16 0.54 0.792 0.972 0.824
B. catenulatum 4.77 1.63 5.72 1.69 5.54 2.20 0.212 0.787 0.358
B. angulatum 3.40 0.42 4.92 0.59 4.27 1.08 0.048* 0.207 0.229 B. infantis 5.59 0.64 5.80 2.13 5.23 0.04 0.827 0.656 0.778
B. lactis 3.81 0.54 4.02 0.59 4.07 0.68 0.535 0.890 0.464
B. dentium 4.42 0.22 4.35 0.65 - - - -
-1Data are expressed as mean and standard deviation of log cells/g faeces. 2Statistical significant differences were calculated using ANOVA and
post hocLSD test. Significant differences were established at p,0.050. doi:10.1371/journal.pone.0030791.t005
Table 6.Faecal microbiota of breast-fed infants with different HLA-DQ genotype at 1 month of age analysed by qPCR.
2p-value
High risk Intermediate risk Low risk High- Intermediate-
High-n = 28 n = 53 n = 30 Intermediate Low Low
1Mean SD Mean SD Mean SD Risk Risk Risk
Bacteroides fragilisgroup 4.87 1.72 4.56 1.67 4.87 1.37 0.480 0.497 0.988 Staphylococcusspp. 5.59 0.82 5.16 0.97 4.64 1.03 0.430 0.223 0.121 C. coccoides - E. rectalegroup 5.57 1.41 5.37 1.75 5.22 1.44 0.636 0.717 0.461 C. leptumgroup 4.81 2.21 4.99 1.48 4.69 1.43 0.735 0.483 0.824 Lactobacillusgroup 6.66 1.18 6.85 1.08 6.73 1.05 0.449 0.625 0.804
E. coli 6.39 1.49 5.56 1.93 6.52 1.66 0.064 0.030 0.792
Bifidobacteriumspp. 6.74 1.57 7.20 1.32 7.45 1.40 0.200 0.468 0.077
B. longum 5.83 1.96 5.95 1.63 6.24 1.52 0.768 0.477 0.373
B. breve 5.55 1.82 5.29 1.71 5.26 1.73 0.594 0.952 0.580
B. bifidum 5.34 1.41 4.51 1.34 4.72 1.41 0.030* 0.550 0.135 B. adolescentis 5.68 1.35 4.64 0.76 5.23 1.11 0.122 0.272 0.493
B. catenulatum 5.15 1.97 5.11 1.88 4.81 1.64 0.953 0.644 0.660
B. angulatum 4.69 0.55 4.76 0.94 4.52 0.45 0.900 0.637 0.700
B. infantis 5.58 0.96 6.55 1.55 5.40 0.19 0.156 0.257 0.848
B. lactis 3.87 0.30 3.46 0.42 3.96 0.40 0.254 0.064 0.769
B. dentium 4.14 0.14 4.86 0.62 6.35 - - -
-1Data are expressed as mean and standard deviation of log cells/g faeces. 2Statistical significant differences were calculated using ANOVA and
Table 7.Faecal microbiota of breast-fed infants with different HLA-DQ genotype at 4 months of age analysed by qPCR.
2p-value
High risk Intermediate risk Low risk High- Intermediate-
High-n = 11 n = 39 n = 21 Intermediate Low Low
1Mean SD Mean SD Mean SD Risk Risk Risk
Bacteroides fragilisgroup 4.47 1.93 4.77 1.77 4.51 1.67 0.636 0.640 0.956 Staphylococcusspp. 4.52 0.33 5.42 0.90 4.27 0.51 0.102 0.041 0.712 C. coccoides - E. rectalegroup 5.81 1.84 5.47 1.35 5.45 1.09 0.485 0.969 0.502 C. leptumgroup 5.70 1.28 4.90 1.09 4.08 0.76 0.075 0.020* 0.002* Lactobacillusgroup 6.51 1.00 6.92 0.90 6.96 0.88 0.190 0.876 0.188
E. coli 6.15 1.46 6.43 1.90 6.32 1.71 0.662 0.832 0.814
Bifidobacteriumspp. 7.23 1.22 6.80 1.32 7.33 1.29 0.347 0.156 0.833 B. longum 6.54 1.38 6.25 1.29 6.37 1.32 0.532 0.741 0.740
B. breve 6.46 2.48 5.95 1.71 6.14 1.65 0.508 0.691 0.691
B. bifidum 5.41 1.31 4.95 1.38 4.96 1.24 0.335 0.971 0.384
B. adolescentis 6.68 1.83 4.71 0.55 6.70 0.94 0.015 0.006 0.975
B. catenulatum 5.49 1.60 5.07 1.76 5.38 0.93 0.591 0.598 0.897
B. angulatum 4.46 1.15 4.33 0.69 4.30 - - -
-B. infantis 4.92 - 6.54 1.77 6.89 1.88 - -
-B. lactis 4.09 0.23 4.12 0.85 4.00 0.66 0.953 0.819 0.883
B. dentium 4.29 - 4.14 0.66 - - - -
-1Data are expressed as mean and standard deviation of log cells/g faeces. 2Statistical significant differences were calculated using ANOVA and
post hocLSD test. Significant differences were established at p,0.050. doi:10.1371/journal.pone.0030791.t007
Table 8.Faecal microbiota of formula-fed infants with different HLA-DQ genotype at 7 days of age analysed by qPCR.
2p-value
High risk Intermediate risk Low risk High- Intermediate-
High-n = 11 n = 17 n = 13 Intermediate Low Low
1
Mean SD Mean SD Mean SD Risk Risk Risk
Bacteroides fragilisgroup 5.39 1.34 3.79 1.37 4.06 1.63 0.046* 0.723 0.103 Staphylococcusspp. 5.40 1.04 4.82 1.46 4.40 1.27 0.560 0.673 0.377 C. coccoides - E. rectalegroup 5.65 1.19 5.25 1.46 5.55 1.84 0.541 0.640 0.890 C. leptumgroup 4.32 1.08 3.59 1.02 3.44 2.37 0.290 0.852 0.314 Lactobacillusgroup 6.37 0.74 6.84 1.01 6.82 1.20 0.241 0.973 0.280
E. coli 6.60 1.97 6.11 2.25 5.47 2.05 0.578 0.513 0.303
Bifidobacteriumspp. 5.73 1.35 6.61 1.72 7.23 1.23 0.164 0.287 0.029* B. longum 4.81 1.17 5.95 1.39 5.79 1.32 0.031* 0.758 0.087
B. breve 4.79 1.63 4.38 1.45 5.32 1.20 0.515 0.125 0.450
B. bifidum 4.28 0.92 4.13 1.03 4.84 0.94 0.763 0.090 0.308
B. adolescentis 4.12 0.12 3.70 - 5.37 0.27 0.692 0.431 0.808
B. catenulatum 4.53 0.83 4.77 1.24 4.37 0.68 - -
-B. angulatum 4.09 - 5.01 1.14 5.42 - - -
-B. infantis 5.74 - 5.69 - 4.06 0.08 - -
-B. lactis 4.15 0.14 3.52 0.07 4.48 0.54 0.109 0.032* 0.317
B. dentium - - 3.88 - 4.21 - - -
-1Data are expressed as mean and standard deviation of log cells/g faeces.
Table 9.Faecal microbiota of formula-fed infants with different HLA-DQ genotype at 1 month of age analysed by qPCR.
2p-value
High risk Intermediate risk Low risk High- Intermediate-
High-n = 18 n = 16 n = 17 Intermediate Low Low
1Mean SD Mean SD Mean SD Risk Risk Risk
Bacteroides fragilisgroup 5.28 2.42 4.46 1.70 3.94 1.18 0.317 0.537 0.126 Staphylococcusspp. 6.43 1.16 5.23 1.20 4.70 0.86 0.069 0.446 0.018* C. coccoides - E. rectalegroup 6.00 0.84 6.02 1.59 6.12 0.99 0.958 0.822 0.780 C. leptumgroup 4.57 1.28 4.37 1.15 4.20 1.96 0.751 0.774 0.554 Lactobacillusgroup 6.81 0.92 7.10 0.99 6.91 0.86 0.376 0.569 0.753 E. coli 6.38 2.11 7.66 1.55 6.20 1.74 0.053 0.031* 0.788 Bifidobacteriumspp. 6.06 1.24 7.39 0.75 7.73 1.40 0.002* 0.400 ,0.001* B. longum 5.14 1.04 6.68 1.30 6.87 1.82 0.003* 0.701 0.001* B. breve 5.05 1.41 5.89 1.52 5.34 1.39 0.126 0.338 0.590
B. bifidum 4.53 1.24 5.62 1.83 4.85 1.09 0.041 0.145 0.544 B. adolescentis 5.23 1.01 4.84 0.55 6.28 2.53 0.698 0.231 0.391
B. catenulatum 4.62 1.08 5.70 1.43 4.57 1.00 0.041* 0.025* 0.922 B. angulatum 4.74 0.32 4.51 0.84 4.73 0.03 0.644 0.696 0.986
B. infantis 5.51 - 4.32 - 4.64 0.57 - -
-B. lactis 4.43 1.05 4.45 0.29 4.38 - - -
-B. dentium 5.25 0.30 - - 4.40 - - -
-1Data are expressed as mean and standard deviation of log cells/g faeces. 2Statistical significant differences were calculated using ANOVA and
post hocLSD test. Significant differences were established at p,0.050. doi:10.1371/journal.pone.0030791.t009
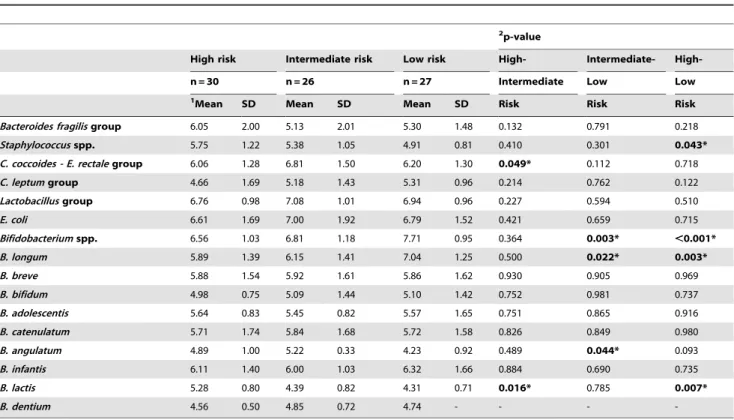
Table 10.Faecal microbiota of formula-fed infants with different HLA-DQ genotype at 4 months of age analysed by qPCR.
2p-value
High risk Intermediate risk Low risk High- Intermediate-
High-n = 30 n = 26 n = 27 Intermediate Low Low
1Mean SD Mean SD Mean SD Risk Risk Risk
Bacteroides fragilisgroup 6.05 2.00 5.13 2.01 5.30 1.48 0.132 0.791 0.218 Staphylococcusspp. 5.75 1.22 5.38 1.05 4.91 0.81 0.410 0.301 0.043* C. coccoides - E. rectalegroup 6.06 1.28 6.81 1.50 6.20 1.30 0.049* 0.112 0.718 C. leptumgroup 4.66 1.69 5.18 1.43 5.31 0.96 0.214 0.762 0.122 Lactobacillusgroup 6.76 0.98 7.08 1.01 6.94 0.96 0.227 0.594 0.510
E. coli 6.61 1.69 7.00 1.92 6.79 1.52 0.421 0.659 0.715
Bifidobacteriumspp. 6.56 1.03 6.81 1.18 7.71 0.95 0.364 0.003* ,0.001* B. longum 5.89 1.39 6.15 1.41 7.04 1.25 0.500 0.022* 0.003*
B. breve 5.88 1.54 5.92 1.61 5.86 1.62 0.930 0.905 0.969
B. bifidum 4.98 0.75 5.09 1.44 5.10 1.42 0.752 0.981 0.737
B. adolescentis 5.64 0.83 5.45 0.82 5.57 1.65 0.751 0.865 0.916
B. catenulatum 5.71 1.74 5.84 1.68 5.72 1.58 0.826 0.849 0.980
B. angulatum 4.89 1.00 5.22 0.33 4.23 0.92 0.489 0.044* 0.093 B. infantis 6.11 1.40 6.00 1.03 6.32 1.66 0.884 0.690 0.735
B. lactis 5.28 0.80 4.39 0.82 4.31 0.71 0.016* 0.785 0.007*
B. dentium 4.56 0.50 4.85 0.72 4.74 - - -
-1Data are expressed as mean and standard deviation of log cells/g faeces.
2Statistical significant differences were calculated using ANOVA andpost hocLSD test. Significant differences were established at p
The cumulative effect of breast-feeding on microbiota compo-sition was also evaluated at 4 months of age and some significant correlations were established. When infants had never been breast-fed, significant correlations between increased genetic risk and low numbers of Bifidobacterium spp., and B. longum were detected (r = 0.343, P = 0.026; r = 0.455, P = 0.003, respectively). Similarly, when infants were breast-fed for more than 1 month and less than 4 months, low numbers ofBifidobacteriumspp. correlated with high genetic CD risk (r = 0.408, P = 0.031), whereas high B. lactis
numbers correlated with high genetic CD risk (r =20.697, P = 0.006). On the other hand, when breast-feeding was exclusive until the fourth month of age, the high genetic risk correlated with increased numbers ofC. leptumgroup (r =20.454, P = 0.001).
Discussion
This is the first report on the effects of both milk feeding type and HLA-DQ genotype on the gut microbial colonization process of healthy full-term infants with a family history of CD. In the present study, milk-feeding type influenced the composition of the microbiota, partially in agreement with previous studies [24]. Breast-feeding favouredC. leptumgroup,B. longumandB. brevegut colonization, while formula-feeding favoured that of B. lactis, E. coli,C. coccoides-E. rectalegroup andB. fragilisgroup. Similar trends were detected when considering the cumulative effect of breast-feeding particularly forC. coccoides-E. rectaleandB. fragilisgroups.
In addition, specific features of fecal microbiota were associated with the genetic risk of developing CD, based on HLA-DQ genotype, when considered irrespectively of milk-feeding type. Increased numbers of Bifidobacterium spp. and B. longum were characteristic of microbiota of infants with the lowest genetic risk, whereas increased numbers of Staphylococcus spp. and B. fragilis
group were characteristic of that of infants with the highest genetic CD risk. To date, there is limited evidence of a correlation between genotype and intestinal microbiota composition in humans. In previous human studies, monozygotic twins were demonstrated to have more similar faecal bacterial DNA profiles than unrelated individuals [25] and monozygotic twins more so than dizygotic twins [10]. More recently a strong bond between genotype, phenotype and changes in gut microbiota has been reported in patients with Cohn’s disease, demonstrating that specific gene alterations (e.g. NOD2 and ATG16L1) can have an impact on intestinal microbiota composition [26]. Animal and human studies indicate that the host genotype may influence factors such as the repertoire of mucins, which act as bacterial adhesion sites in the intestinal mucosa, as well as the immune responses. Together, these can contribute to modulating the colonization of certain microorganisms [27]. In this context, our results suggest that HLA-DQ genotype influences the microbial colonization pattern early in life and, therefore, could be an additional factor influencing the risk of developing CD later in life. Enterocytes, which are in close proximity with intestinal content and bacteria, can express HLA class II molecules of the MHC to a certain extent and are able to act as antigen presenting cells [28]. Moreover, HLA class II molecules are primarily expressed by dendritic cells present in the lamina propria that can sample the mucosal surface for microbial antigens, which can be presented to naı¨ve B and T cells after processed to peptides that are loaded on MHC class I and class II molecules. This is a critical step in triggering the mucosal innate immune response, which could restrict bacterial colonization and influence disease risk [29]. In particular, the increasedStaphylococcuscounts detected in the high CD genetic risk group of infants could favour the activation of a robust T-cell response by the preferential interaction of certain
superantigens, such as staphylococcal superantigen A, with HLA-DQ molecules, thereby enhancing the risk of T-cell mediated diseases [30], such as CD.
The influence of the HLA-DQ genotype was also analysed in subgroups of either breast-fed or formula fed infants to gather more information about the respective effects of each variable (genotype and milk-feeding type) on the microbiota of the infants under study. In the whole infant population, formula feeding favoured the presence of increased numbers ofB. fragilis group, which were also higher in infants with higher genetic risk of developing CD in the whole population and in the subgroup of formula-fed infants, suggesting that the colonization of this bacterial group is greatly defined by type of milk-feeding. Nevertheless, increased counts ofStaphylococcusspp. were associated with increased genetic risk of developing CD in the whole population and in both breast- and formula-fed infant subgroups, but their colonization was not favoured by formula feeding, suggesting that the HLA-DQ genotype plays a more prominent role in the colonization of this bacterial group. Notably, reduced numbers ofBifidobacteriumspp. were associated with an increased risk of developing CD in the whole population and in both breast-and formula-fed infants, breast-and the colonization of species of this genus was also favoured by breast-feeding. Therefore, the findings suggest that bifidobacterial numbers can be influenced by both the HLA-DQ genotype and the milk-feeding type. Moreover, low counts of the speciesB. longumwere found in infants of higher risk to develop CD in the whole population and in the subgroup of formula-fed infants but not in the subgroup of breast-fed infants indicating that the breast-feeding is providing to the infant’s gut microbiota certain Bifidobacterium spp. [31,16], which could partially explain the protective role attributed to breast feeding in the risk of developing CD in previous epidemiological studies [17].
These and other commensal bacteria are recognized as constituting majorstimulifor the adequate development of immune functions and oral tolerance [6], which could also be related to the risk of developing CD. In another prospective study, a reduced ratio ofBifidobacteriumtoClostridiumcounts in the faecal microbiota of infants was shown to precede the development of atopic diseases later in life, indicating that the relative proportions of these bacterial groups may favour or protect against the development of immune-related disorders [32]. Moreover,Bifidobacteriumspp. and
B. longumlevels in both biopsies and faeces have been reported lower in CD patients than in healthy controls [31,33]. However, breast feeding also favoured the presence of increased numbers of
C. leptum group when this factor was considered alone, and this bacterial group was associated with an increased risk of developing CD in the subgroup of breast-fed infants.C. leptumgroup numbers were also reported to be higher in the fecal and duodenal microbiota of CD patients than in healthy controls [34].
Overall, this study demonstrates that the milk-feeding type and the HLA-DQ genotype differently influence the bacterial coloni-zation pattern of the newborn intestine during the first 4 months of life and, therefore, could also influence the risk of developing CD in later life. Breast-feeding reduced the genotype-related differ-ences in microbiota composition, which could partly explain the protective role attributed to breast milk in this disorder. Further studies are underway to reveal additional evidence of the role played by early intestinal colonization patterns in CD develop-ment in this cohort of infants.
Acknowledgments
Author Contributions
Conceived and designed the experiments: YS. Performed the experiments: GDP AC. Analyzed the data: GDP AC YS. Contributed reagents/
materials/analysis tools: FP EN GC VV TP AJG IP AL CR-K AM ADGN CC LO LPQ. Wrote the paper: GDP AC YS.
References
1. Fasano A, Catassi C (2005) Coeliac disease in children. Best Pract Res Clin Gastroenterol 19: 467–478.
2. Sanz Y (2009) Novel Perspectives in Celiac Disease Therapy. Mini-Reviews in Medicinal Chemistry 9: 359–367.
3. Sollid LM (2002) Coeliac disease: dissecting a complex inflammatory disorder. Nat Rev Immunol 2: 647–655.
4. Dubois PC, van Heel DA (2008) Translational mini-review series on the immunogenetics of gut disease: immunogenetics of coeliac disease. Clin Exp Immunol 153: 162–173.
5. Kagnoff MF (2007) Celiac disease: pathogenesis of a model immunogenetic disease. J Clin Invest 117: 41–49.
6. Sanz Y, Sa´nchez E, De Palma G, Medina M, Marcos A, et al. (2008) Indigenous gut microbiota, probiotics, and coeliac disease. In: Overton LT, Ewente MR, eds. Child Nutrition & Physiology Nova Science Publishers Inc, NY. pp 210–224.
7. Plot L, Amital H (2009) Infectious associations of Celiac disease. Autoimmunity Reviews 8: 316–319.
8. Plot L, Amital H, Barzilai O, Ram M, Nicola B, et al. (2009) Infections May Have a Protective Role in the Etiopathogenesis of Celiac Disease. pp 670–674. 9. Salminen S, Isolauri E (2006) Intestinal colonization, microbiota, and probiotics.
Journal of Pediatrics 149: S115–S120.
10. Stewart JA, Chadwick VS, Murray A (2005) Investigations into the influence of host genetics on the predominant eubacteria in the faecal microflora of children. J Med Microbiol 54: 1239–1242.
11. Bezirtzoglou E, Romond C (1990) Effect of the feeding practices on the establishment of bacterial interactions in the intestine of the newborn delivered by cesarean section. J Perinat Med 18: 139–143.
12. Bezirtzoglou E (1997) The intestinal microflora during the first weeks of life. Anaerobe 3: 173–177. S1075-9964(97)90102-5 [pii];10.1006/anae.1997.0102 [doi].
13. Bezirtzoglou E, Tsiotsias A, Welling GW (2011) Microbiota profile in feces of breast- and formula-fed newborns by using fluorescence in situ hybridization (FISH). Anaerobe;S1075-9964(11)00033-3 [pii];10.1016/j.anaerobe.2011.03. 009 [doi].
14. Martin R, Jimenez E, Heilig H, Fernandez L, Marin ML, et al. (2009) Isolation of bifidobacteria from breast milk and assessment of the bifidobacterial population by PCR-denaturing gradient gel electrophoresis and quantitative real-time PCR. Appl Environ Microbiol 75: 965–969.
15. Reviriego C, Eaton T, Martin R, Jimenez E, Fernandez L, et al. (2005) Screening of virulence determinants in Enterococcus faecium strains isolated from breast milk. J Hum Lact 21: 131–137.
16. Martin R, Langa S, Reviriego C, Jiminez E, Marin ML, et al. (2003) Human milk is a source of lactic acid bacteria for the infant gut. J Pediatr 143: 754–758. 17. Ivarsson A, Hernell O, Stenlund H, Persson LA (2002) Breast-feeding protects
against celiac disease. Am J Clin Nutr 75: 914–921.
18. De Palma G, Capilla A, Nadal I, Nova E, Pozo T, et al. (2010) Interplay Between Human Leukocyte Antigen Genes and the Microbial Colonization Process of the Newborn Intestine. Current Issues in Molecular Biology 12: 1–10.
19. Olerup O, Aldener A, Fogdell A (1993) HLA-DQB1 and -DQA1 typing by PCR amplification with sequence-specific primers (PCR-SSP) in 2 hours. Tissue Antigens 41: 119–134.
20. Matsuki T, Watanabe K, Fujimoto J, Miyamoto Y, Takada T, et al. (2002) Development of 16S rRNA-gene-targeted group-specific primers for the detection and identification of predominant bacteria in human feces. Appl Environ Microbiol 68: 5445–5451.
21. Malinen E, Kassinen A, Rinttila T, Palva A (2003) Comparison of real-time PCR with SYBR Green I or 59-nuclease assays and dot-blot hybridization with rDNA-targeted oligonucleotide probes in quantification of selected faecal bacteria. Microbiology 149: 269–277.
22. Donat E, Planelles D, Capilla-Villanueva A, Montoro JA, Palau F, et al. (2009) Allelic distribution and the effect of haplotype combination for HLA type II loci in the celiac disease population of the Valencian community (Spain). Tissue Antigens 73: 255–261.
23. Bourgey M, Calcagno G, Tinto N, Gennarelli D, Margaritte-Jeannin P, et al. (2007) HLA related genetic risk for coeliac disease. Gut 56: 1054–1059. 24. Penders J, Thijs C, Vink C, Stelma FF, Snijders B, et al. (2006) Factors
influencing the composition of the intestinal microbiota in early infancy. Pediatrics 118: 511–521.
25. Zoetendal EG (2001) The Host Genotype Affects the Bacterial Community in the Human Gastronintestinal Tract. Microb Ecol Health Dis 13: 129–134. 26. Frank DN, Robertson CE, Hamm CM, Kpadeh Z, Zhang T, et al. (2011)
Disease phenotype and genotype are associated with shifts in intestinal-associated microbiota in inflammatory bowel diseases. Inflamm Bowel Dis 17: 179–184.
27. Sanz Y, Nadal I, Sanchez E (2007) Probiotics as drugs against human gastrointestinal infections. Recent Pat Antiinfect Drug Discov 2: 148–156. 28. Kaiserlian D, Vidal K (1993) Antigen presentation by intestinal epithelial cells.
Immunol Today 14: 144.
29. Hapfelmeier S, Muller AJ, Stecher B, Kaiser P, Barthel M, et al. (2008) Microbe sampling by mucosal dendritic cells is a discrete, MyD88-independent step in DeltainvG S. Typhimurium colitis. J Exp Med 205: 437–450.
30. Rajagopalan G, Polich G, Sen MM, Singh M, Epstein BE, et al. (2008) Evaluating the role of HLA-DQ polymorphisms on immune response to bacterial superantigens using transgenic mice. Tissue Antigens 71: 135–145. 31. Newburg DS (2005) Innate immunity and human milk. J Nutr 135: 1308–1312. 32. Kalliomaki M, Kirjavainen P, Eerola E, Kero P, Salminen S, et al. (2001) Distinct patterns of neonatal gut microflora in infants in whom atopy was and was not developing. J Allergy Clin Immunol 107: 129–134.
33. Nadal I, Donat E, Ribes-Koninckx C, Calabuig M, Sanz Y (2007) Imbalance in the composition of the duodenal microbiota of children with coeliac disease. J Med Microbiol 56: 1669–1674.