Regional distribution of the National System
of Innovation actors and economic development:
an international comparison
Distribuição regional dos atores do Sistema Nacional de Inovação
e o desenvolvimento econômico: uma comparação internacional
ULISSES PEREIRA DOS SANTOS*g
RESUMO: Acredita-se que os atores do Sistema Nacional de Inovação (NSI) inluenciam e são inluenciados por aspectos regionais, como a localização geográica. Pautado nessa perspecti-va, a performance cientíica, tecnológica e econômica de divisões subnacionais em nove países, desenvolvidos e subdesenvolvidos, é analisada neste trabalho. O objetivo é avaliar a hipótese de existência de maior concentração regional dos entes do NSI em países subdesenvolvidos. Os resultados sugerem que esta hipótese pode estar correta, dado que as atividades de C,T&I tendem a apresentar maior concentração regional nas regiões mais ricas dos países subdesen-volvidos aqui avaliados, em oposição ao que ocorre nos países desensubdesen-volvidos.
PALAVRAS-CHAVE: Sistema Nacionais de Inovação; desenvolvimento regional; desenvolvi-mento econômico; países em desenvolvidesenvolvi-mento.
ABSTRACT: It is believed that actors of the National System of Innovation (NSI) inluence and are inluenced by regional aspects, like geographical allocation. Based on this perspec-tive the scientiic, technological and economical performances in sub-national divisions of nine developed and developing countries are analyzed in this paper. The aim is to evaluate the hypothesis on the existence of higher regional concentration of NSI actors in developing countries. The results suggest that this hypothesis may be correct, since S,T&I activities are more likely to be regionally concentrated in the richest regions in the developing countries analyzed, opposing what happens in developed countries.
KEywORDS: National Systems of Innovation; regional development; economic develop-ment; developing countries.
JEL Classification: O10; O57; R58.
Brazilian Journal of Political Economy, vol. 37, nº 4 (149), pp. 850-869, October-December/2017
* Centro de Desenvolvimento e Planejamento Regional da Universidade Federal de Minas Gerais – CEDEPLAR/UFMG, e-mail: [email protected]. Submetido: 25/September/2015; Approved: 5/ October/2016.
gResearch for this paper was funded by the National Counsel of Technological and Scientific
INTRODUCTION
Regional inequalities happen in every country worldwide in both developed and developing economies. Authors, like Hirschman (1977) and Perroux (1967), since the 1960s have pointed to the imbalances in regional economic growth, even in developed countries. Nonetheless, regional inequalities seem to be more prevalent in less advanced economies, as a consequence of their late development (Furtado, 1967a, 1967b; Pinto, 2000). One of the causes of this situation might be related to
the unequal distribution of the actors of the national system of innovation (NSI) between sub-national regions in the developing countries. In less developed coun-tries, those actors tend to be concentrated in richest regions, which may reinforce a trend towards the regional concentration of income.
From this perspective, this paper analyses data from nine countries, comprising 219 sub-national regions, aiming to identify regional concentration patterns for science, technology and innovation activities and their correlation to the national level of economic development. The main objective is to determine if the NSI actors’ regional concentration is, in fact, higher, in less developed countries. To this end, the number of scientific articles published by residents in sub-national regions, the number of patent applications, and the regional level of income (regional GDP) and population are used in the current analysis.
The nine countries are divided in two groups, the developing countries: Brazil, China, India, Mexico and South Africa; and the developed countries: Australia, Canada, Germany and United States. Those countries were chosen based on the existence of well-established sub-national divisions, such as states or provinces. Characteristics such as the existence of federal systems and the territory extent were also considered, as well as the availability of sub-national data in official data-bases and the coverage of the five continents1.
Information pertaining to regional income and population were taken from official national statistics departments in their web sites2. Since regional GDP is
often available in those web sites only in local currency, the purchasing power par-ity index, provided by world Bank online database, was used to compare the re-gions in terms of income3. Those data are referent to the year of 2010.
Technological production is measured through the number of patent applica-tions in the United States Patent and Trademark Office – USPTO – in 2010 for residents in the analyzed regions. These data were taken by an electronic tool
de-1 The availability of information in English or Spanish languages in official websites was an additional
criterion for the selection of the analyzed countries.
2 Statistics Canada (http://www.statcan.gc.ca), Instituto Nacional de Estadística y Geografía – Mexico
(http://www.inegi.org.mx/), Statistics South Africa (www.statssa.gov.za), Australian Bureau of Statistics (www.abs.gov.au), Ministry of Statistics – India (http://mospi.nic.in), Federal Statistics Office – Germany (www.destatis.de), National Bureau of Statistics of China (www.stats.gov.cn/english), US Bureau of Economic Analysis (www.bea.gov) e IPEADATA-Brazil (www.ipeadata.gov.br).
veloped to search for the desired information in the USPTO’s website. Academic articles published in indexed journals by the Institute for Scientific Information – ISI – are used as proxies for regional scientific production for the year of 2010. USPTO and ISI data were chosen based on their constant use in international comparisons regarding to NSIs. These databases provide information about the regional location of patent applicators or article authors; therefore, they are also applicable for the present analysis.
Those data are used herein to evaluate the patterns of regional concentration of science, technology and innovation – S,T&I – activities in the above mentioned countries. This paper is divided in five more sections. In the second regional aspects of NSI are discussed. In the third general characteristics of the nine countries ana-lyzed are presented. In the fourth section, the regional concentration of income is matched to regional distribution of scientific and technological activities in those countries. In the fifth section development patterns for S,T&I structures and eco-nomic performance are evaluated for the sub-national regions in the nine countries analyzed. The last section presents the conclusions of this paper.
THE REGIONAL ASPECTS OF THE NSI
The influence of regional space over technological innovation has been a mat-ter of research for a long time. Many authors have found that spatial amenities improve the technological performance of the firms (Asheim and Gertler, 2005; Cooke, 1998; Jaffe, 1989). Factors as the embeddedness of firms and agents, the learning infrastructure, agglomeration economies and the spatial spillovers were described as fundamental regional aspects for the innovative activity of industrial firms (Cooke, 2001; Florida, 1995; Granovetter, 1985). These field of analysis as-serted the importance of spatial proximity for the improvement of the intangible aspects related to innovative processes, such as the information flows and trust-based relationships between the agents (firms, universities and research centers) in technological projects.
Most of this literature was influenced by neo-schumpeterian research, includ-ing the NSI’s literature, and was performed by an eclectic group of regional analysts, including regional economists, social scientists and geographers. Its contribution improved old regional concepts by adding to them a neo-schumpeterian approach, such as the concept of Marshallian industrial districts (Harrison, 1992; Marshall, 1983), and introduced new concepts such as the Regional Innovation System (Cooke, 1992). All the coined or re-coined concepts arose mainly during the 1980s and the 1990s and tried to explain both the regional aspects in the innovative performance of firms and the importance of technological activity for regional development in the global economy (Cooke, 1998).
regional space was ignored for most of the scholars in this field during the shaping of the NSI concept and its later developments. Freeman (1987, 2002) was the au-thor in the NSI’s agenda who most gave attention to regional aspects for the in-novation process and economic development. In his memorable book about Japanese catch up, Freeman (1987) pointed to the use of regional policy in the construction of the Japanese system of innovation. This policy prompted the central government to create municipal research centers and laboratories to develop R&D activities and give technical assistance to local industry.
Fifteen years later, the same author challenged the innovation systems research-ers to determine the relationships between innovative structures in different re-gional scales. In this paper, the author considered the existence of sub-national, national and continental systems of innovation that relate to each other in the promotion of the scientific and technological knowledge. For Freeman (2002), those different scales for innovation systems are complementary rather than concur-rent. Freeman (2002) also calls for a better understanding of the relationships be-tween sub-national innovative structures and the NSIs to advance research in eco-nomic development.
This paper follows Freeman (2002) in calling for a better understanding of innovative policies at regional and national levels instead of separating them in two opposite or unrelated spheres. In addition, the preponderance of federal or na-tional policy over regional action reinforces the difficulty of isolating sub-nana-tional and national levels in terms of innovation systems (Edquist, 2005). Therefore, it is proposed here that NSIs influence and are also influenced by regional development and inequalities within the country. Thus, each one of the NSI actors is related to a regional environment being influenced and, at the same time, influencing it (Cooke, 1998). Those mutually interacting and cumulative influences might deter-mine both the innovative activity of the local firms and, as a consequence, the level of regional development. Imbalances in regional development within a spe-cific country may result, therefore, from a concentration in the regional distribution of the NSI agents as well as from problems in regional distribution of economic activities. Thus the technological trajectory of the regions is a response to specific historical events that shaped the regional location of S,T&I assets around national space (Cooke, 2001).
ECONOMIC DEVELOPMENT AND REGIONAL CONCENTRATION OF INCOME
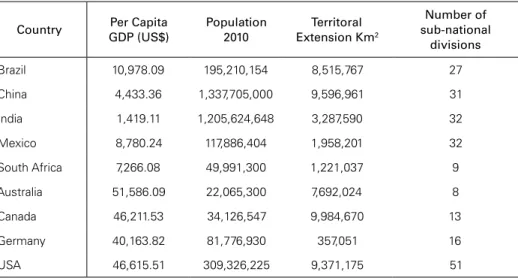
Table 1 shows general features about the nine countries examined. According to the per capita GDP, it is clear that there is a huge gap between the developed and the developing countries. Considering population and territorial extension, it is possible to determine that even in the geographically larger countries and in the more popu-lous for the developed countries the per capita income is still very large. It can be seen in a comparison involving US and China or India. Even though these three countries are very large geographically and have large populations, the US has a very superior per capita GDP in comparison with the two others. In the case of China and India, despite their large GDPs they are not able to generate enough per capita income for their populations, as seen by their very low per capita GDP indexes.
Table 1: General characteristics of the evaluated countries – 2010
Country Per Capita GDP (US$)
Population 2010
Territoral Extension Km2
Number of sub-national
divisions
Brazil 10,978.09 195,210,154 8,515,767 27
China 4,433.36 1,337,705,000 9,596,961 31
India 1,419.11 1,205,624,648 3,287,590 32
Mexico 8,780.24 117,886,404 1,958,201 32
South Africa 7,266.08 49,991,300 1,221,037 9
Australia 51,586.09 22,065,300 7,692,024 8
Canada 46,211.53 34,126,547 9,984,670 13
Germany 40,163.82 81,776,930 357,051 16
USA 46,615.51 309,326,225 9,371,175 51
Source: Author’s own elaboration. Data from World Bank.
The nine countries show very different sub-national divisions. Although most of them are federalized and divided into states or provinces, some of these countries have specific sub-national divisions, especially India and China. India is comprised of 28 federal states and 7 territories from which only 4 were considered in the present analysis due to the limited availability of information4. In China, the
re-gional sub-divisions of the territory comprise 22 provinces, 4 municipalities, 5 autonomous regions and 2 special administrative regions. The municipalities, like Beijing and Shanghai, have the same status as the provinces. The autonomous re-gions, such as Tibet and Mongolia, also have similar status to the provinces, but
hold larger legislative rights because they are constituted predominantly by ethnic minority groups. The special administrative regions have greater administrative independence from the Chinese central government. The two special administrative regions, Hong Kong and Macau, are not included in this analysis because of their dispersed character in relation to the other Chinese regions and the unavailability of data from official Chinese sources. Thus 31 sub-national regions are considered for China in this work. The other seven countries of this study are divided into states or provinces and territories, which can be compared without major method-ological problems.
Data pertaining to the scientific articles published and to patent applications per million of inhabitants for the evaluated countries are presented in Table 2. It is possible to determine that the number of articles per million of inhabitants in the less developed countries is much smaller than the one verified in developed coun-tries. Even countries with great number of publications in absolute numbers, as Brazil, China and India, show scientific production below the possibilities offered by their population scales. This aspect points to the necessity of increasing the scientific activity in less developed countries. Looking at the sub-national regions with the highest number of articles per million of inhabitants in their countries, a special case is Beijing (China). This region has a number of articles per million of inhabitants as high as that observed in the top regions in developed countries like Canada and Germany. Comparing the performance of Beijing with all the country it is possible to observe evidence of geographical concentration of scientific produc-tion in that municipality.
Table 2: Scientific Articles and Patents per 1 million of inhabitants by country – 2010
Articles Patents
Brazil 153.465 0.174
China 100.671 1.610
India 34.866 0.092
Mexico 73.613 0.331
South Africa 169.529 0.580
Australia 2,375.857 25.696
Canada 1,469.618 52.950
Germany 1,012.437 47.789
USA 966.245 348.386
Source: Author’s own elaboration. Data from Statistics Canada, INEGI – Mexico, Statistics South Africa, Australian Bureau of Statistics, Ministry of Statistics – India, Federal Statistics Ofice – Germany, National Bureau of Statistics of China, US Bureau of Economic Analysis, IPEADATA – Brazil and USPTO.
than the underdeveloped countries group. The distance between those groups jus-tify the need for improvements in the scale of technological activities in the less developed countries evaluated here.
In terms of regional concentration of technological production, it seems being a characteristic more related to underdevelopment economies. In China 68% of patent applications for the country are originated in Guangdong province. In Brazil, 70% of the patent applications in USPTO came from Sao Paulo state, and, in ad-dition, only 15% of Brazilian sub-national (States) regions had patent applications in 2010. In the USA, the share of the sub-national region with the largest number of patents is the lowest among the nine countries5. In addition, for India and
Mexico, the regions with the highest share of national patents represent around one third of the national total, a similar situation to Germany. Nevertheless, while in those two countries most of the regions do not have patents, in contrast to Germany, where all the regions do.
Based on data from these nine countries it is possible to suggest that there are different patterns of scientific and technological activities in developed and develop-ing countries, which explains the economic differences among them as pointed by the literature (Bernardes and Albuquerque, 2003). In the sequence the regional characteristics of these different patterns will be analyzed.
REGIONAL CONCENTRATION OF INCOME, SCIENTIFIC ARTICLES AND PATENT APPLICATIONS
In this section, an analysis of the regional concentration of income and scien-tific and technological activities is performed. The dispersion of these variables within these countries is analyzed here to test the relationship between the re-gional distribution of income and national economic development. Two indicators are used for this purpose, the williamson’s weighted Coefficient of Variation and the Theil index.
The weighted coefficient of variation (CV) proposed by williamson (1965) is an index that measures the dispersion of regional income level relative to the na-tional average. In this way, the regional deviations in income are weighted by the regional share within the national population. In this sense, the higher the CV is the larger the differentials in regional income are (williamson, 1965).
5 Here an observation is necessary. Since the USPTO is the national patents office in the USA, it is
The williamson’s weighted Coefficient of Variation is given by:
CV
y y P
P y i i i N = −
(
)
∑
2 (1)where yi is the per capita GDP in region i, is the national per capita GDP, Pi
is the population in region i and P the national population.
Theil index is also a popular measure for spatial inequalities. The Theil index is given by the formula below:
J P p P P Y Y i i i i N = =
∑
ln 1 (2)Pi and P represent respectively the region i population and the national popu-lation, as above, and Yi and Y represent the regional and national GDPs, respec-tively. For this index, the higher is the regional concentration of the evaluated variable the larger is its numerical value.
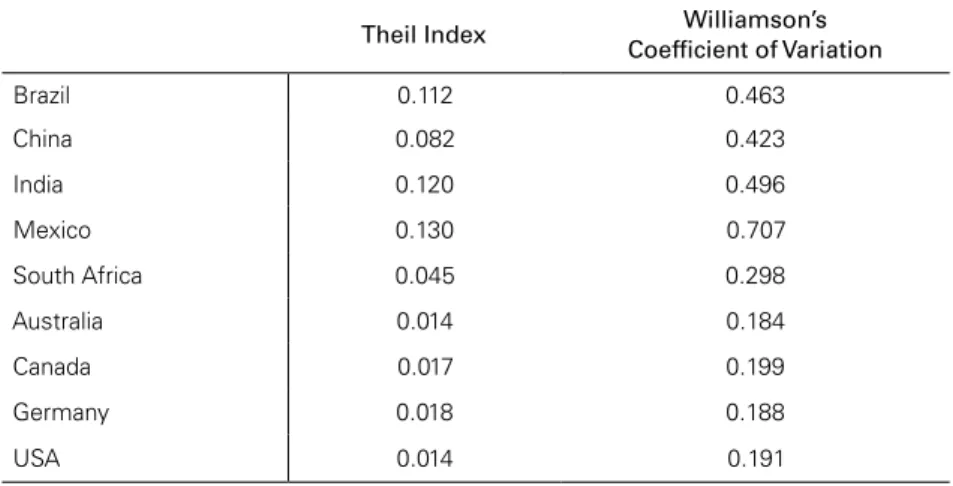
Table 3 shows the values for the williamson’s CV and Theil index for income in the nine selected countries.
Table 3: Theil Index and Williamson’s Coefficient of Variation for regional income (GDP) – 2010
Theil Index Williamson’s
Coeficient of Variation
Brazil 0.112 0.463
China 0.082 0.423
India 0.120 0.496
Mexico 0.130 0.707
South Africa 0.045 0.298
Australia 0.014 0.184
Canada 0.017 0.199
Germany 0.018 0.188
USA 0.014 0.191
Source: Author’s own elaboration. Data from Statistics Canada, INEGI – Mexico, Statistics South Africa, Australian Bureau of Statistics, Ministry of Statistics – India, Federal Statistics Ofice – Germany, Natio-nal Bureau of Statistics of China, US Bureau of Economic ANatio-nalysis and IPEADATA – Brazil.
found. On the other hand, for developing countries, CVs and Theil index values are higher, suggesting a larger variation between the regional GDPs within these countries. In other words, those results suggest that developed countries have more homoge-neous regions in terms of income than developing countries. In the case of developing countries, there was a tendency toward greater income inequality between regions.
This analysis of CV and Theil index points to the existence of major sub-na-tional disparities in developing economies compared to the developed ones. It is known that those results cannot be generalized due to the small number of observed countries, but the high contrast between the two groups (developed and developing countries) seen in Table 3 allows hypothesizing about such a tendency. Moreover, these results have already been predicted and confirmed by the literature on eco-nomic development and regional economy. In terms of theory, important authors in the Latin American Structuralist school, such as Pinto (2000) and Furtado (1967a, 1967b), drew attention to the relationship between structural/regional het-erogeneity and underdevelopment. In terms of empirical contributions, the original work of williamson (1965) compared various countries and noted that the exis-tence of dual sub-national economies would be related to an incomplete develop-ment trajectory for national economy.
Table 3 indicates, therefore, that the hypothesis of greater regional concentra-tion of income in the developing economies is confirmed for the set of countries used here. The threshold difference with respect to the williamson’s CV and the Theil index among developed and developing countries points to this as well as the fact that williansom (1965) has already observed this phenomenon in the 1960s.
Following the Theil Index is used to provide clearer evidence about patterns of regional distribution of scientific activity in developed and developing countries. Here the variable regional GDP was replaced by the number of articles per region in the Theil Index formula. The results are presented in the Graph 1, which is a graph that shows in its horizontal axis the Theil Index for Income (GDP) and in the vertical axis the Theil Index for scientific production to compare the regional behavior of those variables for the evaluated countries.
Graph 1 shows high homogeneity among the most developed countries in terms of regional distribution of internal scientific production and income. Australia, Canada, Germany and USA have the lowest levels of regional concentration for income. Similarly, the levels of regional concentration of scientific activity are low-er in these countries. Among them, Glow-ermany is the one with the highest Theil Index value for scientific activity, 0.16.
Graph 1: Theil Index for Income and Regional Scientific Production in the Analyzed Countries – 2010
0.05 0.1 0.15
0
0.6
Th
eil
Articles
Theil Income
0.4
0.2
China
Mexico
South Africa
Germany
Australia USA
Canada
India
Brazil
Source: Author’s own elaboration. Data from Statistics Canada, INEGI – Me-xico, Statistics South Africa, Australian Bureau of Statistics, Ministry of Sta-tistics – India, Federal StaSta-tistics Ofice – Germany, National Bureau of Statis-tics of China, US Bureau of Economic Analysis and IPEADATA – Brazil.
In the following analysis of regional concentration of technological activity is based in an index weighted by regional populations. In this analysis of technologi-cal activity, the williamson weighted Coefficient of Variation – CV – is used. In this way, the high number of zeros in the dataset disrupts the calculation of the Theil index. However, CV is a classical index used for the analysis of regional imbal-ances in income, first presented by williamson (1965) in a study comprising regions of developed and developing countries. The CV substitutes the Theil index in this section given the great number of sub-national regions with no patent applications identified in USPTO data set for 2010.
Graph 2 shows the CVs of regional income (horizontal axis) to technological production (vertical axis). As for scientific production, it is possible to test if there is a more homogeneous pattern for the developed countries. Among them, Germany is the one with the highest level for regional concentration of technological activ-ity, according to the CV index, 0.79. On the other hand, South Africa is the less developed country with the lowest level of regional concentration for technological activity; the CV is 1.11. A higher heterogeneous pattern of regional distribution of income and patent applications for the developing countries was identified again, in contrast to the homogenous pattern observed among the developed countries.
Graph 2: Williamson’s Coefficient of Variation for Income and Technological Production in the Evaluated Countries – 2010
China
Mexico
South Africa
Germany
Australia USA
Canada
0.5
2
CV P
atents
1.
5
1
0.2 0.3 0.4 0.5 0.6 0.7
CV Income Brazil
India
Source: Author’s own elaboration. Data from Statistics Canada, INEGI – Mexico, Statistics South Africa, Australian Bureau of Statistics, Ministry of Statistics – India, Federal Statistics Ofice – Germany, National Bureau of Statistics of China, US Bureau of Economic Analysis and IPEADATA – Brazil.
Thus, it is possible to establish a connection between the regional distribution of the NSI actors, based on scientific and technological activities, and the develop-ment level for the nation. The analysis performed here suggests that most developed countries tend to have a more equitable regional distribution of NSI agents across their sub-national regions than the developing ones. In this way, seeking a more equitable territorial distribution of NSI actors may be a strategy to overcome the problems related to the underdevelopment.
AN EVALUATION OF ANALyZED REGIONS ACCORDING TO S,T&I INDICATORS
Table 4: Number of sub-national regions with scientific and technological activities by country – 2010
Regions with patents and
articles
Regions only with articles
Regions with no patents and
no articles
Total of Regions
Brazil 4 23 0 27
China 20 11 0 31
India 9 22 1 32
Mexico 9 23 0 32
South Africa 5 4 0 9
Australia 7 1 0 8
Canada 10 3 0 13
Germany 16 0 0 16
USA 51 0 0 51
Total 131 87 1 219
Source: Author’s own elaboration. Data from USPTO and ISI.
In the developed countries, most of the regions showed both scientific and technological activities. The exceptions are one sub-national region in Australia and three sub-national regions in Canada, but all the sub-national divisions in these countries have scientific activity.
Among the developing countries, only China and South Africa have most of their regions showing technological activity. For the other developing countries, most of the sub-national regions performed only scientific activities. This is one of main problems of less advanced NSIs, the disconnection of scientific and techno-logical activities. As happens in Brazil, for example, there is relevant scientific pro-duction that is underused by the internal industries to create technological improve-ments (Albuquerque, 1999). India was the only country of the nine with one of its sub-national region without any patent application and scientific article for the year of 2010.
Based on the difference among regions located in developed countries and regions located in developing, a grouping covering all the 219 regions is presented in this section. The regions are divided into four groups differentiated by the devel-opment level of the countries they belong to and by its technological performance. Thus, the criterion by which regions from developing countries are categorized is based upon whether they performed patent applications in the USPTO.
be more homogeneous in terms of S,T&I indicators. On the other hand regions of developed countries with less than 30 patents per million of inhabitant are less homogeneous to other regions in similar situation. The four groups are described as follow:
1. Regions from the five developing countries that had no patents identified in 2010 in USPTO;
2. Regions from the five developing countries that had patents identified in 2010 in USPTO;
3. Regions from the four developed countries that had up to 30 patents per million of inhabitants identified in USPTO in 2010;
4. Regions from the four developed countries that had more than 30 patents per million of inhabitants identified in USPTO in 2010.
Table 5 shows the number of sub-national regions per country in each of the four groups. Group 1 is the larger among the four, formed by a great number of regions without patents from mainly Brazil, India and Mexico. As noted above, in these countries most of the sub-national regions did not have patents identified in 2010. Group 2, formed by the regions from developing countries with technologi-cal activity is predominantly composed by Chinese lotechnologi-calities. In this group 43% of the regions are in China which may explain the recent economic success of that country. Brazil is the country with the smallest number of regions in Group 2, al-though it has three times more states than South Africa.
Table 5: Distribution of the regions among the groups by country
Categories
Country 1 2 3 4 Total
Brazil 23 4 0 0 27
China 11 20 0 0 31
India 23 9 0 0 32
Mexico 23 9 0 0 32
South Africa 4 5 0 0 9
Australia 0 0 7 1 8
Canada 0 0 8 5 13
Germany 0 0 11 5 16
USA 0 0 0 51 51
Total 84 47 26 62 219
For developed countries, with regions in Groups 3 and 4, it is determined that most of the regions are in the last group. This result is a consequence of the presence of all USA sub-national regions (states) in the Group 4. This demonstrates USA tech-nological leadership in the world. In their turn, Canadian, Australian and German regions in this group have similar technological performance to USA regions.
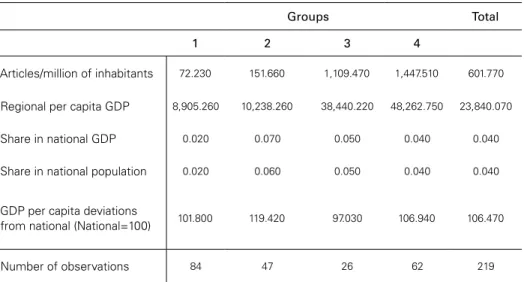
Some variables are used to evaluate the characteristics of each group. These variables with their average values are displayed on Table 6. The development level differences between the regions in the four groups are clear. For the regions of less developed countries classified in Groups 1 and 2, it is possible to confirm that scientific activity is greater in regions with technological activity. This is further evidence of the importance of scientific structure to technological performance in sub-national regions. This result suggests that regions with well-established scien-tific infrastructure tend to be more likely to have innovations than others, represent-ing evidence in favor of the learnrepresent-ing regions approach (Asheim, 1996; Florida, 1995). In this approach, the information channels among scientific and
techno-logical actors would be enhanced given the physical proximity and the sharing of same social and cultural environments by the agents (Cooke, 1998; Jaffe, 1989).
Table 6: Average values for evaluated regional variables for the groups
Groups Total
1 2 3 4
Articles/million of inhabitants 72.230 151.660 1,109.470 1,447.510 601.770
Regional per capita GDP 8,905.260 10,238.260 38,440.220 48,262.750 23,840.070
Share in national GDP 0.020 0.070 0.050 0.040 0.040
Share in national population 0.020 0.060 0.050 0.040 0.040
GDP per capita deviations
from national (National=100) 101.800 119.420 97.030 106.940 106.470
Number of observations 84 47 26 62 219
Source: Author’s own elaboration. Data from Statistics Canada, INEGI – Mexico, Statistics South Africa, Australian Bureau of Statistics, Ministry of Statistics – India, Federal Statistics Ofice – Germany, National Bureau of Statistics of China, US Bureau of Economic Analysis and IPEADATA – Brazil.
likely to be more innovative, as the literature has already shown for countries (Bernardes and Albuquerque, 2003). Another point is related to the distance be-tween the regions classified in Groups 3 and 4 in terms of scientific production. The average number of articles per million of inhabitants published by residents in the regions in Group 3 represents 77% of the amount observed in Group 4. Among the less developed countries, the average number of articles per million of inhabit-ants for Group 1 is 48% of the value for Group 2. This situation stresses that re-gions in most developed countries tend to be more homogeneous than rere-gions in developing countries, since the difference in scientific production between Groups 3 and 4 is not that high.
Additionally, there is a high difference between average scientific activity be-tween developed and developing countries. The average number of scientific articles published by residents in regions of Group 2 represents only 15% of the total ob-served in Group 3 and 10% of the obob-served value in Group 4. It illustrates the backwardness of innovation systems in developing countries compared to the most developed countries. Even in the richest regions in developing countries have sci-entific activities in a very lower level compared to those performed by regions in developed countries. This condition might be related to the high regional concentra-tion of NSI actors in peripheral economies, as noted above. So the small number of sub-national regions with developed S,T&I infrastructures reduces the scientific possibilities along national territory, which also happens to technology activity. In this way, the absence of scientific scale narrows the development opportunities including for the richest regions in developing countries. As a result, these less de-veloped countries have scientific activity in smaller scales in the aggregate.
According to this interpretation, a concentration of the S,T&I assets in the most dynamic sub-national regions in peripheral economies will not be sufficient to enable them to push the rest of country to a scientific and technological level close to that performed by developed countries. Hence, most dynamic regions need the rest of the country to advance national development. Furthermore, structural improvements in depressed areas might make them more likely to develop their regional economies. Such measures might generate benefits for the richest regions through the establishment of scientific and technological networks and the opening of new and more diverse markets within the same country, i.e., internal economic integration. In this context, imbalances in regional distribution of development and S,T&I assets are not expected to disappear, but they might be smaller as already checked in the developed countries analyzed here. Thus, the catch up process might also be affected by spreading S,T&I assets over the national territory, since it pre-supposes an increase in national scientific and technological activities.
countries analyzed above. Therefore, a better distribution of S,T&I assets across sub-national regions might be a policy argument for national catch up process, since it increases the scientific and technological scales and generates new techno-logical opportunities across the national territory.
Table 6 also shows that regions in Group 2 tend to have per capita GDP in average numbers superior to regions in Group 2. Those regions also exhibit average per capita GDP higher than the overall country. This result confirms that the re-gions with patents applications tend to be the most developed ones in their respec-tive countries. These regions possess higher shares of the national GDP and popu-lations. So, regions with technological activity in less developed countries are more developed than the other sub-national regions and concentrate larger shares of economic activity and population. In the Brazilian case, for instance, the state of Sao Paulo is responsible for 30% of national GDP, 22% of the populations and 70% of the national patent applications in USPTO in 2010. Taken together the four Brazilian states that had patent applications in USPTO in 2010 are responsible for 60% of Brazilian GDP.
In India, nine of thirty-two regions had patent applications, and those nine represent together 70% of the national GDP. The state of Maharashtra has the major regional GDP in India and is responsible for one third of the patent tions from the country in USPTO. In China, most of the regions had patent applica-tions in 2010, nevertheless only five had more than one patents per million of in-habitants. The state of Guangdong concentrates 67% of Chinese patents in USPTO and also is the state in the country with the highest number of patents per million of inhabitants. Moreover, Guangdong is the province with major shares in na-tional GDP and population. However, the sub-nana-tional region with the highest scientific production in the country is the municipality of Beijing.
These results associate the better performance in technological and scientific aspects to the regions that are more representative in national economy and popu-lation for developing countries. This association is not manifested in the developed countries. Even though the national scientific and technological leaders are also the regions with highest per capita GDP, these regions are not the most representative in national populations or GDPs. That is, in developed countries the economic scale of the regions is not a prerequisite for their scientific or technological activity. Another important result is related to the regional per capita GDP deviations from
In the USA, for example, the state with the largest shares in national GDP and population is California, which is also the state with the greater number of patents in the country. However, if technological production is weighted by the regional population, then the state with the best result is Vermont, even representing only 0.18% of national GDP. States like washington and Massachusetts, with a share of almost 2% of the USA GDP, also overcome California in terms of patents per million of inhabitants. In Germany, the state with the largest share of national GDP, North Rhine-westphalia, neither is the one with the largest number of patents. That state is Bavaria. North Rhine-westphalia has only the sixth largest number of pat-ents per million of inhabitant in the country, even though it is responsible for 22% of German GDP. This state is overcome by other states, such as Hamburg that represents 3% of national GDP and Rhineland-Palatinate with 4%.
Therefore, while in developing countries only regions with most representative economies are able to develop technological innovations, in developed countries even regions with small scale economies have great technological activity relative to their populations. This difference might be a consequence of the relatively strong concentration of S,T&I assets in the richest sub-national regions in developing countries. In this way states, provinces or cities with the largest GDPs in these countries tend to host the major part of NSIs in these countries. This condition seems to be a natural consequence of market forces since the regional economic development for these regions demands and induces the building of scientific and technological structures there. It is a result of a cumulative causation process, as described by Myrdal (1957) and by Furtado (1967a) and accentuates the regional imbalances in developing countries in the absence of national state’s intervention. Therefore, the existence of concentrated NSI structures for some regions is related to the regional income concentration in those countries. On the other hand, in developed countries the broader geographical distribution of NSI agents across national territory allows all the regional economies to attain a higher technological performance.
CONCLUSION
In this paper, a comparison between sub-national regions located nine different countries was performed to evaluated the validity of the hypothesis that developing countries demonstrate higher regional concentrations of NSI assets. The analysis of the data for income and scientific and technological activities suggests that this hypothesis is correct, at least for the nine selected cases.
the developed countries almost overall sub-national regions performed techno-logical activity.
The performance shares of the regions in Groups according to their techno-logical activity showed the existence of regional patterns for both developed and developing national economies. First, the association between technological and scientific activities is clear for the regions. The regions with higher technological performance, independent of the country they belong to, are also among the regions with highest scientific activity. This result indicates that the regional improvements in technological activity demand the local establishment of a scientific structure. In addition, there are regional aspects that make easier the relationship involving sci-ence and technology. Even though knowledge is a global asset in the information era, the physical proximity of the agents favors its transfer from universities and research institutes to industry, making innovation more likely. Thus, regional sci-entific structures are required for all sub-national regions and those regional assets require integration within the NSI institutions and agents to improve regional de-velopment possibilities. But this requirement is not met in the less developed coun-tries, as data suggests here.
Another important issue in this analysis is related to the regional share of economic activity and the concentration of S,T&I activities in less developed coun-tries. In these economies, there is tendency for only regions with the highest shares of national GDP to produce the relevant scientific and technological activities. This process is probably related to the previous economic development in those regions. As a result, the richest regions in peripheral economies are naturally driven to
con-centrate national income and most parts of NSIs in the absence of counter-concen-tration politics from national governments. This process tends to lead to the main-tenance and to the reinforcement of regional income concentration in developing countries.
Is also important to note that the high degree of regional inequalities in devel-oping countries can restrict the overall national scientific and technological produc-tions. The evidence for this is the performance of the richest regions in those coun-tries that is still very below that of the performance of regions of developed countries. This is a consequence of the strong imbalances among sub-national re-gions in terms of S,T&I structures. Hence, the innovative institutions in the richest regions cannot interact with surrounding areas that do not have similar institutions. This condition inhibits the development of S,T&I activities in the richest regions, which in turn inhibits the national catch up process. By contrast, the developed countries are comprised of more homogeneous sub-national regions. In these coun-tries even the regions with smallest economies have consistent S,T&I structures and are important to the NSI. Each region is able to develop its own technological improvements and push surrounding areas with similar S,T&I by the regional spillovers created.
sub-na-tional regions. The main contribution of this paper is to show a tendency toward a higher regional concentration of NSI actors in developing countries. A compari-son with developed economies suggests the need to spread NSI institutions across the national territory in developing economies as a means of attaining higher ho-mogeneity among sub-national regions. This effort might have beneficial effects not only across less developed regions but also over the richest sub-national regions and, consequently, over all of the NSI.
REFERENCES
Albuquerque, Eduardo. (1999). “National Systems of Innovation and Non-OECD Countries: Notes about a Rudimentary and Tentative Typology.” Brazilian Journal of Political Economy 19(4): 35–54.
Asheim, Bjorn T. (1996). “Industrial districts as ‘Learning Regions’: A condition for prosperity.” Euro-p e a n P l a n n i n g S t u d i e s 4 ( 4 ) : 7 – 1 1 . h t t p : / / w w w. t a n d f o n l i n e . c o m / d o i / abs/10.1080/09654319608720354 (May 2, 2012).
Asheim, Bjorn T., and Meric Gertler. (2005). “The geography of innovation.” In The Oxford Handbook of Innovation, eds. Jan Fagerberg, David Mowery, and Richard R Nelson. Oxford: Oxford Uni-versity Press, 291–317.
Bernardes, A. T.; Albuquerque, E. M (2003). “Cross-over, thresholds and interactions between science and technology: lessons for less-developed countries”. Research Policy, Amsterdam, v. 32, n.5, p. 865-885.
Cooke, Philip. (1992). “Regional innovation systems: competitive regulation in the new Europe.” Geo-forum 23(3): 365–82. http://linkinghub.elsevier.com/retrieve/pii/0016718592900489.
Cooke, Philip. (1998). “Introduction: origins of the concept.” In Regional Innovation Systems, eds. H Braczyc, Philip Cooke, and M Hidernreich. London: UCL Press, 2–25.
Cooke, Philip (2001). “Regional innovation systems, clusters, and the knowledge economy.” Industrial and Corporate Change 10(4): 44–45.
Edquist, Charles. (2005). “Systems of innovation: perspectives and challenges.” In The Oxford Hand-book of Innovation, eds. J. Farceberg, D. Mowery, and Richard R Nelson. Oxford: Oxford Uni-versity Press, 181–208.
Florida, Richard. (1995). “Toward the learning region.” Futures 27(5): 527–36.
Freeman, Christopher. (1987). Technology Policy and Economic Performance. London: Pinter Publishers. Freeman, Christopher. (1995). “Formal scientific and technological institutions in the national system of innovation.” In National Systems of Innovation: Towards a Theory of Innovation and Interac-tive Learning, London: Pinter Publishers, 169–87.
Freeman, Christopher (2002). “Continental, national and sub-national innovation systems — comple-mentarity and economic growth.” Research Policy 31: 191–211.
Furtado, Celso. (1967a). “Intra-Country discontinuities: towards a theory of spatial structures.” Social Science Information 6(6): 7–16.
Furtado, Celso (1967b) Teoria e Política do Desenvolvimento Econômico. São Paulo: Cia.Editora Na-cional.
Granovetter, Mark. (1985). “Economic action and social structure: the problem of embeddedness.” American Journal of Sociology 91(3): 481–510.
Harrison, Bennett. (1992). “Industrial districts: old wine in new bottles?” Regional Studies 26(5). Hirschman, Albert. (1977). “Transmissão inter-regional e internacional do crescimento econômico.” In
Economia Regional: Textos Escolhidos, ed. Jacques Schwartzman. Belo Horizonte: CEDEPLAR--UFMG, 35–52.
Lundvall, Bengt-Ake. (1995). “Introduction.” In National Systems of Innovation: Towards a Theory of Innovation and Interactive Learning, ed. Bengt-Ake Lundvall. London: Pinter Publishers, 1–19. Marshall, Alfred. (1983 [1890]). Princípios de Economia. São Paulo: Abril Cultural.
Myrdal, Gunnar. (1957). Economic Theory and Underdeveloped Regions. London: Gerald Duckworth. Nelson, Richard R, and Nathan Rosenberg. (1993). “Technical Innovation and National Systems.” In National Innovation Systems, ed. Richard Nelson. New york, Oxford: Oxford University Press, 3–21.
Perroux, François. (1967). Economia Do Século XX. Lisboa: Herder.
Pinto, Anibal. (2000). “A natureza e implicações da heterogeneidade estrutural na América Latina.” In Cinquenta Anos de Pensamento Na CEPAL, ed. Ricardo Bielshowsky. Rio de Janeiro, São Paulo: Record, 567–88.