DOI: 10.5935/2359-4802.20170073
Introduction
Metabolic Syndrome (MS) is a condition in which risk factors for cardiovascular disease and diabetes mellitus occur in the individual,¹ represented by the combination of at least three of the following five components: abdominal obesity; hypertriglyceridemia; low High‑Density Lipoprotein‑cholesterol (HDL) and Low‑Density Lipoprotein (LDL); arterial hypertension; and fasting hyperglycemia.² Among the metabolic alterations associated with abdominal obesity that contribute to the increase in the occurrence of MS, the
glycemic disorder is significant, which is associated with the risk of cardiovascular disease (CVD).³
Obesity is defined as excess body fat, resulting from the chronic imbalance between food consumption and energy expenditure, which has been growing annually and acquiring alarming proportions.4
The World Health Organization (WHO) indicates obesity as one of the most important public worldwide health problems. In 2014, more than 1.9 billion adults were overweight. Of these, 600 million are already obese. From 1980 to 2013, both obesity and overweight increased 27.5% among adults and 47.1% among children.5
ORIGINAL ARTICLE
Mailing Address: Taianah Almeida Barroso
Departamento de Nutrição e Dietética da Faculdade de Nutrição, Rua Mário Santos Braga, 30, 4º andar, Valonguinho, Centro. Postal Code: 24020-140, Niterói, RJ – Brazil
E-mail: [email protected] [email protected]
Association of Central Obesity with The Incidence of Cardiovascular Diseases and
Risk Factors
Taianah Almeida Barroso, Lucas Braga Marins, Renata Alves, Ana Caroline Souza Gonçalves, Sérgio Girão Barroso, Gabrielle de Souza Rocha
Universidade Federal Fluminense, Niterói, RJ – Brazil
Manuscript received November 27, 2016, revised manuscript April 27, 2017, accepted May 30, 2017.
Abstract
Background:Obesity has been identified as a major risk factor for cardiovascular disease.
Objective: To evaluate the association of central obesity with the incidence of cardiovascular diseases and risk factors.
Methods: This was a cross‑sectional study, carried out with patients treated at a metabolic syndrome outpatient
clinic, with body mass index ≥ 24.9 kg/m2. Nutritional status, laboratory tests (lipid and glycemic profile) and
blood pressure status were analyzed. Participants were stratified into groups regarding the presence or absence of risk factors: diabetes, hypertension, and dyslipidemia.
Results: Women (n = 39), mean age of 44.18 ± 14.42 years, of which 70% were obese and 38% were hypertensive, corresponded to most of the studied sample. Abdominal circumference was 110.19 cm ± 15.88 cm; levels of
triglycerides were 153.72 mg/dL ± 7.07 mg/dL; and fasting glycemia was 188.6 mg/dL ± 116 mg/dL. A significant association was found between the waist/height ratio and the findings of hypertension (p = 0.007); between visceral
fat volume and diabetes (p = 0.01); between the conicity index and the findings of hypertension (p = 0.009) and diabetes (p = 0.006). No significant association was found between body mass index and waist circumference with findings of hypertension, diabetes and dyslipidemia.
Conclusion: Central obesity was associated with a higher incidence of development of risk factors related to cardiovascular diseases. (Int J Cardiovasc Sci. 2017;30(5):416‑424)
In Brazil, obesity rates grow continuously. Some surveys indicate that over 50% of the population has excess weight, that is, in the overweight and obesity range.6,7
According to the 2008‑2009 Household Budget Survey (HBS), there has been an inversion of groups in the Brazilian food pyramid: the fruit and vegetable group exchanged places with the groups of oils and fats, and sugars and soft drinks groups, demonstrating that these foods are highly consumed.7 Inadequate consumption
of fruits and vegetables and excessive consumption of foods high in fats and sugars are associated with the development and increased incidence of obesity and other chronic noncommunicable diseases, such as CVD.7‑9
CVD is the leading cause of death in Brazil and worldwide. Data published by the WHO indicate that around 27% of the world's mortality records were caused by CVD, while in Brazil they were responsible for 31% of deaths.8 This epidemiological scenario is of concern,
because it implies a decrease in the quality of life of populations, as well as high and increasing costs for the government, society, family and individuals.9
In view of the above, the present study is justified by the influence of MS occurrence on the risk of developing CVD and the effects of these disorders on the health status of the individual, which are becoming more frequent in the population. Therefore, it is necessary to study the anthropometric and biochemical parameters of patients with MS to help health professionals working specifically with this group.
The aim of this study was to evaluate the association of central obesity with the incidence of cardiovascular diseases and risk factors.
Methods
This is a cross‑sectional study of patients treated at the Metabolic Syndrome Outpatient Clinic of the Faculdade de Nutrição Emília de Jesus Ferreiro, Universidade Federal Fluminense (UFF), from March to November 2016. The project was approved by the Ethics and Research Committee of the School of Medicine of UFF, under number 59604916.0.0000.5243. All patients signed the Free and Informed Consent form.
The study included patients who met the following criteria: female gender, aged between 18 and 59 years, with a Body Mass Index (BMI) > 24.9 kg/m2 and the
requested biochemical tests.
Weight, height and waist circumference were used to evaluate the nutritional status, after being measured at the routine consultation. The weight was measured on an Even® electronic scale with a total capacity of 300 kg. To measure height, a stadiometer with a total capacity of 200 cm and a minimum capacity of 100 cm was used. Based on these measurements, the BMI [weight (kg)/ height (m)²] was calculated. The WHO classification was used to evaluate BMI: normal weight if the BMI was between 18.5 and 24.9 kg/m2; overweight, if between 25.0
to 29.9 kg/m2; and obesity between 30.0 and 34.9 kg/m2.7
Abdominal obesity was defined based on the abdominal circumference cut‑off point for the increased cardiovascular risk in women (≥ 80 cm), as defined by the American Heart Association (AHA).10
For the waist‑to‑height ratio (WHtR), the cutoff point used was the median one found in the sample (50th
percentile) of 0.65.11 The Visceral Fat Volume (VFV)
was estimated by using a predictive equation, which uses WHtR and Fasting Glycemia (FG) as independent variables. The cutoff point of 100 cm2 was considered
for the VFV.12 The conicity index was calculated
through the Valdez formula, and the value of 1.18 was considered the best cutoff point.13
FG was assessed considering adequacy cutoffs up to 99 mg/dL for healthy subjects and those individuals with FG ≥ 126 mg/dL14 or those who used hypoglycemic agents
were classified as having diabetes; as for triglycerides (TG), values up to 150 mg/dL were considered adequate.15
The values adopted by the American Heart Association (AHA)16 were used for High‑Density Lipoprotein (HDL)
values, being considered adequate when > 50 mg/dL for women; Low Density Lipoprotein (LDL) calculation was performed using Friedewald formula,17 with
values < 160 mg/dL being considered adequate.15,16
Patients with values above the pre‑established ones or who were taking lipid‑lowering drugs were considered as having dyslipidemia.
Patients who had a medical diagnosis of hypertension and those who used classes of antihypertensive drugs defined for hypertension drug treatment: diuretics, adrenergic inhibitors, direct vasodilators, calcium‑channel blockers, Angiotensin‑converting enzyme inhibitors (ACEIs), AT1 receptor blockers and direct renin inhibitors, were classified as hypertensive.18
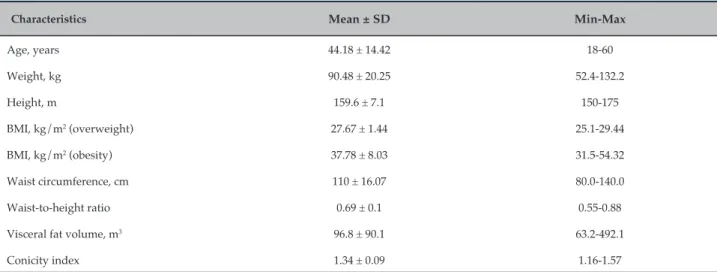
Table 1 – Overall sample characterization
Characteristics Mean ± SD Min-Max
Age, years 44.18 ± 14.42 18‑60
Weight, kg 90.48 ± 20.25 52.4‑132.2
Height, m 159.6 ± 7.1 150‑175
BMI, kg/m2 (overweight) 27.67 ± 1.44 25.1‑29.44
BMI, kg/m2 (obesity) 37.78 ± 8.03 31.5‑54.32
Waist circumference, cm 110 ± 16.07 80.0‑140.0
Waist‑to‑height ratio 0.69 ± 0.1 0.55‑0.88
Visceral fat volume, m3 96.8 ± 90.1 63.2‑492.1
Conicity index 1.34 ± 0.09 1.16‑1.57
Values expressed in absolute numbers. SD: standard deviation; BMI: body mass index.
Statistical analysis
The results are expressed as descriptive statistics as mean ± standard deviation, and normality was verified by the Shapiro‑Wilk test. Because of medication use, we chose to use categorical data (diagnosis) to verify the association between anthropometric measures and the presence of diabetes, hypertension or dyslipidemia, using Fisher's exact test, so that medication use did not influence the analysis, also calculating the odds ratio (OR) to verify the associations between anthropometric indexes and risk factors for cardiovascular diseases. Due to the sample size, we chose not to use prevalence ratios. The results were considered significant when p <0.05. GraphPad Prism 5.0 software was used for these analyses.
Results
The Metabolic Syndrome outpatient clinic treated 98 patients during the study period; of these, 60 were women, but only 39 met all the pre‑established inclusion criteria and agreed to sign the Free and Informed Consent form.
According to the BMI, 30% (n = 12) of the patients had nutritional status of overweight and 70% (n = 27) were obese, and 63% of the obese patients were over 40 years old. Table 1 shows the anthropometric data of this population.
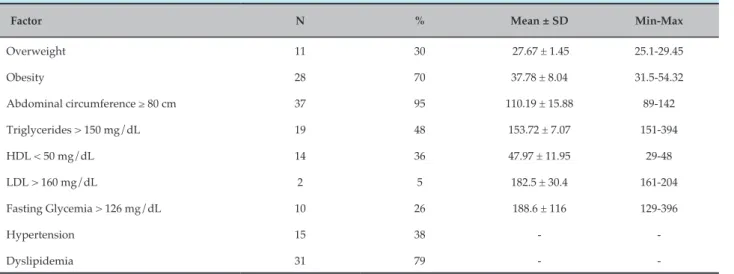
Regarding risk factors, 38% (n = 15) of the sample had hypertension; 26% (n = 10), diabetes; and 79% (n = 31) had dyslipidemia (Table 2). It is possible to observe that
95% (n = 37) of the studied population had an abdominal circumference ≥ 80 cm, and almost half of the sample (48%; n = 19) had TG levels >150 mg/dL.
The statistical analysis showed an association between waist‑to‑height ratio (WHtR) and hypertension findings (p = 0.007). Regarding the other parameters, diabetes and dyslipidemia, no significant results were found (Table 3).
The association between VFV and the findings of hypertension, diabetes and dyslipidemia are shown in table 4. A significant association (p = 0.01) was found between VFV and diabetes, but no significant association was found when other parameters were analyzed.
The association between the conicity index and findings of hypertension (p = 0.009) and diabetes (p = 0.006) showed significant results. Although no association was found regarding dyslipidemia, according to the risk ratio, a 6.6‑fold increased chance was observed in the studied population for the development of dyslipidemia (Table 5).
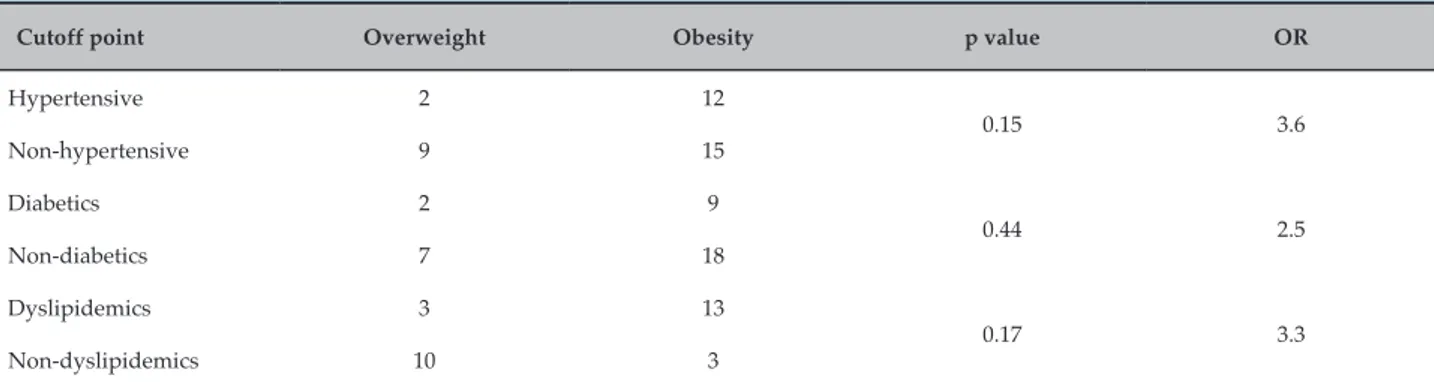
The association between BMI and the findings of hypertension, diabetes and dyslipidemia is shown in table 6, and no association was found between the analyzed parameters. However, according to the calculation of the risk ratio, an increased chance was observed in the studied population for the development of hypertension (3.6‑fold), diabetes (2.5‑fold) and dyslipidemia (3.3‑fold).
Table 2 – Risk factors found in the studied population, by groups
Factor N % Mean ± SD Min-Max
Overweight 11 30 27.67 ± 1.45 25.1‑29.45
Obesity 28 70 37.78 ± 8.04 31.5‑54.32
Abdominal circumference ≥ 80 cm 37 95 110.19 ± 15.88 89‑142
Triglycerides > 150 mg/dL 19 48 153.72 ± 7.07 151‑394
HDL < 50 mg/dL 14 36 47.97 ± 11.95 29‑48
LDL > 160 mg/dL 2 5 182.5 ± 30.4 161‑204
Fasting Glycemia > 126 mg/dL 10 26 188.6 ± 116 129‑396
Hypertension 15 38 ‑ ‑
Dyslipidemia 31 79 ‑ ‑
Discussion
The population analyzed in the study was mostly classified as obese, according to the mean BMI, in addition to showing higher mean values of abdominal circumference, conicity index, and WHtR than the cutoff points established for the evaluation of abdominal obesity. Despite this fact, they had a mean VFV < 100 cm2.
The prevalence of obesity in the study (70% of the population) is noteworthy, as it is a relatively young and still active population, which shows the impact of current eating habits on health. It can be observed that 95% of the sample had abdominal obesity, which is an important risk factor for CVD and other associated morbidities.
Similar findings were observed by Petribú et al.19,
who observed a population with 517 women with a
median age of 29 years, of which 32.5% was overweight and more than half of the sample with abdominal and non‑visceral obesity when waist circumference, WHtR and VFV were analyzed. The authors call attention to the fact that women tend to accumulate subcutaneous fat in the abdominal region, which may justify the findings.
The prevalence of abdominal obesity has increased in recent years and is currently higher than the prevalence of overall obesity, especially in women.20 This can also
be observed in our study, which found a prevalence of 70% of overall obesity and 95% of abdominal obesity, according to the abdominal circumference.
It was observed that 48% of the patients studied had dyslipidemia and, of these, 46% were obese. This fact can be explained by the accumulation of adipose tissue and the release of free fatty acids, which are easily directed to the Table 3 – Association between waist-to-height ratio and hypertension, diabetes and dyslipidemia
Cutoff point ≥ 0.65 < 0.65 p value OR
Hypertensive 12 2
0.007* 8.7
Non‑hypertensive 9 18
Diabetics 6 15
0.26 2.9
Non‑diabetics 3 17
Dyslipidemics 13 6
1 0.9
Non‑ dyslipidemics 15 7
Table 4 – Association between visceral fat volume and hypertension, diabetes and dyslipidemia
Cutoff point ≥ 100 cm² < 100 cm² p value OR
Hypertensive 12 1 0.09 8.4
Non‑hypertensive 10 7
Diabetics 15 1 0.01* 15
Non‑diabetics 7 7
Dyslipidemics 16 2 0.07 6.6
Non‑ dyslipidemics 6 5
Values expressed as absolute numbers. * Fisher's exact test (p < 0.05). OR: odds ratio.
Table 5 – Association between the conicity index and hypertension, diabetes and dyslipidemia
Cutoff point ≥ 1.33 ≤ 1.33 p value OR
Hypertensive 12 9
0.009* 7.1
Non‑hypertensive 3 16
Diabetics 11 10
0.006* 9.9
Non‑diabetics 2 18
Dyslipidemics 16 6
0.06 3.6
Non‑ dyslipidemics 8 11
Values are expressed in absolute numbers. * Fisher's exact test (p < 0.05). OR: odds ratio.
Table 6 – Association between body mass index and hypertension, diabetes and dyslipidemia
Cutoff point Overweight Obesity p value OR
Hypertensive 2 12
0.15 3.6
Non‑hypertensive 9 15
Diabetics 2 9
0.44 2.5
Non‑diabetics 7 18
Dyslipidemics 3 13
0.17 3.3
Non‑dyslipidemics 10 3
Values expressed as absolute numbers. * Fisher's exact test (p < 0.05). OR: odds ratio.
liver for a higher production of TG and Very Low‑Density Lipoprotein (VLDL).15,21 Therefore, it is possible to
associate this complication with the increased risk of developing CVD, which is directly related to obesity.20,22
hormonal differences. This is added to the fact that the aging process causes a decrease in growth hormone production, basal metabolic rate and a natural reduction in physical activity levels, as well as a worsening of healthy eating habits, thus progressively increasing the redistribution of fat; thus, women start to accumulate more abdominal fat.20‑22
The WHtR has been pointed out as an effective way of discriminating abdominal obesity related to cardiovascular risk factors.11,23
In the present study, it was necessary to use other cutoff points for the WHtR, in addition to those suggested in the literature, since it was observed that most of the sample was above this range; thus, we used a cutoff point of 0.65 for WHtR, which represents the 50th percentile of the sample.
The women in the study with WHtR above the cutoff point had a higher frequency of hypertension when compared to those below the cutoff. This finding corroborates current studies, which demonstrate that visceral fat accumulation tends to compress renal mechanics, which is a determinant of higher sodium absorption in the proximal segments of the nephron, causing the activation of the renin‑angiotensin aldosterone system in the dense molecule for the preservation of renal plasma flow and glomerular filtration rate. Hydrosaline retention, and increased blood pressure and intraglomerular pressure levels would occur through this mechanism.24
Regarding the conicity index, some authors suggest a variation between 1.0 (a perfect cylinder) and 1.73 (a perfect double cone) at the cutoff points; the increase in values agrees with fat deposition in the central region of the body, that is, the closer to 1.73, the greater the central fat deposition.25‑27
According to Andrade et al.25, who studied the conicity
index in women and their association with hypertension and diabetes mellitus, women with high conicity index values had 72% and 75% more chances of having diabetes mellitus and hypertension, respectively.
Pitanga and Lessa27 suggested 1.18 as the best cutoff
point the conicity index in Brazilian females of fertile age, with sensitivity (73.39%) and specificity (61.15%) values, as well as area under the ROC (Receiver Operating Characteristic) curve of 0.75 (95% Confidence Interval ‑ 95% CI = 0.70‑0.80). The authors concluded that the conicity index can be used to discriminate cardiovascular risk even if the sensitivity and specificity values are not
very high. However, incorrect classifications are possible, which leads to a greater number of false‑positive results.27
In the present study, we used 1.33, the median value of the sample, as the cutoff point for the conicity index, since only 4% (n = 1) of the population had an index < 1.18. This parameter was associated with hypertension (p = 0.009) and diabetes (p = 0.006), which are risk factors for CVD. These findings corroborate those found by Ghosh et al.28, who compared the
association of obesity indicators and eating habits with metabolic risk factors for heart disease, and found an association between high conicity index with high blood glucose, TG and total cholesterol levels.
This fact can be explained because adipose tissue is influenced by several signals, such as insulin, cortisol and catecholamines, and, in response, it secretes other substances that act both locally and systemically, participating in several metabolic processes. Some of these secreted substances, such as leptin, adiponectin, Tumor Necrosis Factor Alpha (TNF‑a), among others, play a key role in insulin resistance, with abdominal fat having the greatest impact on this process. This fact suggests that this is a consistent indicator in the association of body fat distribution with cardiovascular risk factors.28,29
The literature also reports that there is a lower tendency in women to have areas of visceral adipose tissue when compared to men. However, they have greater areas of subcutaneous fat.12,19,29
The metabolic behavior of visceral fat differs from that of subcutaneous adipose tissue. The first is more subject to lipolysis, expressing a greater number of glucocorticoid receptors and is more sensitive to catecholamines, showing a lower expression of IRS‑1, which leads to a greater deterioration of insulin sensitivity and an increase in blood pressure and in the atherosclerotic process. For these reasons, VFV quantification is important, since the visceral fat deposition profile is more associated with CVD.29
Computed tomography, nuclear magnetic resonance and ultrasonography are the best methods of VFV quantification, but they have disadvantages, such as the high cost.30,31
Several studies have developed predictive equations to estimate VFV, which are easy to use and low cost. Most of them have been performed in populations that are very different from the Brazilian population and in male individuals.19,30‑32 The equation developed by Petribú et al.19
In the present study, VFV showed a high‑risk chance for diabetes mellitus and a slight chance for systemic hypertension. However, the sample had a mean of 96 cm2
of VFV, that is, it was below the established cutoff point.
Piernas Sánchez et al.31 obtained similar data in their
study, in which they applied a predictive equation to a population of women with a mean age of 39 ± 2 years and mean BMI of 29 ± 5 kg/m2. The authors observed
that, even though they were overweight, had high body fat percentage and high cardiovascular risk, according to the waist circumference, the women had subcutaneous fat, and not visceral fat, according to the VFV.
These authors draw attention to the fact that women tend to gain more subcutaneous fat in the abdominal than in the visceral region, which could justify the observed results.
When analyzing the BMI with risk factors for cardiovascular diseases, no association was observed with these parameters. The BMI is the most popular measure among health professionals to diagnose obesity because it is easy to apply. However, this index does not predict body fat distribution and does not distinguish lean mass from fat mass, and should be associated with other anthropometric parameters of body fat distribution to establish an increased risk of developing CVD, which is directly associated to central fat deposition.32,33
Regarding the measurement of abdominal circumference, the studied sample can be diagnosed with abdominal obesity and increased risk for CVD, with a mean of 110 ± 16.07 cm. However, this measure showed no association with the analyzed risk factors, highlighting only a slight risk of dyslipidemia. This finding can be explained by the fact that age is one of the important risk factors for CVD development19,20,30 and the
studied population had a mean age of 44.18 ± 14.42 years, suggesting that women who participated of this study did not yet have some of the assessed morbidities, since they were still fertile (10 to 49 years).34,35 During menopause,
changes in body fat distribution increase the risk of cardiovascular and metabolic diseases.35,36
In a study carried out in Africa with 169 postmenopausal women, abdominal circumference was correlated with systemic arterial hypertension. The results can be explained by the typical hormonal changes that occur in menopause, most prevalent at this age, when women are more vulnerable to metabolic diseases, such as dyslipidemia and systemic arterial hypertension, and which may increase the risk of CVD.36
Other studies have shown equivalent results. Moraes et al.37 found a high percentage of participants
with an increased risk for CVD. Silva38 found 91.6%
of females with altered abdominal circumference and BMI. Cristóvão et al.4 investigated women treated at the
Family Health Strategy units in the eastern region of São Paulo and observed that 57.4% of the participants had values >80 cm.
The multiplicity of anthropometric indicators to estimate obesity contributed to the selection of one of them that considered criteria such as the studied population, gender, age and, mainly, evidence based on population studies or clinical interventions. It is worth noting that tools are needed to take the necessary measurements, which must be always available and feasible. Through the results shown in this study, it is suggested that all the anthropometric indicators used showed different performances to differentiate cardiovascular risk in women.
This study has as limitations the small number of participants in the sample, due to resource limitations, non‑assessment of the participants’ ethnicity and patients who missed the consultations. Furthermore, the diagnosis of hypertension and/or diabetes was reported by the participants according to the knowledge of prior medical consultations.
Conclusion
Overweight and obesity were observed in the studied population, which showed greater accumulation of fat in the abdominal region, associated with diseases such as systemic arterial hypertension, diabetes mellitus and dyslipidemias. These facts are of concern, as they are associated with the risk of developing cardiovascular diseases, increased metabolic complications and other health problems.
Author contributions
1. Costa M, Valle J. Síndrome metabólica: prevalência e associação com doenças cardiovasculares em adultos. Demetra: Alimentação, Nutrição & Saúde. 2012;7(2):119‑32.
2. The Third Report of the National Cholesterol Education Program (NECP). Expert Panel on Detection. Evaluation, and treatment of high blood cholesterol in adults (Adult Treatment Panel III). JAMA. 2001;285(19):2486‑97. PMID: 11368702.
3. de Carvalho CA, Fonseca PC, Barbosa JB, Machado SP, dos Santos AM, da Silva AA. The association between cardiovascular risk factors and anthropometric obesity indicators in university students in São Luís in the State of Maranhão, Brazil. Cien Saude Colet. 2015;20(2):479‑90. doi:
10.1590/1413-81232015202.02342014.
4. Cristóvão MF, Sato APS, Fujimori E. Excesso de peso e obesidade abdominal em mulheres atendidas em unidade da estratégia saúde da família. Rev Esc Enferm. 2011;45(2):1667‑72. PMID: 22569652.
5. Ng M, Fleming T, Robinson M, Thomson B, Graetz N, Margono C, et al. Global, regional, and national prevalence of overweight and obesity in children and adults during 1980–2013: a systematic analysis for the Global Burden of Disease Study 2013. Lancet. 2014;384(9945):766‑81. doi:
10.1016/S0140-6736(14)60460-8. Erratum in: Lancet. 2014;384(9945):746.
6. Instituto Brasileiro de Geografia e Estatística (IBGE). Pesquisa de Orçamentos Familiares 2008‑2009. Antropometria e estado nutricional de crianças, adolescentes e adultos no Brasil. Rio de Janeiro; 2010.
7. Mendes PM, Zamberlan EC. Análise do consumo alimentar determinado
pela aquisição domiciliar no Brasil. Rev Univ Vale do Rio Verde (Três
Corações). 2013:7:336-45. doi: http://dx.doi.org /10.5892/860.
8. Castro AE, Dias FM, Diniz AS, Cabral PC. Risk and protection food consumption factors for chronic non‑communicable diseases and their association with body fat: a study of employees in the health area of a public university in Recife in the state of Pernambuco, Brazil. Cien Saude
Colet. 2014;19(5):1613-22. doi: 10.1590/1413-81232014195.06562013.
9. Carvalho CA, Fonseca PC, Barbosa JB, Machdo SP, Santos AM, Mourta da Silva AA. The association between cardiovascular risk factors and anthropometric obesity indicators in university students in São Luís in the State of Maranhão, Brazil. Cien Saude Colet. 2015;20(2):479‑90. doi:
10.1590/1413-81232015202.02342014
10. Alberti KG, Eckel RH, Grundy SM, Zimmet PZ, Cleeman JI, Donato KA, et. al; International Diabetes Federation Task Force on Epidemiology and Prevention; Hational Heart, Lung, and Blood Institute; American Heart Association; World Heart Federation; International Atherosclerosis Society; International Association for the Study of Obesity. Harmonizing the Metabolic Syndrome: a joint interim statement of the International Diabetes Federation Task Force on Epidemiology and Prevention; National Heart, Lung, and Blood Institute; American Heart Association; World Heart Federation; International Atherosclerosis Society; and International Association for the Study of Obesity. Circulation.
2009;120(16):1640-5. doi: 10.1161/CIRCULATIONAHA.109.192644.
11. Pitanga FJ, Lessa I. Razão cintura‑estatura como discriminador do risco coronariano de adultos. Rev Assoc Med Bras. 2006;52(5):157‑61. doi: S0104‑42302006000300016.
12. Petribú MM, Guimarães FJ, Cabral PC, Santos EM, Diniz AS, Arruda IC. Desenvolvimento e validação de equação preditiva da gordura visceral em mulheres jovens. Rev Bras Cineantropom Desempenho Hum.
2012(3):333-42. doi: 10.5007//1980-0037.2012v14n3p333.
13. Pitanga FJ, Lessa I. Indicadores antropométricos de obesidade como instrumento de triagem para risco coronariano elevado em adultos na cidade de Salvador ‑ Bahia. Arq Bras Cardiol. 1985(1):26‑31.
14. American Diabetes Association. Economic costs of diabetes in the USA
in 2012. Diabetes Care. 2014;36(4):1033-46. doi: 10.2337/dc12-2625.
15. Xavier HT, Izar MC, Faria Neto JR, Assad MH, Rocha VZ, Sposito AC, et al; Sociedade Brasileira de Cardiologia. [V Brazilian Guidelines on Dyslipidemias and Prevention of Atherosclerosis]. Arq Bras Cardiol.
2013;101(4 Suppl 1):1-20. doi: 105935/abc20135010.
16. Kavey RE, Daniels SR, Lauer RM, Atkins DL, Hayman LL, Taubert K; American Heart Association. American Heart Association guidelines for primary prevention of atherosclerotic cardiovascular disease beginning in childhood. J Pediatr. 2003;142(4):368‑72. PMID: 12712052.
17. Friedewald WT, Levi RI, Fredrickson DS. Estimation of the concentration of low density lipoproteins cholesterol in plasma without use of the ultracentrifuge. Cli Chem. 1972;18:499‑502. PMID: 4337382.
18. Sociedade Brasileira de Cardiologia; Sociedade Brasileira de Hipertensão; Sociedade Brasileira de Nefrologia. [VI Brazilian Guidelines on Hypertension]. Arq Bras Cardiol. 2010;95(1 Suppl):1‑51. Erratum in: Arq Bras Cardiol. 2010;95(4):553.
19. Petribú Mde M, Cabral PC, Diniz Ada S, Lira PI, Batista Filho M, Arruda IK. Prevalence of visceral obesity estimated by predictive equation in young women from Pernambuco. Arq. Bras. Cardiol. 2012; 98(4):307‑14. PMID: 22406989.
20. Sabino PC, Diniz AS, Arruda IK, Malaquias BF, Coelho PC, Sequeira LA, et al . Prevalência e fatores associados à obesidade abdominal em indivíduos na faixa etária de 25 a 59 anos do estado de Pernambuco, Brasil. Cad Saúde Pública [Internet]. 2013;29(2):313‑24.
21. Pimenta AM, Kac Gilberto, Gazzinelli A, Corrêa‑Oliveira R, Velásquez‑ Meléndez G. Association between central obesity, triglycerides and hypertension in a rural area in Brazil. Arq Bras Cardiol. 2008;90(6):386‑92.
doi: 10.1590/S0066-782X2008000600006
22. Ferreira VH, Silva AA. Prevalência e fatores associados à obesidade abdominal e ao excesso de peso em adultos maranhenses. Rev Bras
Epidemiol. 2010;13(3):400-12. doi: 10.1590/51415-790x2010000300004.
23. Ulguim F, Pollo DJ, Hedwig PO. Risco para doenças cardiovasculares, em trabalhadores de um hospital de ensino do RS: Análise a partir da circunferência de cintura e relação cintura‑quadril. Anais do Seminário Científico do Programa de Pós‑Graduação em Promoção da Saúde da UNISC. 2015;1(1).
24. Cantoni RE, Zanella MT, Ribeiro AB, Kohlmann Junior O. Visceral obesity, hypertension and cardio‑renal risk: a review. Arq
Bras Endocrinol Metab. 2005;49(2):196-204. doi:
10.1590/S0004-27302005000200005.
References
for intellectual content: Barroso TA, Marins LB, Alves R, Barroso SG, Rocha GS. Supervision / as the major investigador: Barroso TA, Marins LB, Barroso SG, Rocha GS.
Potential Conflict of Interest
No potential conflict of interest relevant to this article was reported.
Sources of Funding
There were no external funding sources for this study.
Study Association
25. Andrade MD, Freitas MC, Sakumoto AM, Pappiani C, Andrade SC, Vieira VL, et al . Association of the conicity index with diabetes and hypertension in Brazilian women. Arch Endocrinol Metab.
2016;60(5):436-42. doi: 10.1590/2359-3997000000187.
26. Cunha RS. O estabelecimento de pontos de corte no Índice de Conicidade, como proposta de um indicador antropométrico simples, para avaliação da obesidade e estimativa do risco coronariano elevado no Exército Brasileiro [tese]. Rio de Janeiro: Fundação Oswaldo Cruz; 2010.
27. Pitanga FJ, Lessa I. Anthropometric indexes of obesity as an instrument of screening for high coronary risk in adults in the city of Salvador
– Bahia. Arq Bras Cardiol. 2005;85(1):26-30. doi:
10.1590/S0066-782X2005001400006.
28. Ghosh A, Bose K, Das Chaudhuri AB. Association of food patterns, central obesity measures and metabolic risk factors for coronary heart disease (CHD) in middle aged Bengalee Hindu men, Calcutta, India. Asia Pac J Clin Nutr. 2003;12(2):166‑71. PMID: 12810406.
29. Ribeiro Filho FF, Mariosa LS, Ferreira SR, Zanella MT. [Visceral fat and metabolic syndrome: more than a simple association]. Arq Bras
Endocrinol Metabol. 2006;50(2):230-8. doi: /S0004-27302006000200009.
30. Hirooka M, Kumagi T, Kurose K, Nakanishi S, Michitaka K, Matsuura B, et al. A technique for the measurement of visceral fat by ultrasonograhy: comparison of measurements by ultrasonography and computed tomography. Int Med. 2005;44(8):794‑99. PMID: 16157975.
31. Piernas Sánchez CM, Morales Falo EM, Zamora Navarro S, Gauralet Aza M. Study and classification of the abdominal adiposity throughout the
application of the two‑dimensional predictive equation Gauralet et al, in the clinical practice. Nutr Hosp. 2010;25 (2): 270‑4. PMID: 20449537.
32. Almeida RT, Almeida MM, Araújo TM. Abdominal obesity and cardiovascular risk: performance of anthropometric indexes in women. Arq Bras Cardiol. 2009;92(5):375‑80. PMID: 19629289.
33. Medeiros CC, Ramos AT, Cardoso MA, França IS, Cardoso Ada S, Gonzaga NC. Insulin resistance and its association with metabolic syndrome components. Arq Bras Cardiol. 2011;97(5):380‑9. PMID: 21971636.
34. Lima A, Lustosa R, Daniele T, Uchôa F, Foschetti D, dos Santos A, et al.
A associação do índice de massa corpórea com a relação cintura/quadril
no comportamento da saúde de policiais militares do estado do Ceará. RBPFEX – Rev Bras Prescr Fisiol Exerc. 2016;10(59):330‑9.
35. Nogueira MA, Martins MC, Paz SM, Assis RC, Martins MP, Silva DM. Fatores de risco cardiovascular em mulheres atendidas em unidade de saúde. Conscientia e Saúde. 2009;8(3):459‑65.
36. Shidfar F, Alborzi F, Salehi M, Nojomi M. Association of waist circumference, body mass index and conicity index with cardiovascular risk factors in postmenopausal women. Cardiovasc J Afr. 2012;23(8):442‑
5. doi: 10.5830/CVJA-2012-038.
37. Moraes KD, Araujo AP, Santos AF, Barbosa JM, Martins ML. Correlação entre o índice de massa corporal e indicadores antropométricos de risco cardiovascular em mulheres. Rev Pesq Saúde. 2015;16(3):175‑81.
38. Silva ST. Fatores de risco cardiovasculares em usuários do hiperdia
de uma unidade básica de saúde do município de Criciúma/