Basic nutritional investigation
Prolonged maternal separation induces undernutrition and
systemic in
fl
ammation with disrupted hippocampal
development in mice
Italo Leite Figueiredo D.V.M., Ph.D.
a
, Priscila B. Frota M.D.
a
,
Davi G. da Cunha M.Sc.
a
, Ramon da Silva Raposo D.V.M., Ph.D.
h
,
Kildere M. Canuto M.Sc.
a
, Geanne M. de Andrade Ph.D.
b
, Nuno Sousa M.D., Ph.D.
c
,d
,
Sean R. Moore M.D., Ph.D.
i
, Gregory M. Anstead M.D.
f
,
Jacqueline I. Alvarez-Leite M.D., Ph.D.
e
, Richard L. Guerrant M.D.
g
,
Reinaldo B. Ori
a D.V.M., Ph.D.
a
,*
aLaboratory of the Biology of Tissue Healing, Ontogeny and Nutrition, Department of Morphology and Institute of Biomedicine, School of
Medicine, Federal University of Ceara, Ceara, Brazil
bDepartment of Physiology and Pharmacology and Institute of Biomedicine, School of Medicine, Federal University of Ceara, Ceara, Brazil cLife and Health Sciences Research Institute (ICVS), School of Health Sciences, University of Minho, Campus Gualtar, Braga, Portugal dICVS/3B’s - PT Government Associate Laboratory, Braga/Guimar~aes, Portugal
eDepartment of Biochemistry and Immunology, Institute of Biological Sciences, Federal University of Minas Gerais, Minas Gerais, Brazil fSouth Texas Veterans Hospital, San Antonio, TX, USA
gCenter for Global Health, Division of Infectious Diseases and International Health, University of Virginia, Charlottesville, VA, USA hExperimental Biology Core, Health Center, University of Fortaleza, Ceara, Brazil
iDivision of Gastroenterology, Hepatology and Nutrition, Department of Pediatrics, Cincinnati Children’s Hospital Medical Center, Cincinnati, OH,
USA
a r t i c l e
i n f o
Article history:
Received 14 September 2015 Accepted 21 February 2016
Keywords: Maternal separation Malnutrition Hippocampus Stereology Leptin IGF-1 Inflammation
a b s t r a c t
Objective:Prolonged maternal separation (PMS) in thefirst 2 wk of life has been associated with poor growth with lasting effects in brain structure and function. This study aimed to investigate whether PMS-induced undernutrition could cause systemic inflammation and changes in nutrition-related hormonal levels, affecting hippocampal structure and neurotransmission in C57BL/6J suckling mice.
Methods:This study assessed mouse growth parameters coupled with insulin-like growth factor-1 (IGF-1) serum levels. In addition, leptin, adiponectin, and corticosterone serum levels were measured following PMS. Hippocampal stereology and the amino acid levels were also assessed. Furthermore, we measured myelin basic protein and synapthophysin (SYN) expression in the overall brain tissue and hippocampal SYN immunolabeling. For behavioral tests, we analyzed the ontogeny of selected neonatal reflexes. PMS was induced by separating half the pups in each litter from their lactating dams for defined periods each day (4 h on day 1, 8 h on day 2, and 12 h thereafter). A total of 67 suckling pups were used in this study.
Results:PMS induced significant slowdown in weight gain and growth impairment. Significant reductions in serum leptin and IGF-1 levels were found following PMS. Total CA3 area and volume were reduced, specifically affecting the pyramidal layer in PMS mice. CA1 pyramidal layer area was also reduced. Overall hippocampal SYN immunolabeling was lower, especially in CA3field and
This work was supported in part by National Institutes of Health (NIH) research grant 5RO1HD053131, funded by the Eunice Kennedy Shriver National Institute of Child Health and Human Development and the NIH Office of Dietary Sup-plements, and Brazilian grants from CNPq and CAPES (Grant # RO1 HD053131). The authors would like to thank Dr. Patricia Foley for veterinarian technical support and Dr. Jose Paulo Andrade for the excellent comments and suggestions to improve this manuscript. N.S. contributed with the stereological studies. I.L.F.
and R.B.O. contributed with the behavioral studies. I.L.F., R.B.O., and R.L.G. contributed with the study design, study analysis, and manuscript preparation. G.A.M. and P.B.F. contributed with neurochemical brain analyses. J.I.A.L. and G.M.A. contributed with hormonal and CRP serum analyses. D.G.C., K.M.C., and R.S.R. contributed with animal experimentation and data collection.
*Corresponding author. Tel.: 55 08 5336 68239; fax:þ55 85 33668445. E-mail address:[email protected](R. B. Oria).
http://dx.doi.org/10.1016/j.nut.2016.02.016 0899-9007/Ó2016 Elsevier Inc. All rights reserved.
Contents lists available at
ScienceDirect
Nutrition
dentate gyrus. Furthermore, PMS reduced hippocampal aspartate, glutamate, and gamma-aminobutyric acid levels, as compared with unseparated controls.
Conclusion:Thesefindings suggest that PMS causes significant growth deficits and alterations in hippocampal morphology and neurotransmission.
Ó2016 Elsevier Inc. All rights reserved.
Introduction
Undernutrition during early postnatal life in children may be
associated with a signi
fi
cant slowdown in the rate of central
nervous system growth, with reduced brain weight, thinner
ce-rebral cortex, diminished numbers of neurons, de
fi
cient
myeli-nation, poor neuritic arborization, and several changes in the
microscopic features of dendritic spines such as reduction in
their width and number, and also cognition impairment
[1
–
4]
.
In rodents, undernutrition during early life may result in
similar reduced brain weight, reduced total cell number, reduced
and delayed myelination, loss of axon terminals in the cerebral
cortical neurons, and substantial de
fi
cits in the
synapse-to-neuron ratio in some brain regions, indicating a reduction in
the total synapse number
[5]
. Furthermore, recent evidence
in-dicates that long-lasting decrements in hippocampal plasticity
occur in mice subjected to early environmental stress, such as
maternal separation
[6,7]
. It has also been shown that
under-nutrition reduces peripheral circulating concentrations of
insulin-like growth factor (IGF-1)
[8]
.
Recently, a negative correlation has been found between
IGF-1 serum levels and chronic in
fl
ammation markers in stunted
Zimbabwean infants
[9]
. However, it remains elusive whether
systemic in
fl
ammation coupled with low IGF-1 levels, induced
by chronic undernutrition, could affect early hippocampal
development.
We investigated whether prolonged maternal
–
offspring
separation would cause systemic in
fl
ammation and poor growth
and assessed its effects on the hippocampus structure and amino
acid neurotransmitter levels in 2-wk-old mice, a time in which
the hippocampus relies on a strong postnatal plasticity
[10]
. To
relate systemic in
fl
ammation and nutritional status, we assessed
circulating levels of C-reactive protein and nutrition-related
hormones in the blood sera following undernutrition.
Materials and methods
Prolonged maternal separation model
C57BL/6J wild-type mice were purchased from Charles River laboratories. Either purchased pregnant mice or breeding pairs were used to obtain the study pups. Detectably pregnant mice (atw12 d pregnant) were then caged
individ-ually, with free access to standard rodent chow and water, and were monitored daily for delivery, termed Day (D) 0. Newborn litters were adjusted to 6 to 8 pups. Undernutrition was induced by separating half the pups in each litter from their lactating dams for defined periods each day (4 h on D4; 8 h on D5 and 12 h thereafter). Pups were separated between 8:00-10:00 am daily: All pups were breastfed and rested in their cages. In rare cases of encountering breastfeeding, pups were left undisturbed until breastfeeding wasfinalized. Litters with about the same male:female ratio were selected for the study entry. The separation protocol was not conducted in newborn mice (<4 d old) to guarantee more colostrum intake and to avoid perinatal mortality. A total of 67 pups were used in this study.
The maternal separation protocol was adapted from Calikoglu et al[8]. This method has the advantage of providing littermate controls and well-nourished pups to compare with undernourished ones. Weight and tail length were recorded daily until the pups were humanely killed immediately before the separation handling. A thermal pad was used to warm the pups during daily measurements (272C). Care was taken to assure the same level of handling for all experimental mice. Protocols from this study were previously approved by the
Institutional Animal Care and Use Committee at the University of Virginia and the University of Fortaleza (protocol #15005). All efforts were made to minimize the number of animals used and their suffering.
Nutritional status
To assess changes in growth and weight gain, daily tail length and body weight were analyzed, the former as a measure of linear skeletal growth. Experimental mice were monitored carefully by daily inspection of weight and tail length during the suckling time on days 4 to 14. Tail length was recorded by means of gently measuring the tail from the base to the tip, using a digital caliber and a card board (to the nearest 0.1 mm). All measurements were conducted before starting the procedures of daily mice separation. Care was taken to keep the same degree of handling during this process for all mice.
Neonatal reflex ontogeny
We assessed the ontogeny of selected neonatal reflexes along thefirst 2 wk of life, including cliff avoidance, surface righting, dorsal immobility, and swimming behavior[11,12]. The cliff avoidance reflex test is used to assess the integration of exteroceptive input (vibrissae) and locomotor output, providing information concerning motor skills as well as sensory function and/or processing[13,14]. The offspring is placed on a platform elevated 10 cm above a table top. The forelimbs and snout of the animals are positioned so that the edge of the platform passes just behind an imaginary line drawn between the eye orbits. Avoidance is scored by reflex latency between being placed on the edge and turning until it is parallel to the edge of the table (0¼no response, latency>60s; 1¼response<10s; 2¼ <5 s). The surface righting reflex is a measure of the capacity to return to a prone position. Pups were placed on their backs on a smooth surface, and the time required to right themselves to a position where the four limbs touches the surface was measured. The time is scored as follows: 2 ¼righting 1 s, 1¼righting>1 s and2 s, 0¼righting>2 s. The swimming behavior test is used to assess navigational and motor development. Pups are placed into a tank with water temperature maintained at 271C and swimming behavior was rated for direction (straight¼3, circling¼2,floating¼1) and head angle (ears out of water¼4, ears half out of water¼3, nose and top of head out of water¼2, and unable to hold head up¼1). Dorsal immobility (tonus immobility) was measured by suspending the mice by the back up to approximately 10 cm above aflat surface. The procedure is performed with the aid of a modified twissor, covered by rubber on its tip to avoid trauma. The dorsal immobility scores the latency time (in s) until the mouse moves to escape the grasping and is related to ventrolateral mesencephalic periaqueductal gray matter activity[15]. N¼8 for PMS and N¼6 unseparated mice were used for all behavioral tests done.
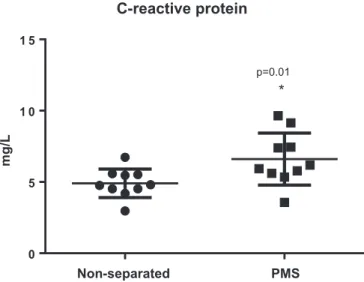
Systemic inflammation marker
To find whether prolonged maternal separation could cause systemic
inflammation, we measured serum C-reactive protein (N¼10 for both PMS and unseparated mice), which is a liver acute phase protein released during unspe-cific inflammatory responses. High sensitivity C reactive protein was assessed using a commercial kit (Labstest and Bioclin, Belo Horizonte, Brazil).
Nutrition and stress-related hormone serum levels
Tofind whether prolonged maternal separation could cause changes in
nutrition and stress-related hormones (leptin, adiponectin, and corticosterone), serum levels were assessed. On day 14, blood was drawn from some mice following decapitation (N¼10 per group). We also assessed IGF-1 serum levels as IGF-1 deficiency has been associated with stunting. These hormones were measured in serum samples using an enzyme-linked immunosorbent assay ac-cording to the manufacturer’s instructions (R&D Systems, Minneapolis, MN, USA).
Hippocampal structure and amino acid levels
Hippocampal stereology
A total of 14 male C57BL/6J mice were used in this experiment. Mice were divided into the following two groups: unseparated mice (n¼7) and prolonged I. L. Figueiredo et al. / Nutrition 32 (2016) 1019–1027
maternal separated mice (n¼7). Hippocampal tissue was collected on day 14 (the end point), following a transcardiac perfusion-fixation with Palay solution (containing 1% formaldehyde and 1% glutaraldehyde in 0.12M phosphate buffer at pH 7.2)[16]and immediately immersed in the same solution for stereological analyses.
After euthanasia the hippocampus was dissected from the brain and halved. Each hemi-hippocampus was systematically, uniformly, and randomly (SUR) selected[17,18]between left and right and weighed. Subsequently, the selected hemi-hippocampus (left or right) was manually straightened along its septo-temporal axis to diminish the anatomical organ curvature.
Subsequently, the straightened hippocampus was embedded in a 10% agar solution and exhaustively cut into a thin section (100mm-thick) followed by a thick section (1 mm-thick), alternately and using a vibratome (VT 1000 S, Leica Camera AG, Wetzlar, Germany)[19]. Sections were orthogonal to hippocampus’ long axis and a fraction (101) of those paired sections (thin and thick sections) was SUR selected. The average interval (K) between the section pairs was 400mm. Thin sections were collected onto glass slides, stained with 1% alcoholic toluidine blue solution, dehydrated in progressive ethanol concentrations, mounted under a cover slip with DPX (Fluka, Sverige, Sweden) and used not only to record the exact position of the studied layer in the hippocampus (i.e. mapping sections [19]) but also for the estimation of postembedding hippocampus and hippo-campal layer volumes using Cavalieri’s principle.
Thick sections were used to produce vertical, uniform, and random sections [20]. Thefirst of the thick sections were positioned onto a transparent plate of Silgard in the center of a circle with 36 (360) equidistant divisions along the perimeter. Next step, a random number between 0 and 36 was generated using a random number table (SUR selected)[19].
Subsequently, a transparent cutting guide containing lines was placed onto the thick section at the same selected angle. Finally, a razor blade was used to produce bars from the sections guided by the lines in the cutting guide.
Each bar containing hippocampus was rotated by 90around the vertical axis to the sections and allowed for vertical, uniform, and random sections parallel to the vertical axis. The bars from each section were then re-embedded in a 10% agar solution and exhaustively sectioned at 50mm-thick using a vibratome.
Thick sections (from bars) were collected onto glass slides, stained with an 1% alcoholic toluidine blue solution, dehydrated in progressive ethanol concentra-tions, mounted under a cover slip with DPX (Fluka), and were used to simulta-neously estimate the number of hippocampal neurons.
Section images were acquired using a Leica DMR Microscope coupled with a Digital Camera PLA622 (Pixellink) and stereological software New Cast Visio-pharm (version 2.16.1.0, Horsholm, Denmark). The area of the unbiased counting frame used was 5,000mm2[21]. Before starting the counting procedure, a z-axis distribution (calibration) was performed to know the neuron distribution throughout section thickness and establish the dissector height, which was 20mm. Section thickness was measured in every secondfield of view using the central point on the unbiased counting frame. The neuron nucleus was defined as the counting unit.
In this study the whole hippocampal structure, including the granular cell layer of dentate gyrus (DG) and the CA1 and CA3 pyramidal cell layers, was defined at all levels of sectioning according to the stereotaxic coordinates pub-lished elsewhere[22].
Hippocampus volume: V (HIP)
Hemi-hippocampus fresh weight was converted into volume to estimate tissue shrinkage. The formula used was V¼m/d, where V stands for volume, m for mass, and d for density. The specific density was 1.04 g/cm3[19]. We report in the Results the bilateral volume, which was elicited by multiplying V (HIP) by 2 since the left or right hemi-hippocampus was SUR sampled[18].
Volume of CA1, CA3, and dentate gyrus layers: V and V(HIPpost-emb)
The volume of the examined CA layer and the postembedding volume of the selected hemi-hippocampus were estimated using Cavalieri’s principle on the thin sections (100mm-thick). Then, V or V(HIPpost-emb)¼SP$ap$BA$K, where P is the number of test points hitting the tissue (region or the whole hippocampus; we have used on average 100 [hippocampal region] and 200 [HIP] points per animal), ap is the area associated with each test point, BA is the mean block advance (or mean section thickness¼100mm), and K is the distance between the sections sampled.
The error variance of Cavalieri’s estimator was estimated according to Nyengaard[23]. Therefore, the error variance of Cavalieri’s estimate was 0.04 for group 1, 0.04 for group 2, 0.03 for group 3, 0.03 for group 4, and 0.04 for group 5.
The volume shrinkage was then calculated as:
Volume shrinkage¼1 volume after: volume before, according to Hosseini-Sharifabad M, Nyengaard[19].
Numerical density CA1 and CA3 pyramidal cells and DG granule cells: NV
The optical dissector was used to estimate the numerical density of CA1 neurons in a given hemi-hippocampus. The formula for NVestimation is: NV:¼ tq =BA,PQ =h,aðpÞ,PPwhereSQ is the total number of particles counted
by dissectors, a is the counting frame area, p is the number of reference points per counting frame, andPPis the total number of reference points in each counting frame, which hit the reference volume, the studied hippocampal layer,tq is the Q -weighted mean section thickness measured, and BA is the mean block advance in the vibratome.
Total number of CA1, CA3 pyramidal cells, and DG granule cells: N
The total number of neurons was estimated by multiplying the numerical density of the studied hippocampal layer neurons by the volume of the respective layer. Therefore:
N:¼Nv,V
The bilateral number was obtained by simply multiplying N (neuron esti-mate.2) since the left or right hemi-hippocampus was SUR sampled[18].
The error variance of total neuron number (Cavalieri’s estimator [N]) was estimated as shown in Gundersen et al.[17]and Nyengaard[23].
Hippocampal amino acids levels
Since the hippocampal neurotransmission activity has been found to be disturbed by early maternal separation challenge[24], we assessed hippocampal amino acid levels following PMS. To avoid neurochemical changes due to anes-thesia, a subset of 19 mice (N¼10 for PMS and N¼9 for unseparated mice) were euthanized by decapitation to assess hippocampal amino acid levels. Dissected hippocampi were obtained from 14-d-old experimental pups and stored at 80C until analyzed. Analyses of amino acids (aspartate, glutamate, taurine, and gamma-aminobutyric acid [GABA]) were carried out from dissected hippocam-pus using a high-performance liquid chromatography apparatus (Shimadzu, Kyoto, Japan), and afluorimetric detection method. Briefly, frozen tissue speci-mens were homogenized in 0.1 M perchloric acid and sonicated for 30 s at 25C. After sonication, samples were centrifuged at 15 000 rpm for 15 min at 4C. Supernatants were removed andfiltered through a membrane (0.22mm, Merck Millipore, Billerica, MA, USA), and the amino acids were derivatized with mer-captoethanol and O-phthaldialdehyde. O-phthaldialdehyde derivatives were then separated on a C18 column (150 mm4.6 mm; Shimadzu) and after derivatization, amino acids were separated, using a mobile phase consisting of sodium phosphate buffer (50 mM, pH 5.5) and 20% methanol. The area of each peak was determined using Shimadzu software and compared with the peak area of the corresponding external standard. Amino acid concentrations were expressed asmmol/g of wet tissue.
Brain plasticity markers
To evaluate brain plasticity following PMS, we assessed the protein expres-sion of synaptophysyn (SYN), a synaptic vesicle protein and therefore a marker of synaptic activity and myelin basic protein (MBP), a constitutive protein associ-ated with the myelin sheet, in the overall brain tissue. In a subset of mice the entire brain was carefully dissected and immediately frozen in liquid nitrogen. Thawed specimens were pulverized with an electric homogenizer (ultra-Turrax homogenizer, Sigma-Aldrich, St. Louis, MO, USA) containing lysis buffer and then transferred to test tubes with protease inhibitor cocktail and centrifuged at 14 000 rpm. Supernatants were assayed using the bicinchoninic acid method, with the BCA Protein Assay Kit (Pierce, Rockford, IL, USA) to standardize 50mg of protein product. Samples were loaded into 12.5% denaturizing polyacryamide mini gels (Bio-Rad, Hercules, CA, USA), and gels were transferred overnight and then blotted onto nitrocellulose membranes. Membranes were incubated with either rabbit SYN or MBP antibodies (at dilution of 1:2000 and 1:500 respec-tively) for 1 h, rinsed three times in rinsing buffer, and then incubated in a sec-ondary antibody (1:5000) and rinsed as described. Each membrane was washed and exposed to Kodak X-Omat ARfilm (Kodak, Rochester, NY, USA). Stripped blots were later incubated with GAPDH antibodies as an internal control. In addition, we evaluated SYN immunolabeling in paraffin-embedded hippocampi of the experimental mice, as described elsewhere[25]. At leastfive hippocampus samples per group were used for both western blot and immunohistochemistry.
Statistical analysis
Unpaired Student t test was used to assess mean differences between groups; P < 0.05 was considered statistically significant. Data are represented as meanstandard error. Statistical analyses were performed using Graph Pad Prism 6.0 (La Jolla, CA, USA).
Results
Nutritional status
In this model, we have found signi
fi
cant slower linear growth
and poor weight gain after prolonged maternal separation
dur-ing suckldur-ing, as measured by daily tail length and weight gain
and as compared to nourished, non-separated controls,
(P
<
0.05) (
Fig. 1
). As expected, linear growth de
fi
cits appeared
later on PND 11, 1 wk after the onset of the maternal separation
protocol, indicating chronic under nutrition. Signi
fi
cant weight
faltering was found earlier on PND 6, 2 d after the onset of the
maternal separation protocol. On day 14, at the end point,
nourished mice displayed an average 1.6-fold higher body
weight gain versus challenged mice (
Fig. 1
). In addition, PMS
mice were three standard deviations below the mean tail length
of the unseparated nourished controls, characterizing a poor
linear length growth that is analogous to children stunting.
Neonatal re
fl
ex ontogeny
Prolonged maternal separation induced de
fi
cits in surface
righting and dorsal immobility re
fl
exes, which were seen in the
end of the second week of life (on D 14;
P
<
0.05) (
Fig. 2
). No
signi
fi
cant differences were found regarding swimming behavior
and cliff avoidance over the
fi
rst 2 wk.
CRP serum levels
Prolonged maternal separation caused signi
fi
cant increase in
CRP serum levels (6.6
1.8 mg/L, n
¼
10) when compared with
the well-nourished counterparts (4.9
1.0 mg/L, n
¼
10;
P
¼
0.010) (
Fig. 3
).
Nutrition and stress related hormones
We found signi
fi
cant reductions in leptin and IGF-1 serum
levels following prolonged maternal separation when compared
with the non-separated controls (
Fig. 4
). No signi
fi
cant
differ-ences were found with corticosterone (79.7
35.9 ng/L, n
¼
5
versus 152.3
85.5, n
¼
8,
P
¼
0.1) and adiponectin
(8176.2
0.7 ng/L, n
¼
5 versus 8202.7
1996.8, n
¼
8,
P
¼
0.9)
for the non-separated and PMS-groups, respectively.
0
2
4
6
8
10
12
14
0
200
400
600
800
Weight and Tail Length
Age (days)
% of the initial measurement
Weight
Non-separated
PMS
Non-separated
PMS
Tail Length
* * * *
* * * * *
# # # #
Fig. 1.Relative weight and tail length gain from experimental mice during timed-prolonged maternal separation (PMS) (N ¼ 16) and respective non-separated controls (N¼10). Curves are presented as percentage of initial weight at post-natal day 1. Results are expressed in mean SEM and were analyzed by un-paired Student t test.*P<0.05 vs non-separated controls. Results are expressed in meanSEM and were analyzed by unpaired Student t test.#P<0.05 vs separated
controls.
A
B
5
6
7
8
9
10
11
12
13
14
15
0.0
0.5
1.0
1.5
2.0
2.5
Non-separated PMS
*
Surface Righting
Age (days)
Age (days)
Score
5
6
7
8
9
10
11
12
13
14
15
0
1 0
2 0
3 0
4 0
5 0
6 0
Non-separated PMS
*
Dorsal Immobility
Responce Latency (sec)
Fig. 2.Behavioral tests (A: surface righting) and (B: dorsal immobility) conducted in thefirst two weeks of life in the non-separated (N¼6) and prolonged maternal separated (PMS) (N¼8) groups. For the surface righting testing, results are shown in scores. The performed time was scored as follows: 2-righting1 sec; 1-righting
>1, and2 sec; 0->2 sec. For the dorsal immobility test, data are shown as latency mean time in seconds. The results are shown as meanSEM and were analyzed by unpaired Student t test.*P<0.05 vs non-separated controls.
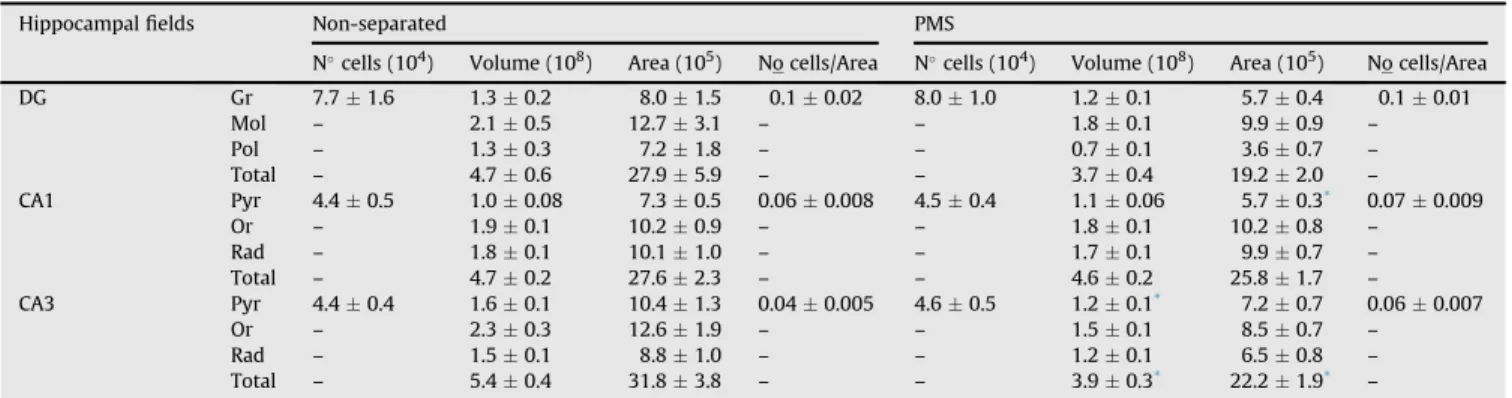
Hippocampal stereology
The hemi-hippocampus shrinkage volume (%) was estimated
to be (mean
SD) 4.75
1.22 (group 1); 5.56
1.52 (group 2);
4.16
1.21 (group 3); 5.05
1.17 (group 4); and 5.75
1.12
(group 5). No correction for global shrinkage was performed
since intergroup differences were not statistically signi
fi
cant
(P
¼
0.13). The malnutrition challenge reduced the total volume
and area of the CA3 hippocampal
fi
eld and CA3 pyramidal layer
volume. In addition, we found reduced CA1 pyramidal layer area.
No other signi
fi
cant changes were found regarding the
hippo-campal CA1 and CA3
fi
elds and DG between experimental groups
(
Table 1
).
Hippocampal amino acid levels
The amino acid assessment in the hippocampus using the
high-performance liquid chromatography method showed that
PMS induced signi
fi
cant decreased concentrations (mmol/g
tis-sue) of aspartate (3944.6
317.1, n
¼
9 versus 636.5
33.3,
n
¼
10), glutamate (730.2
16.6, n
¼
9 versus 584.1
47.1,
n
¼
10), glycine (155.5
3.9, n
¼
9 versus 135.9
4.7, n
¼
10),
and GABA (598.9
10.9, n
¼
9 versus 246.7
27.9, n
¼
10)
(P
<
0.05), compared to the unseparated control group (
Fig. 5
).
SYN and MBP
We could not
fi
nd signi
fi
cant different expression of either
SYN or MBP in the overall brain tissue from experimental mice.
Qualitatively there was a more conspicuous and stronger SYN
immunolabeling in overall hippocampus from the unseparated
compared with the PMS-mice, particularly in the DG and CA3
regions (
Fig. 6
).
Discussion
In our study, we have used a PMS model characterized by
repetitive and long-term maternal
–
offspring separation in the
fi
rst 2 wk of life to induce moderate-to-severe under nutrition.
The
fi
rst 2 wk of life in mice is a key time window for brain
development, especially in the cerebellum, cerebral cortex, and
the hippocampus
[10]
. In this model, PMS mice were found to
have a poor linear growth (analogous to human stunting) and
were profoundly underweight (below two standard deviations of
the control mean). Indeed, neonatal PMS induced a chronic
malnutrition status.
In addition, surface righting and dorsal immobility were
affected by maternal separation only in the end of the
experi-mental protocol (day 14), which may indicate more cumulative
adverse effects of maternal separation. Delays in the
develop-ment of some neonatal re
fl
exes were found by Ladd et al. (2010)
in a study of malnutrition using larger litters in the second week
of postnatal life
[25]
. In the same study, the authors also reported
a bene
fi
cial effect of zinc supplementation (500 mg/L in the
drinking water for animals) in improving some of the parameters
[25]
.
The surface righting re
fl
ex involves the vestibular-cerebellar
neural pathways
[26]
, suggesting that the SMP affects
nega-tively the cerebellum development, which has a strong postnatal
development component. Interestingly, a transient increase in
some markers of cerebellar myelination and neurotrophic factors
was found after a 3-h maternal separation compared to
unsep-arated controls, which may indicate a compensatory response to
rescue normal cerebellar development
[27]
. Our current study
using a chronic maternal deprivation model has not assessed
morphological changes in the cerebellum that may have
contributed to delays in the acquisition of neonatal re
fl
exes. In
support of our
fi
ndings, Zhang et al. also found de
fi
cits in surface
righting in the mouse offspring of food-restricted mothers
[28]
.
The dorsal immobility response (or tonic immobility)
in-volves the periaqueductal gray matter (PGM) of the midbrain.
This structure has a role in pain modulation and defensive
behavior and the
fi
ne motor output for basic survival
[28]
. The
PGM keeps anatomical and functional connections with
Non-separated
PMS
0
5
1 0
1 5
C-reactive protein
mg/L
*
p=0.01
Fig. 3.C-reactive protein serum levels of experimental mice following prolonged maternal separation (PMS) (N¼ 10) and the respective unseparated-controls (N ¼ 10) (on day 14). Data are expressed in mg/L. Results are shown as meanSEM and were analyzed by unpaired Student t test.*P<0.05 vs non-separated controls.
0
100
200
300
*
ng/mL
IGF-1
IGF-1 and Leptin
Leptin
#
* p = 0.012 for Unpaired t test # p = 0.040 for Unpaired t test
Fig. 4.IGF-1 and leptin serum levels of experimental mice following prolonged maternal separation and the respective unseparated-controls (on day 14). At least five mice were used for these analyses. Data are expressed in ng/mL. Results are shown as meanSEM and were analyzed by unpaired Student t test.*,#P<0.05 vs
non-separated controls.
structures such as the thalamus, hypothalamus, and amygdala
[29,30]
. However, impairment of PGM with involvement of
hippocampus due to chronic malnutrition has not yet been
reported.
Barros and colleagues adapted a low protein and high
car-bohydrate diet to mimic the dietary characteristics of endemic
malnutrition regions of Brazil. They found delays in the
matu-ration of most of the locomotion-related neonatal re
fl
exes tested
in the
fi
rst 3 wk of life in offspring breastfed by undernourished
dams
[31]
.
Another important
fi
nding of this study was a noticeable
reduction in hippocampal SYN immunostaining of
PMS-challenged mice, especially in the CA3 and DG regions.
Howev-er, we could not
fi
nd differences in SYN and MBP in the total
brain tissue. These
fi
ndings suggest that the hippocampus is
highly sensitive to the PMS-induced effects. Wistar rats
sepa-rated from dams for 4 h daily for 18 d in the
fi
rst 2 wk of life did
not show hippocampal CA1 and CA3 remarkable increase in SYN
expression on days 25 to 60 compared to the unseparated
con-trols and did not show the same degree of needed pruning later
on postnatal day 100 in the same hippocampal
fi
elds
[32]
. The
hippocampal layers are the following: alveus, stratum oriens,
stratum pyramidale (with pyramidal cell bodies), stratum
radi-atum, and stratum lacunosum-moleculare in the hippocampal
proper (in the cornus amnonis
fi
elds); in the dentate gyrus area:
stratum moleculare, stratum granulosum (granular cell bodies),
and the hilus of the fascia dentata
[33]
.
The hippocampus is a brain region that seems to be
particu-larly vulnerable to the effects of stress due to a high density of
glucocorticoid receptors and susceptibility to epigenetic
modu-lation
[34]
. Early exposure to stress or corticosteroids can cause
hippocampus remodeling (or atrophy)
[35]
, effects which may be
associated with a reduction of the dendritic arborization,
increased vulnerability to a subsequent insult, and neurogenesis
disorders in adulthood
[36]
.
Albeit not reaching statistical signi
fi
cance, corticosterone
serum levels were higher after PMS compared to controls.
Corticosterone serum levels were measured on postnatal day 14,
10 d after the onset of maternal separation. At the end of the
second postnatal week, mice usually have access to mixed
feeding and are not so dependent of breast milk. Perhaps during
early maternal separation, when the mice are highly dependent
on maternal care, corticosterone levels would be more affected.
Thus, we cannot rule out the possibility that early changes in
corticosterone levels have in
fl
uenced hippocampal alterations
seen in our study. Hsu et al, after performing handling and
maternal separation in Sprague
–
Dawley rats on postnatal days 9
(for 30 min) and 10 (for 6 h), did not
fi
nd difference in
cortico-sterone levels compared to unseparated pups on postnatal day
10. Nonetheless, these authors identi
fi
ed later alterations in
GABA neurotransmission into adulthood
[37]
.
The large intragroup variation in corticosterone levels in our
study among separated suckling mice may be a result of a greater
competition for breastmilk compared with nourished
counter-parts. We speculate that among the undernourished, separated
mice, the dominant pups would have slightly more access to the
breastmilk and therefore be less stressed while returned to the
dams as opposed to the non-dominant siblings, an effect that
may partly explain these variations.
Early neonatal stress may induce lasting hippocampal
changes that may go into adulthood. Signi
fi
cant reductions in
Table 1
Hippocampal stereological estimations
Hippocampalfields Non-separated PMS
Ncells (104) Volume (108) Area (105) No cells/Area Ncells (104) Volume (108) Area (105) No cells/Area
DG Gr 7.71.6 1.30.2 8.01.5 0.10.02 8.01.0 1.20.1 5.70.4 0.10.01
Mol – 2.10.5 12.73.1 – – 1.80.1 9.90.9 –
Pol – 1.30.3 7.21.8 – – 0.70.1 3.60.7 –
Total – 4.70.6 27.95.9 – – 3.70.4 19.22.0 –
CA1 Pyr 4.40.5 1.00.08 7.30.5 0.060.008 4.50.4 1.10.06 5.70.3* 0.070.009
Or – 1.90.1 10.20.9 – – 1.80.1 10.20.8 –
Rad – 1.80.1 10.11.0 – – 1.70.1 9.90.7 –
Total – 4.70.2 27.62.3 – – 4.60.2 25.81.7 –
CA3 Pyr 4.40.4 1.60.1 10.41.3 0.040.005 4.60.5 1.20.1* 7.20.7 0.060.007
Or – 2.30.3 12.61.9 – – 1.50.1 8.50.7 –
Rad – 1.50.1 8.81.0 – – 1.20.1 6.50.8 –
Total – 5.40.4 31.83.8 – – 3.90.3* 22.21.9* –
CA1, cornus ammonis 1; CA3, cornus ammonis 3; DG, dentate gyrus; Gr, granular cells; Or, oriens layer; PMS, prolonged maternal separated mice; Mol, molecular layer; Pol, polymorphic layer; Pyr, pyramidal cell; Rad,stratum radiatumlayer; Total, sum of each of the hyppocampalfield layers
N¼7 for non-separated and PMS groups.Data are expressed as meanstandard error of the mean (SEM) *P<0.05 versus the non-separated group by unpaired Student t test.
Asp
Glu
Gly
Taur
GABA
0
1000
2000
3000
4000
PMS
Non-separated
Hippocampal amino acids
*
* p<0.001 by Student
T
test
*
*
mol/g of tissue
*
μμ
Fig. 5. Hippocampal amino acid levels of experimental mice following prolonged maternal separation (PMS) (N ¼ 10) and the respective unseparated-controls (N¼9), detect by high-performance liquid chromatography on day 14. Data are expressed inmmol/g of tissue. Results are shown as meanSEM and were analyzed by unpaired Student t test.*P<0.05 vs non-separated controls.
hippocampal volume (71%) and size of pyramidal (62%) and
granular (60%) cell layers of the adult hippocampus have been
found after early-life maternal deprivation
[38]
.
Oreland and colleagues did not
fi
nd signi
fi
cant differences in
the volumes of CA1, CA2, and CA3
fi
elds or DG of the
hippo-campus in 3-wk-old rats separated either by 15 min or 6 h daily
during the
fi
rst 21 d of postnatal life. However, they found a
reduction in numerical density of neurons in DG and CA3 in the 6
h
–
separation group
[39]
. Studies using other models of protein
deprivation both prenatally
[40]
and postnatally
[41]
did
fi
nd
decreases in the number of CA1 pyramidal cells and irreversible
loss of hippocampal cholinergic and GABAergic interneurons,
respectively. In an earlier study from our group,
breastmilk-deprived suckling pups raised in large litters did not show
dif-ferences in CA1 numerical neuronal density, area, and volume.
However, an increase in the volume of CA1 pyramidal neurons
was found in the undernourished group, suggesting cell
degen-eration
[25]
.
Despite no changes in the total cell number in the
hippo-campal regions, this study found reductions in the CA1
pyrami-dal cell layer area and CA3 area and volume. CA1 and CA3
synaptic neuron connections are very important for learning as a
key piece of the trisynaptic circuitry of the hippocampus
[42]
.
Presumably, factors such as loss of neuronal and glial extensions
may have contributed to these volume/area changes, regardless
of cell numbers.
The amino acids glutamate,
g-aminobutyric acid, glycine,
aspartate, and taurine are neurotransmitters and
neuro-modulators in the central nervous system
[43]
. Glutamate is
critical for hippocampal circuitry development and synapses and
an important mediator of emotional and cognitive behaviors
[44]
. Gamma aminobutyric acid has been described as an
excit-atory neurotransmitter in the neonatal brain, playing a role in
synaptic plasticity in the hippocampus circuits
[45]
, and may
have a protective role to hippocampal pyramidal neurons against
hypoxia-ischemia injury in neonatal mice
[46]
.
Pickering et al have found diminished hippocampal RNA
expression of NMDA NR2B, AMPA GluR1, and GluR2 25 weeks
after 6 h daily maternal separation during postnatal days 1 to 21
[47]
. In our study, we found decreased hippocampal levels of
glutamate in the PMS group compared to the controls at 14 d of
age.
Similar to our
fi
ndings, Ladd et al. found lower hippocampal
levels of aspartate and glycine in the undernourished mice
[25]
; however, these effects were not reversed by glutamine
and zinc treatment. In addition, Rotta et al., after inducing
protein malnutrition in young rats by restricting the protein
content of the mother
’
s diet during pregnancy and lactation,
have found reduced Na
þ-independent glutamate binding in
the cell membranes of the cerebral cortex and low vesicular
uptake
[48]
.
Prolonged maternal separation diminished leptin and IGF-1
serum levels in 14-d-old mice, an effect also associated with
systemic in
fl
ammation and similar to what was found in
Zim-babwean stunted children
[9]
. Reduced circulating leptin and
increased corticosterone levels were found after neonatal
maternal deprivation on postnatal days 9 and 10 (a critical period
for hypothalamus development) by 24-h separation
[49]
.
Viveros et al. have found increased hypothalamic leptin
re-ceptor mRNA levels 24 h after maternal separation (on day 9) in
both genders, levels that were normalized in females 12 h later
but not in males. Hypothalamic IGF-1 mRNA levels were found to
be signi
fi
cantly lower after 24 h of maternal separation
[49]
. In
another study by the same group, 24-h maternal-separated rats
(on day 9) and euthanized rats on days 13, 35, and 75 showed
signi
fi
cant reduced leptin plasma levels only on day 75.
Adipo-nectin levels were also reduced by day 75 in females. They did
not
fi
nd changes in hypothalamic levels of IGF-1 and leptin
re-ceptor mRNAs
[50]
. Interestingly, in the hypothalamus, a
satu-rable leptin-transporter takes leptin more rapidly in lower serum
leptin levels. Conversely, the hippocampus takes up leptin more
rapidly at higher serum leptin levels
[51]
, effects that may
explain why no difference in hypothalamic leptin mRNA levels
was found by Viveros (2010) and may in part explain the
struc-tural and functional alterations seen in the hippocampus in our
study due to lower PMS-induced serum leptin levels. Leptin has
been recognized to be important for hippocampal synaptic
function
[52]
. Of note, leptin modulates GABA-ergic transmission
in developing CA3 pyramidal cells of newborn rats
[53]
, a
fi
eld of
the hippocampus where we found poor synaptophysin
immu-nolabeling in PMS-challenged mice.
Peak postnatal leptin occurs around the tenth day of life.
Thus, episodes of maternal separation may break this
develop-ment signal
[54]
. Postnatal leptin has emerged as a critical factor
affecting the maturation of the pituitary-hypothalamic axis and
possibly of other brain regions
[24,55]
. In addition, leptin may
in
fl
uence in
fl
ammatory responses
[56]
.
In our study, increased CRP serum levels (a marker of
sys-temic in
fl
ammation
[57]
) after PMS suggests chronic in
fl
amma-tion, which may be related to the intestinal barrier disruption
and continuous (and low grade) gut-to-blood bacterial
trans-location due to neonatal stress
[58]
. Undernutrition in the
fi
rst
2 wk of postnatal life has been associated with intestinal
in
fl
ammation in mice
[25]
and may predispose and potentiate
early-life enteric infections
[59,60]
. Parental separation may
induce a lasting in
fl
ammation going into adulthood
[61]
.
Recently, Preidis et al after inducing undernutrition in mice with
a similar model of timed maternal separation found urinary
metabolites related with chronic in
fl
ammation and liver
dysfunction
[62]
.
Low leptin, IGF-1 levels, and body weight have been found in
marasmic children
[63]
. Prendergast et al. (2014) found that
Zimbabwean stunted children (6 wk to 12 mo of age) show
increased CRP and AGP and reduced IGF-1 and insulin-like growth
factor binding protein-3 plasma levels. In addition, stunted
chil-dren (aged 3
–
12 mo) showed high levels of intestinal fatty
acid-binding protein (a marker of intestinal cell shedding and barrier
disruption) in children, supporting this relationship of intestinal
barrier breakdown, in
fl
ammation, and poor IGF-1 responses. One
recent clinical trial has documented improvements in linear
growth and IGF-1 levels with reduced CRP circulating levels in
children living in an endemic area of enteric infections following
vitamin A and zinc supplementation
[64]
, suggesting an
impor-tant role of systemic in
fl
ammation regulating IGF-1-growth
ef-fects and potential bene
fi
ts with nutritional interventions.
The prolonged undernutrition with restriction of
breast-feeding (without access to food and water), especially during the
12-h maternal separation protocol (day 6 to day 14), may have
caused transitory severe starvation and therefore been a strong
driver of nutrient de
fi
ciency to the developing hippocampus.
Caution is needed, though, to extrapolate our
fi
ndings of this
mouse model to humans, who are exposed to very complex
environmental and maternal in
fl
uences.
Conclusions
To the best of our knowledge, this is the
fi
rst study associating
maternal separation-induced undernutrition, which has led to
systemic in
fl
ammation, with de
fi
cits in IGF-1 levels and growth,
and hippocampal alterations. This model may be helpful to
further study the gut
–
brain axis associated with environmental
enteropathy in areas of endemic malnutrition and enteric
in-fections in the developing world and the potential use of
nutri-tional interventions to ameliorate these effects. Intervennutri-tional
studies with key brain trophic micronutrients (such as zinc
supplementation) are now being planned by our laboratory to
redirect the trajectory of normal hippocampal development in
relationship with the intestinal microbiota (a recognized factor
in
fl
uencing hippocampal neurotransmission
[65]
) to
maternal-separated mice. Our group has demonstrated the bene
fi
ts of
zinc supplementation to ameliorate cognitive outcomes in
chil-dren at risk for malnutrition and enteric diseases
[64,65]
.
References
[1] Pollitt E. Developmental sequel from early nutritional deficiencies: conclusive and probability judgements. J Nutr 2000;130:350S–3S. [2] Ivanovic DM, Leiva BP, Perez HT, Almagia AF, Toro TD, Urrutia M, et al.
Nutritional status, brain development and scholastic achievement of Chil-ean high-school graduates from high and low intellectual quotient and socio-economic status. Br J Nutr 2002;87:81–92.
[3] Ivanovic DM, Leiva BP, Perez HT, Inzunza NB, Almagia AF, Toro TD, et al. Long-term effects of severe undernutrition during thefirst year of life on brain development and learning in Chilean high-school graduates. Nutri-tion 2000;16:1056–63.
[4] Benitez-Bribiesca L. De la Rosa-Alvarez I, Mansilla-Olivares A. Dendritic spine pathology in infants with severe protein-calorie malnutrition. Pedi-atrics 1999;104:e21.
[5] Beas-Zarate C, Ortuno-Sahagun D, Angel Meza AR, Feria-Velasco A. Effect of a corn diet during development on [3H]-spiperone binding in the brain of rats at the perinatal stage. Comp Biochem Physiol A Physiol 1995;112:161–6. [6] Mirescu C, Peters JD, Gould E. Early life experience alters response of adult
neurogenesis to stress. Nat Neurosci 2004;7:841–6.
[7] Nishi M, Horii-Hayashi N, Sasagawa T. Effects of early life adverse experi-ences on the brain: implications from maternal separation models in ro-dents. Front Neurosci 2014;8:166.
[8] Calikoglu A, Karayal A, D’Ercole A. Nutritional regulation of IGF-I expression during brain development in mice. Pediatr Res 2001;49:197–202. [9] Prendergast AJ, Rukobo S, Chasekwa B, Mutasa K, Ntozini R, Mbuya MN,
et al. Stunting is characterized by chronic inflammation in Zimbabwean infants. PLoS One 2014;9:e86928.
[10] Yu DX, Marchetto MC, Gage FH. How to make a hippocampal dentate gyrus granule neuron. Development 2014;141:2366–75.
[11] Rotstein M, Bassan H, Kariv N, Speiser Z, Harel S, Gozes I. NAP enhances neurodevelopment of newborn apolipoprotein E-deficient mice subjected to hypoxia. J Pharmacol Exp Ther 2006;319:332–9.
[12] Tanaka T. Effects of litter size on behavioral development in mice. Reprod Toxicol 1998;12:613–7.
[13] Pantaleoni GC, Fanini D, Sponta AM, Palumbo G, Giorgi R, Adams PM. Ef-fects of maternal exposure to polychlorobiphenyls (PCBs) on F1 generation behavior in the rat. Fundam Appl Toxicol 1988;11:440–9.
[14] Palanza P, Parmigiani S, vom Saal FS. Effects of prenatal exposure to low doses of diethylstilbestrol, o,p’DDT, and methoxychlor on postnatal growth and neurobehavioral development in male and female mice. Horm Behav 2001;40:252–65.
[15] Monassi CR, Leite-Panissi CR, Menescal-de-Oliveira L. Ventrolateral peri-aqueductal gray matter and the control of tonic immobility. Brain Res Bull 1999;50:201–8.
[16] Andrade JP, Madeira MD, Paula-Barbosa MM. Effects of long-term malnu-trition and rehabilitation on the hippocampal formation of the adult rat. A morphometric study. J Anat 1995;187:379–93.
[17] Gundersen HJ, Jensen EB, Kieu K, Nielsen J. The efficiency of systematic sampling in stereology–reconsidered. J Microsc 1999;193:199–211. [18]Chen F, Madsen TM, Wegener G, Nyengaard JR. Changes in rat hippocampal
CA1 synapses following imipramine treatment. Hippocampus 2008;18:631–9. [19] Hosseini-Sharifabad M, Nyengaard JR. Design-based estimation of neuronal number and individual neuronal volume in the rat hippocampus. J Neurosci Methods 2007;162:206–14.
[20] Baddeley AJ, Gundersen HJ, Cruz-Orive LM. Estimation of surface area from vertical sections. J Microsc 1986;142:259–76.
[21] Gundersen HJ. Estimators of the number of objects per area unbiased by edge effects. Microsc Acta 1978;81:107–17.
[22] Paxinos G, Franklin KBJ. The mouse brain in stereotaxic coordinates. San Diego: Academic Press; 2001.
[23] Nyengaard JR. Stereologic methods and their application in kidney research. J Am Soc Nephrol 1999;10:1100–23.
[24] Marco EM, Llorente R, Lopez-Gallardo M, Mel V, Llorente-Berzal A, Prada C, et al. The maternal deprivation animal model revisited. Neurosci Biobehav Rev 2015;51:151–63.
[25] Ladd FV, Ladd AA, Ribeiro AA, Costa SB, Coutinho BP, Feitosa GA, et al. Zinc and glutamine improve brain development in suckling mice subjected to early postnatal malnutrition. Nutrition 2010;26:662–70.
[26] Zhang Y, Li N, Yang J, Zhang T, Yang Z. Effects of maternal food restriction on physical growth and neurobehavior in newborn Wistar rats. Brain Res Bull 2010;83:1–8.
[27] Miki T, Yokoyama T, Kusaka T, Suzuki S, Ohta K, Warita K, et al. Early postnatal repeated maternal deprivation causes a transient increase in OMpg and BDNF in rat cerebellum suggesting precocious myelination. J Neurol Sci 2014;336:62–7.
[28] Subramanian HH, Holstege G. The midbrain periaqueductal gray changes the eupneic respiratory rhythm into a breathing pattern necessary for survival of the individual and of the species. Prog Brain Res 2014;212:351–84. [29] Vianna DM, Brandao ML. Anatomical connections of the periaqueductal
gray: specific neural substrates for different kinds of fear. Braz J Med Biol Res 2003;36:557–66.
[30] Monassi CR, Hoffmann A, Menescal-de-Oliveira L. Involvement of the cholinergic system and periaqueductal gray matter in the modulation of tonic immobility in the guinea pig. Physiol Behav 1997;62:53–9. [31] Barros KM, Manhaes-De-Castro R, Lopes-De-Souza S, Matos RJ, Deiro TC,
Cabral-Filho JE, et al. A regional model (Northeastern Brazil) of induced mal-nutrition delays ontogeny of reflexes and locomotor activity in rats. Nutr Neurosci 2006;9:99–104.
[32] Andersen SL, Teicher MH. Delayed effects of early stress on hippocampal development. Neuropsychopharmacology 2004;29:1988–93.
[33] Lopes da Silva FH, Arnolds DE. Physiology of the hippocampus and related structures. Annu Rev Physiol 1978;40:185–216.
[34] McEwen BS, Nasca C, Gray JD. Stress effects on neuronal structure: Hip-pocampus, amygdala and prefrontal cortex. Neuropsychopharmacology 2016;41:3–23.
[35] Sapolsky RM. Glucocorticoids and hippocampal atrophy in neuropsychi-atric disorders. Arch Gen Psychiatry 2000;57:925–35.
[36] Gould E, Tanapat P, Rydel T, Hastings N. Regulation of hippocampal neu-rogenesis in adulthood. Biol Psychiatry 2000;48:715–20.
[37] Hsu FC, Zhang GJ, Raol YS, Valentino RJ, Coulter DA, Brooks-Kayal AR. Repeated neonatal handling with maternal separation permanently alters hippocampal GABAA receptors and behavioral stress responses. Proc Natl Acad Sci U S A 2003;100:12213–8.
[38] Aksic M, Radonjic NV, Aleksic D, Jevtic G, Markovic B, Petronijevic N, et al. Long-term effects of the maternal deprivation on the volume and number I. L. Figueiredo et al. / Nutrition 32 (2016) 1019–1027
of neurons in the rat neocortex and hippocampus. Acta Neurobiol Exp (Wars ) 2013;73:394–403.
[39] Oreland S, Nylander I, Pickering C. Prolonged maternal separation de-creases granule cell number in the dentate gyrus of 3-week-old male rats. Int J Dev Neurosci 2010;28:139–44.
[40] Lister JP, Tonkiss J, Blatt GJ, Kemper TL, DeBassio WA, Galler JR, et al. Asymmetry of neuron numbers in the hippocampal formation of prenatally malnourished and normally nourished rats: a stereological investigation. Hippocampus 2006;16:946–58.
[41] Andrade JP, Paula-Barbosa MM. Protein malnutrition alters the cholinergic and GABAergic systems of the hippocampal formation of the adult rat: an immunocytochemical study. Neurosci Lett 1996;211:211–5.
[42] Gruart A, Delgado-Garcia JM. Activity-dependent changes of the hippo-campal CA3-CA1 synapse during the acquisition of associative learning in conscious mice. Genes Brain Behav 2007;6:S24–31.
[43] Perry M, Li Q, Kennedy RT. Review of recent advances in analytical techniques for the determination of neurotransmitters. Anal Chim Acta 2009;653:1–22. [44]Molnar E, Pickard L, Duckworth JK. Developmental changes in ionotropic glutamate receptors: lessons from hippocampal synapses. Neuroscientist 2002;8:143–53.
[45] Gaiarsa JL. Plasticity of GABAergic synapses in the neonatal rat hippo-campus. J Cell Mol Med 2004;8:31–7.
[46] Azimi-Zonooz A, Shuttleworth CW, Connor JA. GABAergic protection of hippocampal pyramidal neurons against glutamate insult: deficit in young animals compared to adults. J Neurophysiol 2006;96:299–308.
[47] Pickering C, Gustafsson L, Cebere A, Nylander I, Liljequist S. Repeated maternal separation of male Wistar rats alters glutamate receptor expression in the hippocampus but not the prefrontal cortex. Brain Res 2006;1099:101–8. [48]Rotta LN, Leszczinski DN, Brusque AM, Pereira P, Brum LF, Nogueira CW,
et al. Effects of undernutrition on glutamatergic parameters in the cerebral cortex of young rats. Physiol Behav 2008;94:580–5.
[49]Viveros MP, Diaz F, Mateos B, Rodriguez N, Chowen JA. Maternal depriva-tion induces a rapid decline in circulating leptin levels and sexually dimorphic modifications in hypothalamic trophic factors and cell turnover. Horm Behav 2010;57:405–14.
[50] Viveros MP, Llorente R, Diaz F, Romero-Zerbo SY, Bermudez-Silva FJ, Rodriguez de FF, et al. Maternal deprivation has sexually dimorphic long-term effects on hypothalamic cell-turnover, body weight and circulating hormone levels. Horm Behav 2010;58:808–19.
[51] Banks WA. The blood-brain barrier as a regulatory interface in the gut-brain axes. Physiol Behav 2006;89:472–6.
[52] Irving AJ, Harvey J. Leptin regulation of hippocampal synaptic function in health and disease. Philos Trans R Soc Lond B Biol Sci 2014;369:20130155. [53] Guimond D, Diabira D, Porcher C, Bader F, Ferrand N, Zhu M, et al. Leptin potentiates GABAergic synaptic transmission in the developing rodent hippocampus. Front Cell Neurosci 2014;8:235.
[54] Cottrell EC, Mercer JG, Ozanne SE. Postnatal development of hypothalamic leptin receptors. Vitam Horm 2010;82:201–17.
[55] Bouret SG, Simerly RB. Development of leptin-sensitive circuits. J Neuro-endocrinol 2007;19:575–82.
[56] Fantuzzi G, Faggioni R. Leptin in the regulation of immunity, inflammation, and hematopoiesis. J Leukoc Biol 2000;68:437–46.
[57] Black S, Kushner I, Samols D. C-reactive protein. J Biol Chem 2004;279:48487–90.
[58] de Queiroz CA, Fonseca SG, Frota PB, Figueiredo IL, Aragao KS, Magalhaes CE, et al. Zinc treatment ameliorates diarrhea and intes-tinal inflammation in undernourished rats. BMC Gastroenterol 2014;14:136.
[59] Coutinho BP, Oria RB, Vieira CM, Sevilleja JE, Warren CA, Maciel JG, et al. Cryptosporidium infection causes undernutrition and, conversely, wean-ling undernutrition intensifies infection. J Parasitol 2008;94:1225–32. [60] Castro IC, Oliveira BB, Slowikowski JJ, Coutinho BP, Siqueira FJ, Costa LB,
et al. Arginine decreases Cryptosporidium parvum infection in under-nourished suckling mice involving nitric oxide synthase and arginase. Nutrition 2012;28:678–85.
[61] Lacey RE, Kumari M, McMunn A. Parental separation in childhood and adult inflammation: the importance of material and psychosocial path-ways. Psychoneuroendocrinology 2013;38:2476–84.
[62] Preidis GA, Keaton MA, Campeau PM, Bessard BC, Conner ME, Hotez PJ. The undernourished neonatal mouse metabolome reveals evidence of liver and biliary dysfunction, inflammation, and oxidative stress. J Nutr 2014;144:273–81.
[63] Haspolat K, Ece A, Gurkan F, Atamer Y, Tutanc M, Yolbas I. Relationships between leptin, insulin, IGF-1 and IGFBP-3 in children with energy malnutrition. Clin Biochem 2007;40:201–5.
[64] Adriani M, Wirjatmadi B. The effect of adding zinc to vitamin A on IGF-1, bone age and linear growth in stunted children. J Trace Elem Med Biol 2014;28:431–5.
[65] Clarke G, Grenham S, Scully P, Fitzgerald P, Moloney RD, Shanahan F, et al. The microbiome-gut-brain axis during early life regulates the hippocampal serotonergic system in a sex-dependent manner. Mol Psychiatry 2013;18:666–73.