http://informahealthcare.com/ahb ISSN: 0301-4460 (print), 1464-5033 (electronic)
Ann Hum Biol, Early Online: 1–11
!2015 Informa UK Ltd. DOI: 10.3109/03014460.2015.1058419
RESEARCH P APER
Change, stability and prediction of gross motor co-ordination in
Portuguese children
Anto´nio M. Antunes1, Jose´ A. Maia2, E´lvio R. Gouveia1, Martine A. Thomis3, Johan A. Lefevre3, Alexandra Q. Teixeira1, and Duarte L. Freitas1,4
1Department of Physical Education and Sports, University of Madeira, Funchal, Portugal,2CIFI2D, Faculty of Sport, University of Porto, Porto,
Portugal,3KU Leuven, Faculty of Kinesiology and Rehabilitation Sciences, Department of Kinesiology, Physical Activity, Sports & Health Research Group, Leuven, Belgium, and4Department of Mathematical Sciences, University of Essex, Colchester, UK
Abstract
Background: The knowledge about intra- and inter-individual variation can stimulate attempts at description, interpretation and prediction of motor co-ordination (MC).
Aim: To analyse change, stability and prediction of motor co-ordination (MC) in children. Subjects and methods: A total of 158 children, 83 boys and 75 girls, aged 6, 7 and 8 years, were evaluated in 2006 and re-evaluated in 2012 at 12, 13 and 14 years of age. MC was assessed through the Kiphard-Schilling’s body co-ordination test and growth, skeletal maturity, physical fitness, fundamental motor skills (FMS), physical activity and socioeconomic status (SES) were measured and/or estimated.
Results: Repeated-measures MANOVA indicated that there was a significant effect of group, sex and time on a linear combination of the MC tests. Univariate tests revealed that group 3 (8–14 years) scored significantly better than group 1 (6–12 years) in all MC tests and boys performed better than girls in hopping for height and moving sideways. Scores in MC were also higher at follow-up than at baseline. Inter-age correlations for MC were between 0.15–0.74. Childhood predictors of MC were growth, physical fitness, FMS, physical activity and SES. Biological maturation did not contribute to prediction of MC.
Conclusion: MC seemed moderately stable from childhood through adolescence and, additionally, inter-individual predictors at adolescence were growth, FMS, physical fitness, physical activity and SES.
Keywords
Biological maturation, children, co-ordination, skills, tracking
History
Received 24 October 2014 Revised 4 May 2015 Accepted 12 May 2015 Published online 3 August 2015
Introduction
One of the purposes of assessing gross motor co-ordination (MC) of children, aged 5–14 years, is to explore age- and sex-association variation. In a classical study, Kiphard and Schilling (1974) observed that MC increased with age and girls performed significantly better than the boys in hopping for height (HH) and jumping sideways (JS). More recent studies (Ahnert et al., 2009; Deus et al., 2008; Valdivia et al., 2008b; Vandorpe et al., 2011a) confirm the pattern of age-associated variation, but there is some inconsistency regarding sex-associated variation in MC tests.
Tracking of MC has been examined in a small number of studies (Ahnert et al., 2009; Deus et al., 2008; Vandorpe et al., 2011b; Willimczik, 1980). Tracking refers to the tendency for an individual to maintain the same relative position within an age and sex group over a period of time (Malina et al., 2004) and the ability to discover specific ages or variables where prediction becomes reasonably accurate
(Foulkes & Davies, 1981). In Belgian (Vandorpe et al., 2011b) and German (Ahnert et al., 2009; Willimczik, 1980) children, the stability of MC was high (inter-age correlations above 0.60). Deus et al. (2008) reported correlation coeffi-cients between 0.16 and 0.74 in Portuguese children. Consequently, there is some heterogeneity of tracking of MC across studies. In terms of prediction, MC has been linked to physical fitness (Vandendriessche et al., 2011), human physical growth (D’Hondt et al., 2011, 2012; Lopes et al., 2012a; Wrotniak et al., 2006), physical activity (Fisher et al., 2005; Lopes et al., 2011; Vandorpe et al., 2011b) and socioeconomic status (SES) (Valdivia et al., 2008a; Vandendriessche et al., 2012). Evidence from these studies to support this includes: (1) high levels of physical fitness and physical activity were associated with high scores on MC; (2) body fatness was inversely associated with MC; and (3) the association of SES with MC was inconsistent across studies. Since MC, together with fundamental motor skills (FMS), are determinants of the general development of children (Haga, 2008; Henderson & Sugden, 1992) and are associated with health-related parameters (Stodden et al., 2008) it is crucial to promote MC during childhood and adolescence. According to Branta et al. (1984), longitudinal research that
Correspondence: Duarte Luı´s de Freitas, Universidade da Madeira, Departamento de Educac¸a˜o Fı´sica e Desporto, Campus Universita´rio da Penteada, 9000-390 Funchal, Portugal. Tel: +351–291–705332. Fax: +351–291–705249. E-mail: [email protected]
Ann Hum Biol Downloaded from informahealthcare.com by Universidade da Madeira on 07/31/15
describes change serves as a standard against which individ-uals of certain ages, grades, programmes and populations can be compared and the knowledge about a general pattern of change can stimulate attempts at explanation, intervention and prediction. In this respect, the extent to which MC is stable over time is of interest because of its significance in the prediction of human performance, identification of clumsy and motor-impaired children and application of preventive measures (Ahnert et al., 2009).
This study considers change, stability and prediction of MC in a longitudinal sample of Portuguese children, from Madeira and Porto Santo Islands. Whilst the previous research explored the associations of MC with physical fitness, human physical growth, physical activity and SES, the current study extended the multivariate analysis to FMS and biological maturation. Moreover, very little is known about stability and childhood predictors of MC at early adolescence, i.e. at 12, 13 and 14 years. Specifically, we hypothesised that: (1) MC improved with age and differences in scores among boys and girls were test- and age-specific; (2) stability of MC during childhood and early adolescence was low-to-moderate across the different cohorts; (3) MC, human physical growth, biological maturation, physical fitness, FMS, physical activity and SES in childhood were predictors of MC at early adolescence; and (4) predictors of MC changed over time and the relative contribution of these predictors also changed with age.
Subjects and methods
Study design, sampling procedures and participants
In 2006, 1369 subjects, 664 boys and 705 girls, were sampled in the scope of the ‘‘Healthy Growth of Madeira Study’’ (HGMS). The HGMS is a cross-sectional study with 12 birth cohorts, assessed at the ages of 3, 4, 5, 6, 7, 8, 9, 10, 11, 12, 13 and 14. A proportional stratified random sampling was conducted with geographical location, school grade and school facilities as stratification factors. A total of 40 public schools were selected from the 11 districts of Autonomous Region of Madeira (ARM), i.e. Madeira and Porto Santo islands. The Secretary of Education and Culture provided a list of schools and students. In each district, at least one kindergarten, one primary school and one high school
participated in the study. Approximately 50 boys and 50 girls were randomly sampled in each age interval from 3–10 years. For the age intervals 10–14 years, each cohort comprised100 boys and 100 girls. The number of subjects sampled in each district was proportional to the number of children enrolled in the compulsory education system, matched by age and sex. Sampling procedures were carried out with the collaboration of a member of the National Institute of Statistics (Statistics Portugal).
In the current study, a sub-sample of 158 subjects, 83 boys and 75 girls, aged 6, 7 and 8 years, was used and corresponds to 49.4% of the original sample for these age intervals (n¼320; 162 boys and 158 girls). The distribution of the sub-sample, by district, was similar to the original sample. In 2012, this sub-sample was re-evaluated when children were 12, 13 and 14 years, respectively. Therefore, the longitudinal sample comprised children from three cohorts: 1 (6–12 years), 2 (7–13 years) and 3 (8–14 years). The use of 158 subjects in the follow-up reflected the human and financial constraints that are common in longitudinal studies. Overall, there were no significant differences between those who were followed and the rest of the sample on the main clusters including MC, human physical growth, biological maturation, physical fitness, FMS and physical activity. The number of partici-pants, by age group and sex, at baseline (2006) and follow-up (2012), as well as the mean length of follow-up, are presented in Table 1.
Data collection and measurements
All study protocols were reviewed and approved by the Scientific Board of the University of Madeira and permission was granted from the Regional Secretary of Education and Culture. The whole process was also approved by the Ethics Committee of the Hospital of Funchal. Participants were informed about the procedures, nature and relevance of the study and (written) consent was granted from their parents or tutors.
In 2006, data was collected by six teachers of Physical Education under the supervision of one of the study co-ordinators. The team members underwent theoretical classes and lab sessions during a period of 3 months prior to data collection. A pilot study was carried out in 46 children, aged 3–10 years, from a primary school. Children
Table 1. Number of subjects (n), age at baseline (mean and SD), age group (Gr), age at follow-up (mean and SD) and mean length of the follow-up in boys and girls from the Healthy Growth of Madeira Study.
Baseline Follow-up
Sample characteristics n x ± SD Age group n x ± SD Age group Mean length of follow-up
Boys
Group 1 27 6.72 ± 0.2 6 27 12.49 ± 0.2 12 5.77 Group 2 29 7.62 ± 0.2 7 29 13.39 ± 0.2 13 5.77 Group 3 27 8.59 ± 0.3 8 27 14.38 ± 0.2 14 5.79
Total 83 83
Girls
Group 1 23 6.64 ± 0.2 6 23 12.40 ± 0.2 12 5.76 Group 2 28 7.58 ± 0.2 7 28 13.34 ± 0.2 13 5.77 Group 3 24 8.68 ± 0.3 8 24 14.46 ± 0.3 14 5.77
Total 75 75
Grand total 158 158
Group 1, 6–12 years; Group 2, 7–13 years; Group 3, 8–14 years. A. M. Antunes et al.
Ann Hum Biol Downloaded from informahealthcare.com by Universidade da Madeira on 07/31/15
were assessed twice, with an interval of 1 week, in order to assess test–re-test reliability and to refine assessment proced-ures. Baseline data was collected between January–June 2006. The assessment of anthropometry and skeletal maturation (x-ray) took place in the gym. FMS, physical fitness and MC tests were assessed in the school sports hall. The field members worked in pairs. Children received a verbal description followed by a visual demonstration of each skill/ test. Motor tests were administered in a single day (20 participants/day). In 2012, data was collected by one member of the previous team who strictly followed the assessment procedures. Data collection took place between January– March 2012.
Gross motor co-ordination
MC was evaluated by means of the ‘‘Ko¨rperkoordinations Test Fu¨r Kinder’’ (Body Co-ordination Test for Children) (KTK) developed by Kiphard and Schilling (1974) and recently revised by the same authors (Kiphard & Schilling, 2007). The KTK comprises four test items: (1) walking backwards (WB) three times along each of three balance beams (6 cm, 4.5 cm and 3 cm width, 3 m length, 5 cm height) (the number of successful steps is recorded); (2) hopping for height (HH) on one leg over a pile of pillows increasing in height with consecutive steps of 5 cm per pillow (60 cm20 cm5 cm each): the initial height is based on the prelim-inary exercises and the age of the children; three trials are possible for a given height on the right and left leg (the height of the final successful jump is recorded); a maximum of 39 points can be achieved per leg for a total of 78 points; (3) jumping sideways (JS) with both feet as many times as possible over a wooden slat (60 cm4 cm2 cm) in 15 seconds (the number of jumps over two trials is summed); and (4) moving sideways (MS) on wooden boxes (25 cm25 cm
5.7 cm) during 20 seconds (the number of relocations is counted and summed over two trials). Raw scores for each test were used in the present data analysis in order to capture variation and not to level off the measured differences. Test– re-test reliability carried out in the pilot study, via intra-class correlation coefficient (ICC), was between 0.64 (HH; 95% CI¼0.250–0.830) and 0.90 (WB; 95% CI¼0.798–0.954).
Anthropometry
Twenty-one human physical growth characteristics sub-divided into general body dimensions (height, body mass and sitting height), bone diameters (biacromial, bicristal, femur and humerus), circumferences [arm (relaxed and flexed), calf, forearm, hip, thigh and waist] and skin-folds (abdominal, biceps, calf, subscapular, suprailiac, thigh, and triceps) were taken from all participants in 2006 with the purpose of covering a wide variation of human growth characteristics. Children were assessed according to proced-ures used in the ‘‘Leuven Growth Study—Growth and Fitness of Flemish Girls’’ (Claessens et al., 1990). The ICCs of test and re-tests for all measurements were between 0.85 (bicristal diameter) and 1.00 (height) in the pilot study. Absolute and relative technical errors of measurement (TEM) were, respectively, 1.13 mm and 5.70% for bicristal diameter and 0.32 cm and 0.26% for height. Test–re-test reliability (ICC)
during the 1st phase of the study (2006) ranged from 0.899 (forearm circumference) and 1.000 (height and weight). Absolute and relative TEM were, respectively, 1.36 cm and 6.56% for forearm circumference and 0.44 cm and 0.31% for height. Height, body mass, waist circumference and abdominal skin-fold were also assessed in 2012. For the current study only height, body mass, sum of five skin-folds (biceps, calf, subscapular, suprailiac and triceps), ratio of sitting height to stature and androgyny index were used as predictors of MC since the sum of the five skin-folds was more informative than a single skin-fold, proportionality was more important than body mass index and androgyny index was more informative than a single diameterper se.
Biological maturation
Skeletal maturity was estimated using the Tanner-Whitehouse 3 method (Tanner et al., 2001). Briefly, the radius, ulna and short bones (RUS) entails matching 13 individual bones of the hand and wrist, namely the radius and ulna, the metacarpals and the phalanges, to a set of written criteria. The summed maturity scores are converted to bone age. In 2006, an X-ray from the left hand and wrist was taken with a portable unit [Model TOP 25 (140 kvp; 25 mA); For You Company, Belgium]. All the x-rays were rated by one of the co-authors of this study (DF) with substantial experience in rating x-rays. Inter-observer agreement between the DF and Gaston Beunen (GB) was 85.3%, ranging from 76% (middle phalange of the fifth finger and trapezium) to 100% (capitate and lunate). Briefly, a random sample of 50 radiographs from the Leuven Growth Study of Belgian Boys was independently rated by GB and DF. The number of agreements in stages of each single bone across the total sample (n¼50) was used in data quality assess-ment. In this study, relative skeletal age (SA), i.e. SA divided by chronological age, was used to express maturity status of the children.
Physical fitness
Physical fitness was assessed using the Eurofit test battery (Adam et al., 1988), which includes nine motor tests; namely, flamingo balance, plate tapping, shuttle runs, sit ups, flexed arm hang, sit and reach, handgrip and standing long jump. The endurance shuttle run was replaced by the 12-minute run/ walk test from the AAHPERD (1988). In the pilot study, ICCs were between 0.761 (flamingo balance; 95% CI¼0.499– 0.886) and 0.986 (bent arm hang; 95% CI¼0.970–0.993). In 2012, some of these motor tests were re-assessed, but these data were not included in this analysis.
Fundamental motor skills
FMS were assessed through the ‘‘Test of Gross Motor Development’’ (TGMD-2) (Ulrich, 2000). The TGMD-2 comprises 12 motor skills divided into two sub-sets: loco-motor and object control. The first assesses loco-motor skills that are involved in moving the centre of gravity and include: run, gallop, hop, leap, horizontal jump and slide. The second assesses motor skills associated with throw/manipulation of objects and included: striking a stationary ball, stationary
DOI: 10.3109/03014460.2015.1058419 Change, stability and prediction of MC 3
Ann Hum Biol Downloaded from informahealthcare.com by Universidade da Madeira on 07/31/15
dribble, catch, kick, overhand throw and underhand roll. The sum of scores of the six motor skills originates a score for locomotor and object control skills, separately (Ulrich, 2000). Data for FMS were only collected in 2006. Test–re-test reliability in the pilot study was between 0.653 (standing long jump; 95% CI¼0.374–0.808) and 0.948 (stationary dribble; 95% CI¼0.905–0.971) if one item was deleted.
Physical activity
Physical activity was assessed through the Baecke question-naire (Baecke et al., 1982). The questionquestion-naire presents 16 questions, eight of them related to physical activity at work (questions 1–8), four related to sport practice (questions 9–12) and four related to leisure-time physical activity (questions 13–16). Answers to the different items of the questionnaire are quantified in a Likert scale, with the exception of the parental occupation and sports. Three indices are operationalised: physical activity at work, physical activity in sports and physical activity in leisure time. In the 1st phase of the study, no information was collected in the first eight questions because all the participants were students. The questionnaire was adminis-tered through a face-to-face interview. At earlier ages and whenever necessary, the questionnaire was filled with the assistance of the school’s teacher, parents or tutors. Evidence is accumulating that the Baecke questionnaire and modifi-cations of this questionnaire provide reliable and valid information. In children and adolescents, 11–14 years old, test–re-test reliability of the sport and leisure-time indices measured with an interval of 1 week during the Madeira Growth Study (MGS) (Freitas et al., 2007), were 0.80 and 0.73, respectively, and this parallels the results found by Baecke et al. (1982) in the original sample of Dutch adult men and women (0.81 and 0.74, respectively). In adoles-cents, 12–18 years of age, Philippaerts et al. (2006) observed that the intra-class correlation coefficients for two independent reports of sport and leisure time activities were higher than 0.70 and that sport and leisure time activities showed a significant correlation (r40.50) with the
counts of an uniaxial accelerometer.
Socioeconomic status
SES was quantified via a standardised questionnaire devel-oped by the National Institute of Statistics (Statistics Portugal, 1995). The questionnaire comprises five groups of questions; namely, parental occupation, education, income, housing and residential area, each one rated on a five-unit scale. The Graffar framework (Graffar, 1956) was used in the social stratification. First, the sum of the five socioeconomic characteristics was used in the analysis. Second, the five characteristics were entered separately in the regression models. Level of education was assessed according to International Standard Classification of Education (1997). In order to follow the social stratification framework of Graffar (1956), levels of education were inverted, i.e. level 1 included ‘‘second stage or tertiary education’’ and level 5 involved ‘‘primary education or first stage of basic education’’. A similar approach was carried out by Freitas et al. (2004, 2007) in the scope of the MGS.
Statistical analysis
Data were double entered and screened for outliers and normality. Means and standard deviations were calculated at baseline and/or follow-up for MC, human physical growth characteristics, biological maturity, physical fitness, FMS, physical activity and SES.
An independent-samplest-test was used to investigate the differences between those who were followed and the rest of the sample. Intra-class correlation coefficients (R) were used in the reliability analyses. Technical errors of measurement (absolute and relative) were also calculated for anthropom-etry. Repeated-measures MANOVA analyses were conducted to assess the effect of group 1 (6–12 years), 2 (7–13 years) and 3 (8–14 years), sex (male and female), time (baseline and follow-up) and its first- and second-order interactions (group
sex, timegroup, timesex and timegroupsex) on MC (multivariate and univariate tests). Preliminary assump-tion testing was performed to check for linearity, homogeneity of variance–covariance matrices and multicollinearity and results were satisfactory. Significance was set atp50.05 for
multivariate tests. For univariate tests, an alpha level of 0.013 [0.05 divided by 4 (n of dependent variables)] was set in order to reduce the chance of Type 1 error (Tabachnick & Fidell, 2014).
Tracking of human physical growth characteristics and MC tests was estimated with inter-age Pearson product-moment correlations between the first (baseline) and last (follow-up) measurements; 95% confidence intervals (CI) were obtained through bootstrapping analyses. Predictors of MC were identified via stepwise multiple linear regression. First, zero-order correlations were calculated between MC tests assessed at 12, 13 and 14 years and human physical growth characteristics, MC, skeletal maturation, physical fitness, FMS, physical activity and SES at 6, 7 and 8 years, respectively. Second, items with statistical significance were entered in the stepwise regression. The default p values of 0.05 (entry) and 0.10 (removal) were used as the levels of statistical significance. All analyses were conducted using Stata, version 11 (Stata, 2009) and SPSS 19.0 (IBM Corporation, 2012).
Results
Descriptive statistics
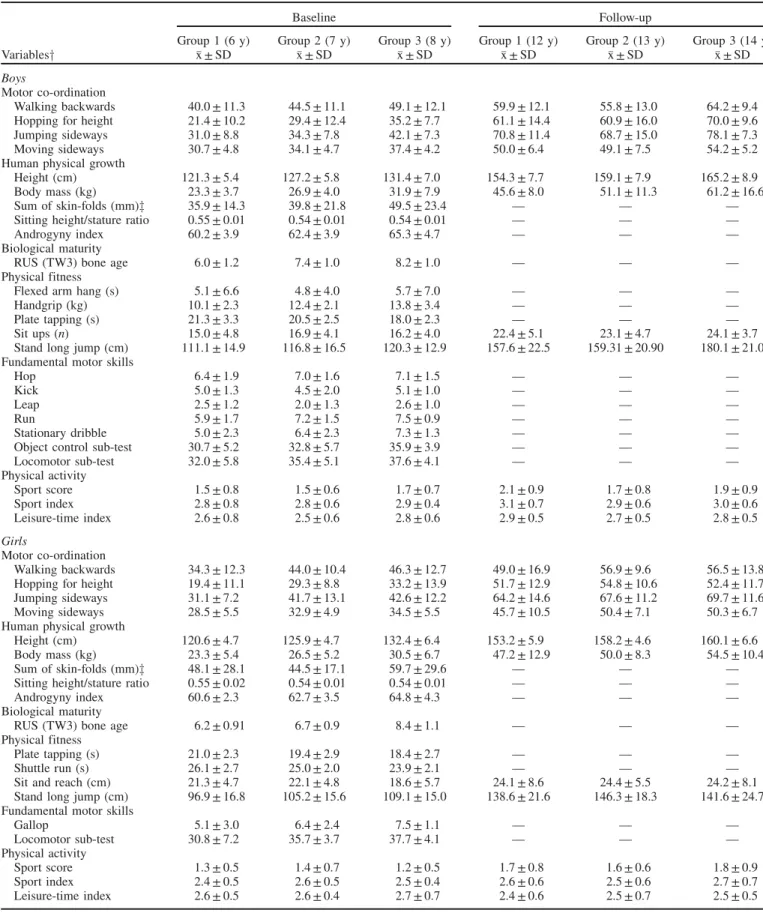
Table 2 presents the descriptive statistics for MC, human physical growth, biological maturity, physical fitness, FMS and physical activity of the Madeira children and adolescents. For physical fitness and FMS, only predictors of MC are presented. Since few human physical growth characteristics were taken in 2012, corresponding data were included in Table 2 when available. Biological maturity is included in Table 2 for a better description of the sample. Developmental progress in MC tests was quantified for boys and girls, separately, at two time points. Multivariate tests indicate that there are statistically significant differences among the groups [Pillai’s Trace (V)¼0.181, F(8, 294)¼3.646, p50.001,
partial eta squared (2p)¼0.09], sex [V¼0.145, F(4, 146)¼6.170, p50.001, 2
p¼0.15] and time
[V¼0.933, F(4, 146)¼506.993, p50.001, 2
p¼0.93] on a
A. M. Antunes et al.
Ann Hum Biol Downloaded from informahealthcare.com by Universidade da Madeira on 07/31/15
Table 2. Descriptive statistics for motor co-ordination, human physical growth, biological maturation, physical fitness, fundamental motor skills and physical activity at baseline (6, 7 and 8 years old) and 6 years later (12, 13 and 14 years old).
Baseline Follow-up
Group 1 (6 y) Group 2 (7 y) Group 3 (8 y) Group 1 (12 y) Group 2 (13 y) Group 3 (14 y) Variablesy x ± SD x ± SD x ± SD x ± SD x ± SD x ± SD
Boys
Motor co-ordination
Walking backwards 40.0 ± 11.3 44.5 ± 11.1 49.1 ± 12.1 59.9 ± 12.1 55.8 ± 13.0 64.2 ± 9.4 Hopping for height 21.4 ± 10.2 29.4 ± 12.4 35.2 ± 7.7 61.1 ± 14.4 60.9 ± 16.0 70.0 ± 9.6 Jumping sideways 31.0 ± 8.8 34.3 ± 7.8 42.1 ± 7.3 70.8 ± 11.4 68.7 ± 15.0 78.1 ± 7.3 Moving sideways 30.7 ± 4.8 34.1 ± 4.7 37.4 ± 4.2 50.0 ± 6.4 49.1 ± 7.5 54.2 ± 5.2 Human physical growth
Height (cm) 121.3 ± 5.4 127.2 ± 5.8 131.4 ± 7.0 154.3 ± 7.7 159.1 ± 7.9 165.2 ± 8.9 Body mass (kg) 23.3 ± 3.7 26.9 ± 4.0 31.9 ± 7.9 45.6 ± 8.0 51.1 ± 11.3 61.2 ± 16.6 Sum of skin-folds (mm)z 35.9 ± 14.3 39.8 ± 21.8 49.5 ± 23.4 — — — Sitting height/stature ratio 0.55 ± 0.01 0.54 ± 0.01 0.54 ± 0.01 — — — Androgyny index 60.2 ± 3.9 62.4 ± 3.9 65.3 ± 4.7 — — — Biological maturity
RUS (TW3) bone age 6.0 ± 1.2 7.4 ± 1.0 8.2 ± 1.0 — — — Physical fitness
Flexed arm hang (s) 5.1 ± 6.6 4.8 ± 4.0 5.7 ± 7.0 — — — Handgrip (kg) 10.1 ± 2.3 12.4 ± 2.1 13.8 ± 3.4 — — — Plate tapping (s) 21.3 ± 3.3 20.5 ± 2.5 18.0 ± 2.3 — — — Sit ups (n) 15.0 ± 4.8 16.9 ± 4.1 16.2 ± 4.0 22.4 ± 5.1 23.1 ± 4.7 24.1 ± 3.7 Stand long jump (cm) 111.1 ± 14.9 116.8 ± 16.5 120.3 ± 12.9 157.6 ± 22.5 159.31 ± 20.90 180.1 ± 21.0 Fundamental motor skills
Hop 6.4 ± 1.9 7.0 ± 1.6 7.1 ± 1.5 — — — Kick 5.0 ± 1.3 4.5 ± 2.0 5.1 ± 1.0 — — — Leap 2.5 ± 1.2 2.0 ± 1.3 2.6 ± 1.0 — — — Run 5.9 ± 1.7 7.2 ± 1.5 7.5 ± 0.9 — — — Stationary dribble 5.0 ± 2.3 6.4 ± 2.3 7.3 ± 1.3 — — — Object control sub-test 30.7 ± 5.2 32.8 ± 5.7 35.9 ± 3.9 — — — Locomotor sub-test 32.0 ± 5.8 35.4 ± 5.1 37.6 ± 4.1 — — — Physical activity
Sport score 1.5 ± 0.8 1.5 ± 0.6 1.7 ± 0.7 2.1 ± 0.9 1.7 ± 0.8 1.9 ± 0.9 Sport index 2.8 ± 0.8 2.8 ± 0.6 2.9 ± 0.4 3.1 ± 0.7 2.9 ± 0.6 3.0 ± 0.6 Leisure-time index 2.6 ± 0.8 2.5 ± 0.6 2.8 ± 0.6 2.9 ± 0.5 2.7 ± 0.5 2.8 ± 0.5
Girls
Motor co-ordination
Walking backwards 34.3 ± 12.3 44.0 ± 10.4 46.3 ± 12.7 49.0 ± 16.9 56.9 ± 9.6 56.5 ± 13.8 Hopping for height 19.4 ± 11.1 29.3 ± 8.8 33.2 ± 13.9 51.7 ± 12.9 54.8 ± 10.6 52.4 ± 11.7 Jumping sideways 31.1 ± 7.2 41.7 ± 13.1 42.6 ± 12.2 64.2 ± 14.6 67.6 ± 11.2 69.7 ± 11.6 Moving sideways 28.5 ± 5.5 32.9 ± 4.9 34.5 ± 5.5 45.7 ± 10.5 50.4 ± 7.1 50.3 ± 6.7 Human physical growth
Height (cm) 120.6 ± 4.7 125.9 ± 4.7 132.4 ± 6.4 153.2 ± 5.9 158.2 ± 4.6 160.1 ± 6.6 Body mass (kg) 23.3 ± 5.4 26.5 ± 5.2 30.5 ± 6.7 47.2 ± 12.9 50.0 ± 8.3 54.5 ± 10.4 Sum of skin-folds (mm)z 48.1 ± 28.1 44.5 ± 17.1 59.7 ± 29.6 — — — Sitting height/stature ratio 0.55 ± 0.02 0.54 ± 0.01 0.54 ± 0.01 — — — Androgyny index 60.6 ± 2.3 62.7 ± 3.5 64.8 ± 4.3 — — — Biological maturity
RUS (TW3) bone age 6.2 ± 0.91 6.7 ± 0.9 8.4 ± 1.1 — — — Physical fitness
Plate tapping (s) 21.0 ± 2.3 19.4 ± 2.9 18.4 ± 2.7 — — — Shuttle run (s) 26.1 ± 2.7 25.0 ± 2.0 23.9 ± 2.1 — — — Sit and reach (cm) 21.3 ± 4.7 22.1 ± 4.8 18.6 ± 5.7 24.1 ± 8.6 24.4 ± 5.5 24.2 ± 8.1 Stand long jump (cm) 96.9 ± 16.8 105.2 ± 15.6 109.1 ± 15.0 138.6 ± 21.6 146.3 ± 18.3 141.6 ± 24.7 Fundamental motor skills
Gallop 5.1 ± 3.0 6.4 ± 2.4 7.5 ± 1.1 — — — Locomotor sub-test 30.8 ± 7.2 35.7 ± 3.7 37.7 ± 4.1 — — — Physical activity
Sport score 1.3 ± 0.5 1.4 ± 0.7 1.2 ± 0.5 1.7 ± 0.8 1.6 ± 0.6 1.8 ± 0.9 Sport index 2.4 ± 0.5 2.6 ± 0.5 2.5 ± 0.4 2.6 ± 0.6 2.5 ± 0.6 2.7 ± 0.7 Leisure-time index 2.6 ± 0.5 2.6 ± 0.4 2.7 ± 0.7 2.4 ± 0.6 2.5 ± 0.7 2.5 ± 0.5
yBiological maturation was not a predictor of motor ordination. For physical fitness and fundamental motor skills, only predictors of motor co-ordination are presented.
zSum of five skin-folds: biceps, calf, subscapular, suprailiac and triceps.
DOI: 10.3109/03014460.2015.1058419 Change, stability and prediction of MC 5
Ann Hum Biol Downloaded from informahealthcare.com by Universidade da Madeira on 07/31/15
linear combination of the MC tests. There are also significant multivariate effects across the interactions between time and group [V¼0.134, F(8, 294)¼2.636, p¼0.008, 2p¼0.07]
and time and sex [V¼0.229, F(4, 146)¼10.811,p50.001,
2p¼0.23], i.e. changes in scores of the combination of the
MC tests differ over time for the three age groups and between boys and girls.
Univariate analyses show that WB scores are significantly higher for group 3 (8–14 years) than for group 1 (6–12 years) [F(2, 149)¼7.946,p¼0.001,2p¼0.09] and that WB scores
are significantly higher at follow-up than at baseline [F(1, 149)¼196.516, p50.001, 2
p¼0.57], suggesting an
improvement (F, p-value, 2p and comparisons are not shown
in Table 2). In HH, between-subjects effects show that group 3 (8–14 years) perform better than group 1 (6–12 years) [F(2, 149)¼10.262,p50.001,2
p¼0.12] and that boys score
better than girls [F(1, 149)¼16.317, p50.001, 2
p¼0.10].
Univariate within-subjects analysis also indicates that HH scores significantly improve between baseline and follow-up [F(1, 149)¼1088.881, p50.001, 2
p¼0.88]. For HH there
are significant interactions between time and group [F(2, 149)¼8.445, p50.001, 2
p¼0.10] and between time
and sex [F(1, 149)¼28.492, p50.001, 2
p¼0.16]. In JS,
scores are higher for group 3 (8–14 years) than group 1 (6–12 years) [F(2, 149)¼9.863, p50.001, 2
p¼0.12] and JS
scores improve significantly between time 1 and 2 [F(1, 149)¼1416.871, p50.001, 2
p¼0.91]. There are also
significant interactions between time and group [F(2, 149)¼4.617, p¼0.011, 2p¼0.06] and time and sex
[F(1, 149)¼19.302, p50.001, 2
p¼0.12]. In MS, groups
3 (8–14 years) and 2 (7–13 years) score significantly better than group 1 (6–12 years) [F(2, 149)¼13.175, p50.001,
2p¼0.15], boys perform better than girls [F(1, 149)¼8.189, p¼0.005,p2¼0.05] and scores improve from 2006 to 2012
[F(1, 149)¼904.840,p50.001,2
p¼0.86]. Tracking of MC tests
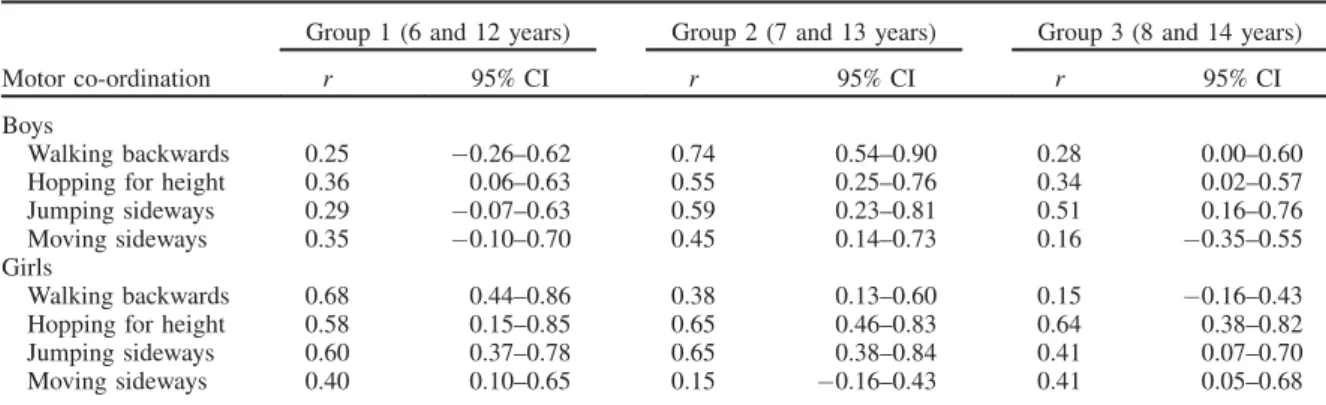
Table 3 shows the Pearson product-moment inter-age correl-ation coefficients and 95% confidence intervals among the Madeira participant’s performances on MC tests at baseline and their performance 6 years later, separately for boys and girls. Overall, MC throughout childhood and early adoles-cence exhibits low-to-moderate tracking (r in the range of 0.15–0.60). Some exceptions are observed in WB (group 1
and 2, boys or girls), HH (group 2 and 3, girls) and JS (group 2, girls) where correlations are higher than 0.60, indicating reasonably good tracking. The range of correlations for MC tests is similar for boys (r¼0.16–0.74) and girls (r¼0.15– 0.68). However, girls show better stability than boys in all MC tests (r¼0.40–0.68, girls and r¼0.25–0.36, boys) at 6–12 years old. A more stable pattern of boys comparing to girls is seen in WB (r¼0.74, boys and r¼0.38, girls) and MS (r¼0.45, boys and r¼0.15, girls) at 7–13 years. On the contrary, girls showed higher tracking than boys in HH (r¼0.55, boys andr¼0.65, girls) and JS (r¼0.59, boys and
r¼0.65, girls) at 7–13 years. In the older age group, 8–14 years, boys display higher stability coefficients than girls in WB (r¼0.28, boys andr¼0.15, girls) and JS (r¼0.51, boys andr¼0.41, girls) and the opposite is true for HH (r¼0.34, boys andr¼0.64, girls) and MS (r¼0.16, boys andr¼0.41, girls). Generally, WB, HH and JS are slightly more stable at 7–13 years (r¼0.38–0.74) than at 6–12 (r¼0.25–0.68) and 8–14 years (r¼0.15–0.64). MS shows better tracking at 6–12 years (r¼0.35–0.40) than in 7–13 years (r¼0.15–0.45) and 8–14 years (r¼0.16–0.41). Of the 24 correlations, 10 are above 0.50, four in boys and six in girls. The highest number of correlations above 0.50 is located in the age group 7–13 years.
Predictors of motor co-ordination
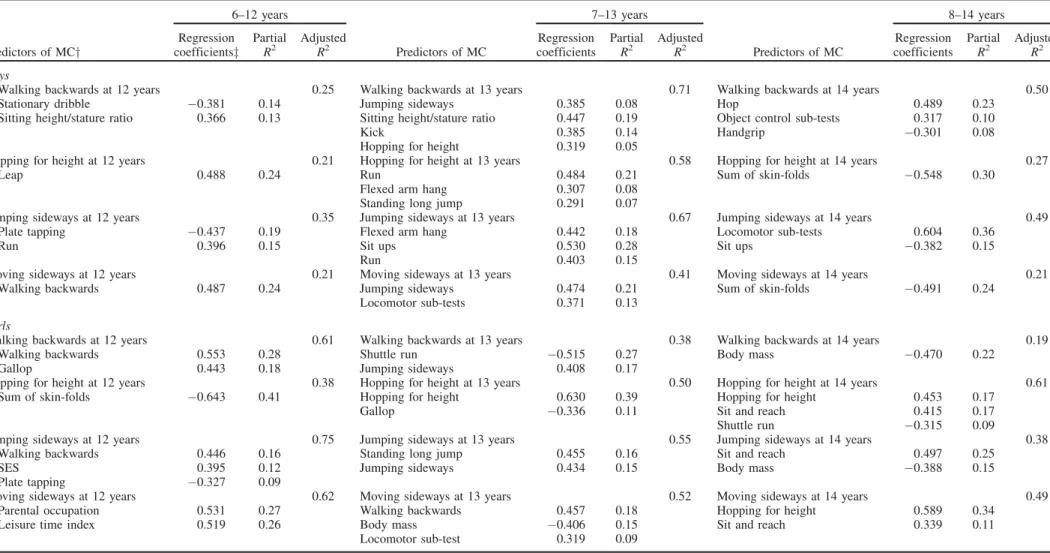
Multiple linear regression models for MC tests at 12, 13 and 14 years with predictors of MC observed at 6, 7 and 8 years are shown in Table 4. For boys, 21–71% of the variance in the MC tests at 12, 13 and 14 years is explained by MC tests, human physical growth characteristics, physical fitness and FMS at 6, 7 and 8 years, respectively. By age group, the adjustedR2is comprised between 21–35% (6–12 years), 41– 71% (7–13 years) and 21–50% (8–14 years). At 7 years, JS is a predictor of WB and MS at 13 years. The percentage of explained variance is 8% and 21%, respectively. WB at 6 years and HH at 7 years are also predictors of MS at 12 years and WB at 13 years, respectively. The ratio of sitting height to stature at 6 and 7 years is a predictor of WB at 12 and 13 years. The contribution of this variable to the totalR2is 13% at 12 years and 19% at 13 years. The sum of skin-folds at 8 years is also a predictor of HH and MS at 14 years, explaining 24 and 30% of the total variance. At 7 years, flexed arm hang is a predictor of HH and JS. Sit ups at 7 and 8 years explain
Table 3. Pearson product-moment correlation coefficients (r) and 95% confidence intervals (95% CI) for motor coordination tests between ages at baseline (6, 7, and 8 years old) and corresponding ages 6 years later (12, 13 and 14 years old) in boys and girls.
Group 1 (6 and 12 years) Group 2 (7 and 13 years) Group 3 (8 and 14 years)
Motor co-ordination r 95% CI r 95% CI r 95% CI
Boys
Walking backwards 0.25 0.26–0.62 0.74 0.54–0.90 0.28 0.00–0.60 Hopping for height 0.36 0.06–0.63 0.55 0.25–0.76 0.34 0.02–0.57 Jumping sideways 0.29 0.07–0.63 0.59 0.23–0.81 0.51 0.16–0.76 Moving sideways 0.35 0.10–0.70 0.45 0.14–0.73 0.16 0.35–0.55 Girls
Walking backwards 0.68 0.44–0.86 0.38 0.13–0.60 0.15 0.16–0.43 Hopping for height 0.58 0.15–0.85 0.65 0.46–0.83 0.64 0.38–0.82 Jumping sideways 0.60 0.37–0.78 0.65 0.38–0.84 0.41 0.07–0.70 Moving sideways 0.40 0.10–0.65 0.15 0.16–0.43 0.41 0.05–0.68 A. M. Antunes et al.
Ann Hum Biol Downloaded from informahealthcare.com by Universidade da Madeira on 07/31/15
Table 4. Multiple linear regression for motor co-ordination tests at 12, 13 and 14 years with predictors observed at 6, 7 and 8 years, respectively.
6–12 years 7–13 years 8–14 years
Predictors of MCy
Regression coefficientsz
Partial R2
Adjusted
R2 Predictors of MC
Regression coefficients
Partial R2
Adjusted
R2 Predictors of MC
Regression coefficients
Partial R2
Adjusted R2
Boys
Walking backwards at 12 years 0.25 Walking backwards at 13 years 0.71 Walking backwards at 14 years 0.50 Stationary dribble 0.381 0.14 Jumping sideways 0.385 0.08 Hop 0.489 0.23
Sitting height/stature ratio 0.366 0.13 Sitting height/stature ratio 0.447 0.19 Object control sub-tests 0.317 0.10
Kick 0.385 0.14 Handgrip 0.301 0.08
Hopping for height 0.319 0.05
Hopping for height at 12 years 0.21 Hopping for height at 13 years 0.58 Hopping for height at 14 years 0.27
Leap 0.488 0.24 Run 0.484 0.21 Sum of skin-folds 0.548 0.30
Flexed arm hang 0.307 0.08 Standing long jump 0.291 0.07
Jumping sideways at 12 years 0.35 Jumping sideways at 13 years 0.67 Jumping sideways at 14 years 0.49 Plate tapping 0.437 0.19 Flexed arm hang 0.442 0.18 Locomotor sub-tests 0.604 0.36
Run 0.396 0.15 Sit ups 0.530 0.28 Sit ups 0.382 0.15
Run 0.403 0.15
Moving sideways at 12 years 0.21 Moving sideways at 13 years 0.41 Moving sideways at 14 years 0.21 Walking backwards 0.487 0.24 Jumping sideways 0.474 0.21 Sum of skin-folds 0.491 0.24
Locomotor sub-tests 0.371 0.13
Girls
Walking backwards at 12 years 0.61 Walking backwards at 13 years 0.38 Walking backwards at 14 years 0.19 Walking backwards 0.553 0.28 Shuttle run 0.515 0.27 Body mass 0.470 0.22
Gallop 0.443 0.18 Jumping sideways 0.408 0.17
Hopping for height at 12 years 0.38 Hopping for height at 13 years 0.50 Hopping for height at 14 years 0.61 Sum of skin-folds 0.643 0.41 Hopping for height 0.630 0.39 Hopping for height 0.453 0.17
Gallop 0.336 0.11 Sit and reach 0.415 0.17
Shuttle run 0.315 0.09
Jumping sideways at 12 years 0.75 Jumping sideways at 13 years 0.55 Jumping sideways at 14 years 0.38 Walking backwards 0.446 0.16 Standing long jump 0.455 0.16 Sit and reach 0.497 0.25
SES 0.395 0.12 Jumping sideways 0.434 0.15 Body mass 0.388 0.15
Plate tapping 0.327 0.09
Moving sideways at 12 years 0.62 Moving sideways at 13 years 0.52 Moving sideways at 14 years 0.49 Parental occupation 0.531 0.27 Walking backwards 0.457 0.18 Hopping for height 0.589 0.34
Leisure time index 0.519 0.26 Body mass 0.406 0.15 Sit and reach 0.339 0.11 Locomotor sub-test 0.319 0.09
yMC, motor co-ordination;zStandardised coefficients.
DOI:
10.3109/03014460.2015.1058419
Chang
e,
stability
and
pr
ediction
of
MC
7
28% and 15% of JS at 13 and 14 years, respectively. Plate tapping at 6 years, standing long jump at 7 years and handgrip at 8 years are also predictors of JS, HH and WB at 12, 13 and 14 years. Stationary dribble, leap and run at 6 or 7 years are predictors of WB and/or HH and/or JS at 12 or 13 years. The percentage of explained variance of these FMS on MC tests is between 13–24%. Hop at 8 years explains 23% of the total variance of WB at 14 years. Object control sub-test at 8 years is also a predictor of WB at 14 years. At 13 and 14 years, MS and JS are predicted by locomotor sub-tests at 7 and 8 years, respectively.
For girls, the total variance explained by the models is between 19–75%. The adjustedR2for age groups 6–12, 7–13 and 8–14 years is between 38–75%, 38–55% and 19–61%, respectively. WB at 12 years and HH at 13 and 14 years are best explained by the same MC tests at younger ages. This is also observed for JS at 13 years. WB at 6 and 7 years is a predictor of JS at 12 and MS at 13 years. HH at 8 years explained 34% of the variance of MS at 14 years. Body mass is a negative predictor of MS, WB and JS at 13 or 14 years. The same is true for HH at 12 years, where sum of skin-folds at 6 years explained 41% of the variance. Standing long jump, sit and reach, shuttle run and plate tapping are predictors of MC tests. Standing long jump at 7 years explains 16% of variance of JS at 13 years. The sit and reach test at 8 years is also a predictor of HH, JS and MS at 14 years. The best predictor of WB at 13 years is shuttle run at 7 years. Plate tapping at 6 years explains 9% of the variance of JS at 12 years. Among FMS, gallop and locomotor sub-tests are predictors of MC. WB at 12 years and HH at 13 years are explained by gallop at younger ages. Explained variance is comprised between 11–18%. Locomotor sub-tests at 7 years explains 9% of variance of MS at 13 years. Leisure time physical activity at 6 years is also a predictor of MS at 12 years. Socioeconomic status and parental occupation are also predictors of JS and MS at 12 years. The variance explained is between 12–17%.
Discussion
The central aim of this longitudinal study was to investigate tracking of MC from childhood to early adolescence in a Portuguese sample from Madeira and Porto Santo islands. Over a time frame of 6 years, we observed a low-to-moderate tracking of MC tests and that predictors of MC were, predominantly, FMS, the same MC tests at baseline and/or physical fitness tests. Moreover, human physical growth characteristics and socioeconomic status showed low correlations with MC tests, whilst biological maturation did not contribute to prediction of MC.
The patterns of age-associated and sex-associated variation in MC tests of the current study are similar to other samples, although there is inconsistency across studies. In Flemish children, Vandorpe et al. (2011a) reported that each age group scored significantly better than their 1-year younger counterparts on all four sub-tests. These results are in line with our study since group 1 (6–12 years) showed a lower score than group 3 (8–14 years) or 2 (7–13 years), and that a time effect (within-subject effect) was observed for all MC tests. Significant sex differences were also found in the
Flemish sample. In WB, girls scored significantly better than boys for all but age group. On the HH, boys outscored the girls in every age group; both boys and girls did not score significantly differently on JS and MS. These data parallel the Madeira sample in HH, but differ in WB and MS. Two other studies documented these patterns in Portugal. A paper by Deus et al. (2008) followed 285 children, aged 6–10 years from Azores islands, longitudinally, and found an increase in MC scores in both sexes. Also in Azores, but using a large cross-sectional sample, Lopes et al. (2003) observed that boys outscored the girls in all MC tests. These results were partially achieved by our sample. In the scope of the Munich Longitudinal Study on the Ontogenesis of Individual Competencies, Ahnert et al. (2009) observed that MC tests generally increased from ages 8–12, with no reliable sex differences. Also in German children, aged 6–10 years, Willimczik (1980) did not find significant differences between the sexes in MC scores. On the contrary, significant age changes and some sex differences were found in 4007 Peruvian children, aged 6–11 years (Valdivia et al., 2008b).
It was expected that proficiency in MC will improve throughout childhood and early adolescence since some of the MC tasks require speed, agility or muscular power. However, this pattern was not observed in certain of the previous studies. In this regard, Branta et al. (1984) reported that, although children become taller, broader and stronger during middle childhood and early adolescence, it ignores the dependence of motor development on exposure to skills, opportunity for practice and interest and motivation and for these reasons the development of motor skills cannot be automatic. Biased sampling, secular changes, contamination of off-setting groups and changes in the test administration can also be responsible for the age changes reported by different studies. Interestingly, in the current study, boys displayed better MC scores than girls in HH and MS. Again, these differences during middle childhood are likely to be environmental rather than biological. Thomas and French (1985) suggested that, prior to puberty, most gender differ-ences in motor performance are socially induced by parents, peers, teachers and coaches, although differences are by no means uniform and may include some type of sex-related pre-disposition toward certain motor tasks. At puberty, sex differences in motor performance appear to be influenced by both biological and environmental factors.
Tracking or stability of MC is another issue addressed in this study. Overall, stability of MC tests was low-to-moderate, indicating that Madeira children proceeded at a different pace. Similar findings were found in Azorean children. Deus et al. (2008) reported correlations between 0.16–0.74 depending on the intervals over which MC tests were assessed. On the contrary, MC was found to be highly stable in Belgian (Vandorpe et al., 2011b) and German (Ahnert et al., 2009) school children. Vandorpe et al. (2011b) observed correlations comprised between 0.66 (aged 6–8 years) and 0.88 (aged 7–9 years), whilst Ahnert et al. (2009) found correlations of 0.76 (boys) and 0.72 (girls). Also in Germany, Willimczik (1980) reported correlations between 0.63 and 0.83 in MC tests. These three studies showed higher correlations than in Madeira and confirm the heterogeneity of MC over time. In this respect, Ahnert et al. (2009) stated
A. M. Antunes et al.
Ann Hum Biol Downloaded from informahealthcare.com by Universidade da Madeira on 07/31/15
that any comparison across studies should take into account the MC test, the age of the subjects, the achievement level and the measurement time interval to adequately access stability. As for change over time, inconsistency in stability coefficients of MC across studies is probably due to the study design, assessment strategies, variation in neuromuscular maturation, changes in body size and proportions, opportunity for practice, motivation and co-operation of the children to perform in the test situation (Ahnert et al., 2009; Malina et al., 2004).
The last issue dealt with in this study concerned the prediction of MC. Of interest, FMS, MC and physical fitness tests in middle childhood were the main predictors of MC in early adolescence. It was not a surprise that FMS were predictors of MC given the moderately high correlation reported in the literature between the two motor tasks. In the Netherlands, Smits-Engelsman et al. (1998) observed an overall correlation between the Movement ABC (Henderson & Sugden, 1992) and KTK batteries of 0.62 and suggested a general ‘‘motor ability’’ factor which underlies motor tasks of all types. The finding that an MC test at a younger age was a predictor of the same MC test 6 years later was not expected, considering the general low-to-moderate correlations observed in the current study. However, as stated before, a reasonably good tracking was observed in WB, HH and JS. The close association between MC and physical fitness found in Madeira children is also in agreement with previous research. Recently, Vandendriessche et al. (2011) reported a strong association (r¼0.79–0.87) between physical fitness and MC tests. Similarly, Haga (2008) found a close relation-ship between motor competence and physical fitness, sug-gesting a relatively strong covariance between the two sets of variables. Also, Barnett et al. (2008) found that object control proficiency in childhood was associated with adolescent cardiorespiratory fitness, accounting for 26% of fitness variation. Overall, the results of these studies support the idea that children with good FMS and high levels of physical fitness are more likely to become well-co-ordinated adoles-cents and vice-versa. The causal mechanism responsible for these associations is unclear (Marshall & Bouffard, 1997).
In Madeira children, the sum of skin-folds at 8 years was a predictor of HH and MS at 14 years. The same was true for HH at 12 years, where sum of skin-folds at 6 years explained 41% of the variance. The regression coefficients were negative, meaning that higher levels of body fatness were associated with poorer performance in MC. An inverse relationship between skin-folds and/or BMI with MC tests, mostly in HH and JS, was also observed in Azorean (Lopes et al., 2012a), Peruvian (Valdivia et al., 2008a), Belgian (D’Hondt et al., 2011, 2012; Vandendriessche et al., 2011) and North-American (Wrotniak et al., 2006) children. A reasonable explanation is that excess body fatness represents an inert load that must be moved (Malina et al., 2004). Interestingly, body mass-differences in MC were more pronounced in Madeira children that belonged to the older group (8–14 years) as was also reported by D’Hondt et al. (2011) in Flemish children. Also of interest was the fact that the ratio of sitting height to stature was a predictor of WB and, so, proportionality should be taken into account when investigating MC.
The finding that leisure time physical activity at 6 years was only a predictor of MS at 12 years, in girls, was unexpected since recent reports have suggested a positive relationship between physical activity and MC. For example, Vandorpe et al. (2011b) reported that children who consistently practiced sports in a club environment over the 3 years of testing displayed better co-ordination levels than children who only partially participated or did not participate in a club environment at all. Also D’Hondt et al. (2012) reported that the participation in organised sports within a sports club was a positive predictor of MC. Lopes et al. (2011) found that MC was an important predictor of physical activity in Azorean children. We could argue that the discrepancy between the findings of our study and the previous ones could be allocated to the questionnaire, i.e. the Baecke questionnaire (Baecke et al., 1982) was not sensitive enough to capture the subject’s physical activity. In order to minimise this possibility, the team members filled out the questionnaires by means of a face-to-face interview and children under 10 years of age and had the assistance of the teacher of physical education or a parent.
SES as a composite or through the parental occupation only entered into two regression models and explained 12% and 27% of the variance of JS and MS, respectively. The regression coefficients were positive, so low SES had a better performance than high SES in MC, since a lower score in the SES scale represents a higher SES. Our finding did not support previous research by Vandendriessche et al. (2012), who observed that high SES girls were more proficient than their peers from middle SES in JS, WB and HH. Valdivia et al. (2008b) reported that SES was not a relevant predictor of differences in MC profiles of Peruvian children. One plausible explanation for the Madeira data is that low SES children had a more permissive rearing atmosphere that might be conducive to greater freedom of activity and opportunity for practice and, in turn, compensate the higher MC noted in low SES (Malina et al., 2004).
Skeletal maturation in childhood was not a predictor of MC in early adolescence. Few other studies have considered maturity-associated variance in MC in these age intervals. Seils (1951) found low-to-moderate correlations between skeletal age and gross motor skill performance in primary-school children. Kerr (1975) used a serial tapping task to analyse movement control in 60 participants, aged 5, 7 and 9 years. No significant relationship was found between the fine motor task and skeletal age. In Belgian girls, 6–16 years old, the correlation coefficients between skeletal age and balance were low or non-significant (Beunen et al., 1997). The absence of a clear association between skeletal maturation and MC supports the idea that neuromuscular maturation could be dominant at earlier ages and this may not be related to skeletal maturation.
There are some weaknesses that need to be addressed when interpreting our results. First, physical activity was self-reported and questionnaire responses depend on the percep-tion, encoding, storage and retrieval of information (Shephard, 2003). Second, the three cohorts did not cover the entire growth period. Third, data quality was not assessed at time 2. On the other hand, this study was built on previous research (D’Hondt et al., 2011, 2012; Lopes et al., 2011,
DOI: 10.3109/03014460.2015.1058419 Change, stability and prediction of MC 9
Ann Hum Biol Downloaded from informahealthcare.com by Universidade da Madeira on 07/31/15
2012a,b; Valdivia et al., 2008b; Vandendriessche et al., 2011, 2012; Vandorpe et al., 2011a,b) by including FMS and biological maturation as predictors of MC, in addition to human physical growth, physical fitness, physical activity and SES. Other strengths lie in the stratified sampling procedure, a relatively large sample size and the high quality control of the data in time 1.
In summary, the present findings indicate that boys, on average, show better MC scores than girls and younger children tend to perform less proficiently than older peers. MC tracks at low-to-moderate levels during childhood and early adolescence and childhood predictors of MC at early adolescence are MC tests, human physical growth character-istics, physical fitness, FMS and SES. Furthermore, predictors of MC change over time and the relative contribution of these predictors also change with age. Given that FMS and physical fitness in childhood are predictors of MC in early adolescence it is crucial to enhance them to promote MC. Future longitudinal research using biological and environmental variables is justified to gain greater insight into the tracking of MC.
Acknowledgements
The ‘‘Healthy Growth of Madeira Study’’ was co-sponsored by the POPRAM III, within the scope of the European Social Funds, via CITMA and the Professional Qualification Centre. The second phase of this study was co-sponsored by the Government of Autonomous Region of Madeira through the Regional Secretary for Education and Human Resources.
Declaration of interest
The authors report no conflicts of interest. The authors alone are responsible for the content and writing of the paper.
References
AAHPERD. 1988. The AAHPERD Physical Best Program. Reston, VA: American Alliance for Health, Physical Education, Recreation and Dance.
Adam C, Klissouras V, Ravassolo M, Renson R, Tuxworth W, Kemper H, Van Mechelen W, et al. 1988. Eurofit. Handbook for the Eurofit Tests of Physical Fitness. Rome: Council of Europe: Committee for the Development of Sport.
Ahnert J, Schneider W, Bo¨s K. 2009. Developmental changes and individual stability of motor abilities from the preschool period to young adulthood. In: Schneider W, Bullock M, editors. Human development from early childhood to early adulthood: evidence from the Munich Longitudinal Study on the Genesis of Individual Competencies (LOGIC). Mahwah, NJ: Erlbaum. p 45–79.
Baecke JAH, Burema J, Frijters JER. 1982. A short questionnaire for the measurement of habitual physical activity in epidemiological studies. Am J Clin Nutr 36:936–942.
Barnett LM, van Beurden E, Morgan PJ, Brooks LO, Beard JR. 2008. Does childhood motor skill proficiency predict adolescent fitness? Med Sci Sports Exerc 40:2137–2144.
Beunen GP, Malina RM, Lefevre J, Claessens AL, Renson R, Kanden Eynde B, Vanreusel B, Simons J. 1997. Skeletal maturation, somatic growth and physical fitness in girls 6–16 years of age. Int J Sports Med 18:413–419.
Branta C, Haubenstricker J, Seefeldt V. 1984. Age changes in motor skills during childhood and adolescence. Exerc Sport Sci Rev. 12:467–520.
Claessens ALM, Eynde BV, Renson R, Gerven DV. 1990. The description of tests and measurements. In: Simons J, Beunen G, Renson R, Claessens A, Vanreusel B, Lefevre J, editors. Growth and Fitness of Flemish Girls – The Leuven Growth Study. Champaign, IL: Human Kinetics. p 175.
Deus RKBC, Bustamante A, Lopes VP, Seabra AFT, Silva RMG, Maia JAR. 2008. Coordenac¸a˜o motora: estudo de tracking em crianc¸as dos 6 aos 10 anos da Regia˜o Auto´noma dos Ac¸ores. Portugal. Rev Bras Cineantropom Desempenho Hum 10:215–222.
D’Hondt E, Deforche B, Gentier I, De Bourdeaudhuij I, Vaeyens R, Philippaerts R, Lenoir M. 2012. A longitudinal analysis of gross motor coordination in overweight and obese children versus normal-weight peers. Int J Obesity 37:61–67.
D’Hondt E, Deforche B, Vaeyens R, Vandorpe B, Vandendriessche J, Pion J, Philippaerts R, de Bourdeaudhuij I, Lenoir M. 2011. Gross motor coordination in relation to weight status and age in 5- to 12-year-old boys and girls: a cross-sectional study. Int J Pediatr Obesity 6: e556–e564.
Fisher A, Reilly JJ, Kelly LA, Montgomery C, Williamson A, Paton JY, Grant S. 2005. Fundamental movement skills and habitual physical activity in young children. Med Sci Sports Exerc 37:684–688. Foulkes MA, Davies LE. 1981. An index of tracking for longitudinal
data. Biometrics 37:439–446.
Freitas D, Maia J, Beunen G, Claessens A, Thomis M, Marques A, Crespo M, Lefevre, J. 2007. Socio-economic status, growth, physical activity and fitness: The Madeira Growth Study. Ann Hum Biol 34: 107–122.
Freitas D, Maia J, Beunen G, Lefevre J, Claessens A, Marques A, Rodrigues A, et al. 2004. Skeletal maturity and socio-economic status in Portuguese children and youths: the Madeira Growth Study. Ann Hum Biol 31:408–420.
Graffar M. 1956. Une me´thode de classification sociale d’e´chantillons de population. Courrier VI:455–459.
Haga M. 2008. The relationship between physical fitness and motor competence in children. Child Care Health Dev 34:329–334. Henderson SE, Sugden DA. 1992. The Movement Assessment Battery
for Children: Manual. London: The Psychological Corporation. p 240. IBM Corp. 2012. IBM SPSS Statistics for Windows, Version 19.0.
Armonk, NY: IBM Corp.
International Standard Classification of Education, 1997. ISCED 1997. United Nations Educational, Scientific and Cultural Organization. UNESCO-UIS; 2006.
Kerr R. 1975. Movement control and maturation in elementary-grade children. Percept Mot Skills 41:151–154.
Kiphard EJ, Schilling F. 1974. Ko¨rper-koordinations-test fu¨r kinder. KTK Manual. Weiheim: Beltz Test GmbH. p 53.
Kiphard EJ, Schilling F. 2007. Ko¨rperkoordinationstest fu¨r Kinder 2. U¨ berarbeitete und erga¨nzte Auflage. Weinheim: Beltz Test GmbH. p 78. Lopes VP, Maia JAR, Rodrigues LP, Malina R. 2012a. Motor coordination, physical activity and fitness as predictors of longitudinal change in adiposity during childhood. Eur J Sport Sci 12: 384–391.
Lopes VP, Maia JAR, Silva RG, Seabra A, Morais FP. 2003. Estudo do nı´vel de desenvolvimento da coordenac¸a˜o motora da populac¸a˜o escolar (6 a 10 anos de idade) da Regia˜o Auto´noma dos Ac¸ores. Rev Port Cien Desp 3:47–60.
Lopes VP, Rodrigues LP, Maia JAR, Malina RM. 2011. Motor coordination as predictor of physical activity in childhood. Scand J Med Sci Sports 21:663–669.
Lopes VP, Stodden DF, Bianchi MM, Maia JAR, Rodrigues LP. 2012b. Correlation between BMI and motor coordination in children. J Sci Med Sport 15:38–43.
Malina RM, Bouchard C, Bar-Or O. 2004. Growth, maturation, and physical activity. 2nd ed. Champain, IL: Human Kinetics Publishers. p 712.
Marshall JD, Bouffard M. 1997. The effects of quality daily physical education on movement competency in obese versus nonobese children. Adapt Phys Act Q 14:222–237.
Philippaerts RM, Matton L, Wijndaele K, Balduck AL, De Bourdeaudhuij I, Lefevre J. 2006. Validity of a physical activity computer questionnaire in 12- to 18-year-old boys and girls. Int J Sports Med 27:131–136.
Seils LG. 1951. The relationship between measures of physical growth and gross motor performance of primary-grade school children. Res Q 22:244–260.
Shephard R. 2003. Limits to the measurement of habitual physical activity by questionnaires. Br J Sports Med 37:197–206.
Smits-Engelsman BCM, Henderson SE, Michels CGJ. 1998. The assessment of children with developmental coordination disorders in the Netherlands: the relationship between the movement assessment A. M. Antunes et al.
Ann Hum Biol Downloaded from informahealthcare.com by Universidade da Madeira on 07/31/15
battery for children and the Ko¨rperkoordinations Test fu¨r Kinder. Hum Mov Sci 17:699–709.
StataCorp. 2009. Stata Statistical Software: Release 11. College Station, TX: StataCorp LP.
Statistics Portugal. 1995. Antecedentes, Metodologia e Conceitos: Censos 91. Lisboa: Instituto Nacional de Estatı´stica. p 147. Stodden DF, Goodway JD, Langendorfer SJ, Roberton MA, Rudisill ME,
Garcia C, Garcia LE. A 2008. Developmental perspective on the role of motor skill competence in physical activity: an emergent relation-ship. Quest 60:290–306.
Tabachnick BG, Fidell LS. 2014. Using multivariate statistics. 6th ed. Boston, MA: Pearson Education Limited.
Tanner JM, Healy MJR, Goldstein H, Cameron N. 2001. Assessment of skeletal maturity and prediction of adult height (TW3 Method). 3rd ed. Saunders: Harcourt Publishers Limited. p 110.
Thomas JR, French KE. 1985. Gender differences across age in motor performance: a meta-analysis. Psychol Bull 98:260–282.
Ulrich AD. 2000. Test of Gross Motor Development. Examiner’s Manual. 2nd ed. Austin, TX: Pro-ed. p 60.
Valdivia AB, Cartagena LC, Sarria NE, Ta´vara IS, Seabra AFT, Silva RMG, Maia JAR. 2008a. Coordinacio´n motora: influencia de la edad, sexo, estatus socio-econo´mico y niveles de adiposidad en nin˜os peruanos. Rev Bras Cineantropom Desempenho Hum 10:25–34. Valdivia AB, Lara RF, Espinoza CB, Pomahuacre SQ, Ramos GR,
Seabra A, Garganta R, Maia J. 2008b. Prontitud coordinativa: perfiles
multivariados en funcio´n de la edad, sexo y estatus socio-econo´mico. Rev Port Cien Desp 8:34–46.
Vandendriessche JB, Vandorpe B, Coelho-e-Silva MJ, Vaeyens R, Lenoir M, Lefevre J, Philippaerts RM. 2011. Multivariate association among morphology, fitness, and motor coordination characteristics in boys age 7 to 11. Pediatr Exerc Sci 23:504–520.
Vandendriessche JB, Vandorpe BFR, Vaeyens R, Malina RM, Lefevre J, Lenoir M, Philippaerts RM. 2012. Variation in sport participation, fitness and motor coordination with socioeconomic status among Flemish children. Pediatr Exerc Sci 24:113–118.
Vandorpe B, Vandendriessche J, Lefevre J, Pion J, Vaeyens R, Matthys S, Philippaerts R, Lenoir M. 2011a. The Ko¨rperkoordinationsTest fu¨r Kinder: reference values and suitability for 6-12-year-old children in Flanders. Scand J Med Sci Sports 21:378–388.
Vandorpe B, Vandendriessche J, Vaeyens R, Pion J, Matthys S, Lefevre J, Philippaerts R, Lenoir M. 2011b. Relationship between sports participation and the level of motor coordination in childhood: a longitudinal approach. J Sci Med Sport 15:3:220–225.
Willimczik K. 1980. Development of motor control capability (body coordination) of 6-to 10-year-old children: results of a longitudinal study.In: Ostyn M, Beunen G, Simons J, editors. Kinanthropometry II. Baltimore, MD: University Park Press. p 328–346.
Wrotniak BH, Epstein LH, Dorn JM, Jones KE, Kondilis VA. 2006. The relationship between motor proficiency and physical activity in children. Pediatrics 118:e1758–e1765.
DOI: 10.3109/03014460.2015.1058419 Change, stability and prediction of MC 11
Ann Hum Biol Downloaded from informahealthcare.com by Universidade da Madeira on 07/31/15