O R I G I N A L A R T I C L E
Body mass index and motor coordination: Non
‐
linear
relationships in children 6
–
10 years
V. P. Lopes
1|
R. M. Malina
2|
J. A. R. Maia
3|
L. P. Rodrigues
41Research Center in Sports Sciences, Health
Sciences and Human Development (CIDESD), Sport Science Department of Polytechnic Institute of Bragança, Bragança, Portugal
2Department of Kinesiology and Health
Education, University of Texas at Austin, Austin, TX, US
3Faculty of Sport, University of Porto, Porto,
Portugal
4Escola Superior Desporto e Lazer de
Melgaço, Instituto Politécnico de Viana do Castelo, and CIDESD, Viana do Castelo, Portugal
Correspondence
Vitor P. Lopes, School of Education of Polytechnic Institute of Bragança, Campus de Santa Apolónia, Bragança 5301‐856, Portugal.
Email: [email protected]
Funding information
Portuguese Foundation for Science and Tech-nology, Grant/Award Numbers: DTP/04045/ 2013, POCI‐01‐0145‐FEDER‐006969, UID/
DTP/00617/2013 and POCI‐01‐0145‐
FEDER‐006969; NORTE 2020, Grant/Award
Number: NORTE‐01‐0145‐FEDER‐000016
Abstract
Background:
Given the concern for health‐related consequences of an elevated body massindex (BMI; obesity), the potential consequences of a low BMI in children are often overlooked.
The purpose was to evaluate the relationship between the BMI across its entire spectrum and
motor coordination (MC) in children 6–10 years.
Methods:
Height, weight, and MC (Körperkoordinationstest für Kinder, KTK test battery) were measured in 1,912 boys and 1,826 girls of 6–10 years of age. BMI (kg/m2) was calculated.KTK scores for each of the four tests were also converted to a motor quotient (MQ). One‐way
ANOVA was used to test differences in the BMI, individual test items, and MQ among boys
and girls within age groups. Sex‐specific quadratic regressions of individual KTK items and the
MQ on the BMI were calculated. Girls and boys were also classified into four weight status
groups using International Obesity Task Force criteria: thin, normal, overweight, and obese.
Differences in specific test items and MQ between weight status groups were evaluated by
age group in each sex.
Results:
Thirty‐one percent of the sample was overweight or obese, whereas 5% was thin. Onaverage, normal weight children had the highest MQ in both sexes across the age range with few
exceptions. Overweight/obese children had a lower MQ than normal weight and thin children.
The quadratic regression lines generally presented an inverted parabolic relationship between
the BMI and MC and suggested a decrease in MC with an increase in the BMI.
Conclusion:
In general, BMI shows a curvilinear, inverted parabolic relationship with MC in children 6–10 years.K E Y W O R D S
childhood, motor performance, motor proficiency, obesity, thinness, weight status
1
|I N T R O D U C T I O N
The increasing prevalence of overweight/obesity among children
and adolescents is a major health concern with an estimated
prev-alence of 24% in boys and girls in developed countries in 2013
(World Health Organization [WHO], 2016). Conversely,
correspond-ing estimates in developcorrespond-ing countries range from 8% to 13% in
both boys and girls (Ng et al., 2014). Although the prevalence of
obesity appears to be reaching a plateau in some countries,
abso-lute numbers of overweight and obese children have increased
more in low and middle income countries than in high‐income ones
(WHO, 2016).
The use of the body mass index (BMI) to specify overweight and
obesity is often referred to in the context of excessive fatness. This is
naturally relevant to motor performance and physical fitness, because
excess fatness generally exerts a negative influence on tasks which
require the movement or projection of the body through space, as
in runs and jumps (Malina, 1975). Available data indicate a negative
relationship between the BMI and fundamental motor skills (Duncan,
Bryant, & Stodden, 2016) and motor coordination (MC; Lopes,
Stodden, Bianchi, Maia, & Rodrigues, 2012) in children. Studies have
also shown that children with a higher level of MC tend to have
lower BMIs (Martins et al., 2010), whereas children identified as
clumsy have a higher level of relative fatness (Hay, Hawes, & Faught, DOI: 10.1111/cch.12557
2004). Negative associations between the BMI and indicators of
fit-ness have also been noted (He et al., 2011; Mcgavock, Torrance,
Mcguire, Wozny, & Lewanczuk, 2009). A variety of studies have
addressed relationships between the BMI and motor performance
and fitness, but they have generally compared individuals classified
as normal weight and overweight/obese, and/or have generally used
linear association methods. Results generally show a linear negative
relationship between BMI and fitness, especially when focused on
overweight/obese individuals.
Until recently, studies have not ordinarily considered performance
and fitness in samples with BMIs that span the spectrum from thinness
through obesity, and only several have considered potential non‐linear
relationships (Bovet, Auguste, & Burdette, 2007; Huang & Malina,
2007; Huang & Malina, 2010; Sekulić, Zenić, & Marković, 2005).
Observations for a national sample of Taiwanese youth 9–18 years,
for example, have generally indicated inverted parabolic relationships
between BMI and four fitness tests across age groups in both sexes,
although relationships varied among tests (Huang & Malina, 2010).
Given concern for the health‐related consequences of an elevated
BMI, the potential consequences of a low BMI for indicators of
movement proficiency are often overlooked and highlight the need
to consider different aspects of motor performance in children with
BMIs spanning the spectrum from thin to obese. In this context, the
purpose of this study is to evaluate the non‐linear relationships
between the BMI and MC in children 6–10 years with BMIs spanning
the spectrum from low (thin) to high (obese). MC was assessed with
the Körperkoordinationstest für Kinder (KTK; Body Coordination Test
for Children; Kiphard & Schilling, 1974, 2007). To our knowledge,
stud-ies to date have not considered relationships between the BMI and
performances on this MC test across the full spectrum of BMI. As
suggested in several earlier studies (Huang & Malina, 2007; Huang &
Malina, 2010; Lopes et al., 2017), a curvilinear relationship expressed
in an inverted parabolic form was anticipated, with children with lower
and higher BMIs showing poorer levels of MC.
2
|M E T H O D S
2.1
|Participants
The study was approved by the ethical committee of the local health
authority in the Azores islands, Portugal, and by the institution of the
first author. Participants were elementary school children
(N= 3,738), 1,826 girls and 1,912 boys, 6 to 10 years of age, from
the Azores islands, Portugal. Written informed consent was obtained
from the parents of each child.
The prevalence of overweight/obesity of Azores islands in
chil-dren is about 30% (Maia & Iopes, 2007). The Human Development
Index for the region was 0.903 in 2013 and was comparable with most
European countries.
2.2
|Field methods
Data were collected by four teams of teachers who were trained in
the methods of measuring height and weight and in administering
the MC tests.
2.3
|Body size
Height was measured with an anthropometer to 0.1 cm, and weight
was measured with a digital scale (SECA, Hamburg, Germany) to
0.1 kg using standard procedures. Intraclass correlations based on
replicate measurements varied between 0.92 and 0.99 for height and
between 0.94 and 0.99 for weight, whereas technical errors of
measurement for height varied between 0.20 cm and 0.91 cm. The
BMI (kg/m2) was calculated. Weight status of each child was classified
as thin, normal, overweight, or obese using the sex‐specific
Interna-tional Obesity Task Force (IOTF) cut‐off values for children
(Cole, Bellizzi, Flegal, & Dietz, 2000; Cole, Flegal, Nicholls, & Jackson,
2007). Although a low BMI is sometimes indicated as underweight,
the label thin was recommended by the IOTF (Cole et al., 2007).
2.4
|Motor coordination
The KTK (Kiphard & Schilling, 1974, 2007) includes four items:
(a) walking backwards along balance beams of decreasing width
(6.0, 4.5, and 3.0 cm), (b) moving sideways on wooden boards during
20 s, (c) jumping sideways over a slat for 15 s, and (d) hopping over
foam obstacles with increasing height in consecutive steps of 5 cm.
The raw performance scores for each test item were converted to a
standardized score relative to sex‐and age‐specific reference values
for the population upon which the KTK was established (Kiphard &
Schilling, 1974). The sum of standardized scores for the four
items provided an overall motor quotient (MQ). Reported reliability
coefficients for the KTK ranged from 0.80 to 0.96 for individual tests;
the coefficient was 0.97 for the total battery (Kiphard & Schilling,
1974, 2007). Reliabilities in the present study (intraclass correlations)
varied between 0.75 and 0.91.
2.5
|Data analysis
Descriptive statistics for age, the BMI, each coordination test, and the
MQ were calculated. One‐way analysis of variance was used to test
Key messages
• The relationship between the body mass index (BMI) and
motor coordination (MC) is variable among tasks.
• The evidence suggested a curvilinear relationship
between the BMI and MC—a low weight‐for‐height
and especially a high weight‐for‐height have the
potential to negatively influence on MC.
• Children, especially older children 8–10 years, with
intermediate BMIs tended to have, on average, better
MC than those with low and high BMI values.
• The relationship between BMI and MC was generally
similar in boys and girls.
• Overall, underweight (thin) youth had lower MC scores
than normal weight youth, but both generally
sex differences in the BMI, KTK items, and MQ in single year age
groups and to test corresponding differences between single year
age groups within each sex.
Sex‐specific regressions of each individual test and the MQ on the
BMI were also performed in single year age groups. This was done so
as both the BMI and performances on each test increase, on average,
with age. Given observations on relationships between fitness items
and the BMI in older youth (Huang & Malina, 2010), a quadratic
regres-sion model was used as it permits testing of the expected non‐linear
relationships. The KTK test item or the MQ was the dependent
variable, whereas the BMI and BMI2were the independent variables
as follows:
MQ¼aþbBMI þcBM2
; (1)
where a, b, and c were constant.
Performances on each of the four KTK tests and subsequently the
MQ were calculated for boys and girls in each weight status category
(thin, normal, overweight, and obese) by age. The Kruskal–Wallis test
was used to evaluate potential differences in the KTK results among
weight status groups by age and sex. Significance for all analyses was
set atp≤.05.
3
|R E S U L T S
Descriptive statistics are summarized by age groups within sex in
Table 1. The heights of both boys and girls approximate, on average,
the age and sex‐specific medians of the WHO (2006) reference. As
expected, the BMI increases, in general, with age in boys and girls
(boys,F4, 1907= 14.1;p< .001; girls,F4, 1827= 16.2;p< .001).
Performances on each MC test increase also with age in both
sexes, but the MQ declines, in general, with age. There is considerable
overlap in performance scores for each KTK item between sexes
across the age range, but the MQ is, on average, significantly higher
in boys compared with girls. Within each sex, older children tend to
have significantly lower MQs than younger children (boys, F4,
1907= 8.9;p< .001; and girls,F4, 1827= 26.0;p< .001).
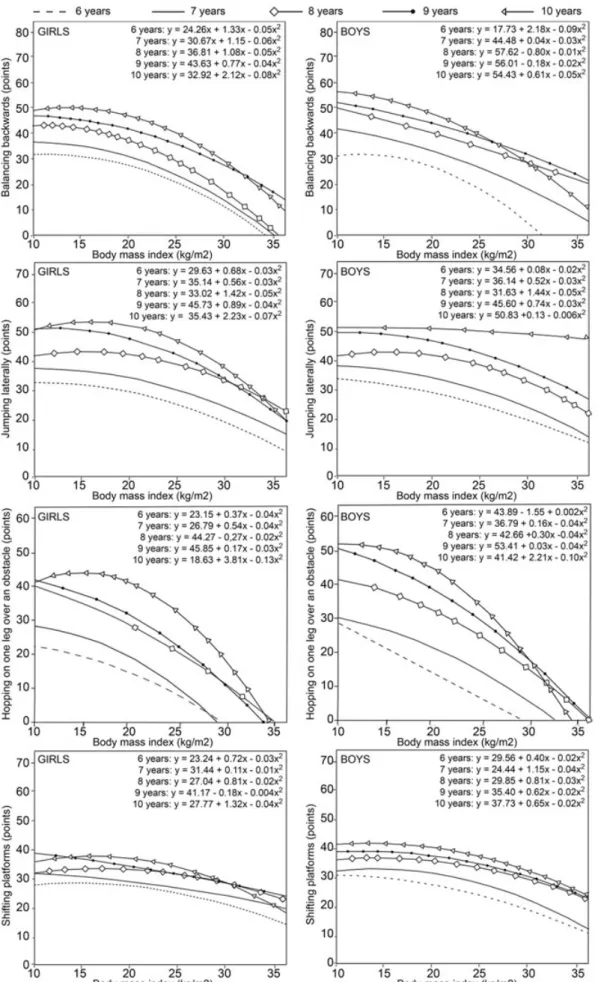
Relationships between the BMI and each MC test item in the five
age groups of girls and boys based on quadratic regressions are
illus-trated in Figure 1. The figure also includes the results of the quadratic
regression models.
For balancing backwards (Figure 1), the relationship is curvilinear
in each age group of girls, whereas a curvilinear relationship is
sug-gested only at 6 and 10 years in boys. In all age groups except 6 years,
the quadratic term of the regression equation is lower in boys than in
girls and is apparent in a steeper decline in performance with an
increasing BMI in girls than in boys.
A similar curvilinear relationship at all ages in girls and at all ages
except 10 years in boys is suggested for jumping laterally (Figure 1).
The decline in performance at higher BMIs is generally similar in both
sexes.
Curvilinear relationships between performances on the one leg
hopping test and the BMI are suggested in both sexes and all age
groups except 6 years (Figure 1). The slopes of the decrease in
perfor-mance with an increase in the BMI are similar in girls and boys and are
especially marked among 10 year old children.
In contrast, relatively slight curvilinear relationships between
per-formances on the shifting platform test and the BMI are suggested in
each age group of boys (Figure 1). Trends in girls are more variable;
they suggest a linear decline in performance with an increasing BMI
in at 7 and 9 years but a curvilinear relationship at 6, 8, and 10 years.
Corresponding quadratic regressions for the MQ are illustrated in
Figure 2. Curvilinear relationships between the BMI and MQ are
indi-cated in girls, especially at 10 years. Curvilinear relationships are quite
similar in boys at all ages.
Multiple correlations (R) between the BMI and individual KTK
items, and the MQ, and the common variance (R2) based on the
qua-dratic regression model for each item in girls and boys by age group
TABLE 1 Sample sizes and means (M) and standard deviations (SD) for age, height, weight, BMI, individual KTK test items, and the motor quotient
by sex and age group
Individual KTK test items Balance
backward
Jumping laterally
Hopping one leg
Shifting platforms Age, years Height, cm Weight, kg BMI, kg/m2
nsteps njumps Height, cm ntransfers Motor quotient
Age group n M SD M SD M SD M SD M SD M SD M SD M SD M SD
Girls
6 269 6.7 0.2 123.9 44.6 25.1 5.2 17.3 2.7 29.4 12.3 30.1 8.0 17.5 9.9 14.1 2.7 83.6 12.3
7 430 7.5 0.4 124.3 5.9 27.4 6.5 17.5 3.1 32.7 13.2 35.3 10.9 23.4 11.7 14.9 3.1 82.7 14.8
8 427 8.5 0.4 131.3 29.3 30.4 7.0 17.9 3.1 40.1 12.9 43.2 11.8 31.1 11.2 16.8 2.9 86.0 13.6
9 459 9.5 0.4 135.0 6.5 34.4 8.2 18.8 3.3 42.3 12.9 48.7 11.6 35.4 13.8 18.1 3.2 79.2 14.6
10 241 10.4 0.4 139.1 7.5 36.9 9.5 18.9 3.6 44.1 13.7 51.7 12.0 40.8 14.3 18.8 3.2 75.9 14.0
Boys
6 286 6.7 0.2 120.3 5.3 24.8 4.6 17.0 2.3 29.2 11.9 30.9 8.7 17.9 10.9 14.8 2.8 93.0 12.3
7 452 7.5 0.4 126.5 28.0 27.8 6.6 17.6 3.1 35.4 13.0 35.4 9.4 26.7 12.8 15.8 3.2 91.0 14.2
8 464 8.5 0.4 131.5 24.3 31.2 7.7 18.2 3.6 40.6 13.5 41.7 11.9 34.2 14.3 17.6 3.4 88.2 15.6
9 429 9.5 0.4 135.3 6.5 34.3 8.8 18.6 3.6 45.1 13.4 46.9 12.4 41.1 13.8 19.1 3.6 88.8 14.3
10 281 10.4 0.4 138.5 6.3 36.0 8.8 18.6 3.4 49.6 13.5 51.3 12.6 46.9 15.2 20.6 3.5 86.9 15.1
are summarized in Table 2. TheR2values, which indicate the percent-age of the variance in each KTK test explained by the model, are low
and at best moderate. The explained variance is similar in girls and boys
and varies from 0% to 5% for jumping laterally, from 1% to 8% for
shifting platforms, from 3% to 11% for balancing backwards, and from
7% to 23% for hopping on one leg.R2values for the MQ vary between
6% and 16% and are similar in both girls and boys.
Distributions of subjects by weight status within each age group
of girls and boys are summarized in Table 3. Overall, about 5% of the
children are classified as thin, whereas 31% are classified as
over-weight or obese. Differences among over-weight status groups for each
KTK test (Table 4) are significant at all ages among children 7 through
10 years with the exception of shifting platforms (girls 8 years) and
jumping laterally (boys 10 years). Among 6‐year‐old children, in
con-trast, performances on shifting platforms do not differ significantly
among weight status groups of girls and boys, whereas performances
on balancing backwards and jumping laterally do not differ among
weight status groups of boys. The comparisons, of course, should be
tempered by the relatively small number of children classified as thin
(Table 3). Nevertheless, the trend across weight status categories in
each sex is generally similar to the regressions (Figure 1). Performance
differences between thin and normal weight children are generally
small, and performances are, on average, better than those of
over-weight and obese children for the KTK tests.
Corresponding statistics for the MQ of children by weight status
categories are also summarized in Table 4. Overall differences among
each age group of girls and boys are significant. Among girls, mean
MQs show the following gradient at 6 and 7 years: thin = normal
weight > overweight > obese; the gradient for girls is modified
some-what at 8, 9, and 10 years: thin < normal weight > overweight > obese.
Among boys, the gradient at 6 years is as follows: thin > normal
weight > overweight > obese, and is slightly modified at 7 and 9 years:
thin = normal weight > overweight > obese, and at 8 and 10 years:
thin < normal weight > overweight > obese.
4
|D I S C U S S I O N
Non‐linear relationships between the BMI and MC were considered in
a cross‐sectional sample of Portuguese children 6–10 years of age.
FIGURE 2 Relationship between the body mass index and motor quotient in girls and boys in five age groups
TABLE 2 Multiple correlations (R) and common variance (R2) for each quadratic regression model, in girls and boys by age group. Sample sizes are
as in Table 1
Individual KTK test items
Balancing backwards Jumping laterally Hopping one leg Shifting platforms Motor quotient
Age group R R2 R R2 R R2 R R2 R R2
Girls
6 0.17 0.03 0.18 0.03 0.27 0.07 0.10 0.01 0.24 0.06
7 0.29 0.08 0.20 0.04 0.30 0.09 0.17 0.03 0.31 0.10
8 0.23 0.05 0.14 0.02 0.36 0.13 0.11 0.01 0.27 0.08
9 0.26 0.07 0.19 0.04 0.33 0.11 0.19 0.04 0.31 0.10
10 0.31 0.09 0.22 0.05 0.48 0.23 0.24 0.06 0.40 0.16
Boys
6 0.18 0.03 0.14 0.02 0.31 0.09 0.16 0.03 0.25 0.06
7 0.29 0.09 0.25 0.07 0.37 0.14 0.28 0.08 0.39 0.15
8 0.29 0.09 0.22 0.05 0.38 0.15 0.25 0.06 0.32 0.10
9 0.30 0.09 0.24 0.06 0.41 0.17 0.24 0.06 0.39 0.14
10 0.33 0.11 0.03 0.00 0.39 0.16 0.18 0.03 0.30 0.08
Relative to IOTF criteria, 31% of the sample was overweight or obese,
which was consistent with data for Portuguese children of about the
same age, 31.5% (Padez, Fernandes, Mourão, Moreira, & Rosado,
2004). In contrast, only 3% to 5% of the sample was classified as thin.
The MQs of the Azorean children did not increase with age,
con-trary to expectations. Nine‐and 10‐year‐old children of both sexes
had, on average, a lower MQ than younger children. The MQ is sex‐
specific and adjusted for age and is based on the reference sample of
German children upon whom the KTK test was developed. In contrast,
some evidence has indicated an increase in the MQ with age, but the
direction and significance of the differences between age groups were
variable (D'hondt et al., 2013).
The negative influence of excess weight, specifically in the form of
obesity, on the MC, motor performance, and physical fitness of youth
is well established. The literature has typically compared overweight
and obese children with normal weight children (Cruz, Sequeira,
Gomes, Pinto, & Marques, 2011; D'hondt et al., 2011; Gonzalez‐Suarez
et al., 2013; Joshi, Bryan, & Howat, 2012; Lopes et al., 2012; Lopes,
Stodden, & Rodrigues, 2014; Rodrigues, Stodden, & Lopes, 2016;
Vandendriessche et al., 2011). Consistent with the literature,
over-weight and obese Azorean children generally possessed lower MQs
than this and normal weight children.
In contrast, variation in MC, motor performance, and fitness across
the spectrum of BMIs in samples of youth has received less attention.
Results of quadratic regressions for the MQ in Azorean children 6 to
10 years were generally consistent with observations for an index of
fitness based on four tests in four age groups of Taiwanese youth
(9–10, 11–12, 13–15, and 16–18 years). The quadratic relationship
between the BMI and the index of fitness index was apparent in
girls of all ages and in boys <13 years of age; results, however, were
variable among boys >13 years (Huang & Malina, 2007).
Regressions for individual fitness items among Taiwanese youth
varied somewhat with age and sex, but higher BMIs were associated
with poorer performances on each test (Huang & Malina, 2010). With
few exceptions, the observations in Azorean children 6–10 years
showed generally similar results for individual KTK tests in both sexes.
The results for children 8 to 10 years suggested, in general, an inverted
parabolic relationship between individual coordination tests and the
BMI, that is, a negative influence of a low and especially a high BMI
on each MC test; the range of BMIs associated with better MC scores
also showed a parabolic relationship. On the other hand, the
relation-ship appeared to be more linear among children 6 to 7 years so that
children with higher BMI had lower performances in the MC tests.
Corresponding studies of motor performance and fitness of
chil-dren across the range of BMIs from thinness to obesity are limited.
Nevertheless, relationships between the BMI and indicators of fitness
were generally curvilinear among youth 12–15 years (Bovet et al.,
2007) and young adults (Sekulićet al., 2005; Welon, Jurynec, & W,
Ś., 1988).
Observations for several physical fitness items among Spanish
adolescents 13–18 years classified as underweight, normal weight,
and overweight/obese (Artero et al., 2010) were generally consistent
with those for MC among Azorean children. Underweight and
over-weight/obese Spanish adolescents had lower physical fitness scores
compared with normal weight youth in fitness tests requiring the
pro-jection of the body through space (20‐m shuttle run, standing long
jump, and 4 × 10 shuttle run) or support of the body off of the ground
(bent arm hang); lowest fitness performances were especially apparent
in overweight/obese youth. On the other hand, overweight and obese
adolescents performed better in grip strength (Artero et al., 2010).
Lower levels of physical activity and reduced performances on
health‐related physical fitness tests were observed in underweight
and obese compared with normal weight Spanish youth 13–18 years
(Artero et al., 2010). Overall, underweight (thin) youth had lower
phys-ical fitness scores than normal weight youth, but both thin and normal
weight youth generally performed better than overweight/obese
youth in fitness tests requiring projection of the body through space
(20‐m shuttle run, standing long jump, and 4 × 10 shuttle run). Two
other fitness tests presented exceptions to this pattern. Overweight/
obese youth performed better in static grip strength (i.e., does not
require movement of the body through space), whereas underweight
(thin) youth performed better in the flexed (bent) arm hang which
requires the body to be supported off the ground (Artero et al., 2010).
The relationship between the BMI and motor tasks thus depends,
in part, on whether the task requires the movement or projection of
body mass through space or support of the body mass off of the
ground. Overweight/obesity is not a negative factor in the
perfor-mance of some physical fitness tasks, specifically those that do not
require the movement or projection of body mass through space.
However, excess body mass exerts a negative influence on tasks
where the body is moved or projected through space, as in runs and
jumps, or the lifting and supporting of the body off the ground, as in
pull‐ups and the flexed arm hang (Malina, Bouchard, & Bar‐Or, 2004).
This factor perhaps influenced the relationship noted between the
BMI and the hopping test of the KTK battery; the BMI explained the
highest proportion of variance in this MC test. As such, the negative
influence of the BMI on the hopping test also affected, to some extent,
the association between the MQ, a composite of the four MC tests,
and the BMI.
In contrast, relationships between the BMI and motor
perfor-mance were somewhat variable among with a history of chronic
TABLE 3 Distributions (frequencies [f] and percentages [%]) of girls
and boys by weight status with age groups
Weight status
Thin Normal Overweight Obese
Age group n f % f % f % f %
Girls
6 269 7 3 151 58 70 26 35 13
7 430 12 3 275 64 85 20 58 13
8 427 12 3 283 66 81 19 51 12
9 459 19 4 270 59 120 26 50 11
10 241 7 3 158 66 48 20 28 12
Boys
6 286 13 5 197 69 46 16 30 10
7 452 12 3 316 70 66 15 58 13
8 464 14 3 309 67 83 18 58 13
9 429 15 3 288 67 77 18 49 11
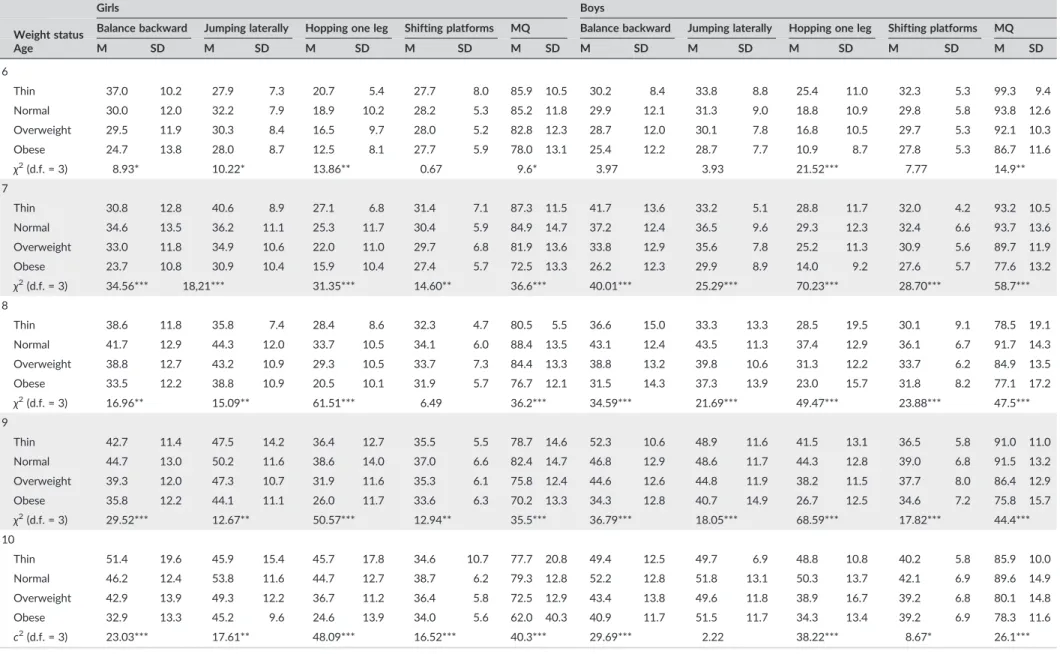
TABLE 4 Means (M) and standard deviations (SD) for individual Körperkoordinationstest für Kinder test items and the motor quotient (MQ) by weight status in each age group of girls and boys, and results of
the Kruskal–Wallis test for differences in individual Körperkoordinationstest für Kinder test items between weight status groups within each age group by sex
Girls Boys
Weight status Balance backward Jumping laterally Hopping one leg Shifting platforms MQ Balance backward Jumping laterally Hopping one leg Shifting platforms MQ
Age M SD M SD M SD M SD M SD M SD M SD M SD M SD M SD
6
Thin 37.0 10.2 27.9 7.3 20.7 5.4 27.7 8.0 85.9 10.5 30.2 8.4 33.8 8.8 25.4 11.0 32.3 5.3 99.3 9.4
Normal 30.0 12.0 32.2 7.9 18.9 10.2 28.2 5.3 85.2 11.8 29.9 12.1 31.3 9.0 18.8 10.9 29.8 5.8 93.8 12.6
Overweight 29.5 11.9 30.3 8.4 16.5 9.7 28.0 5.2 82.8 12.3 28.7 12.0 30.1 7.8 16.8 10.5 29.7 5.3 92.1 10.3
Obese 24.7 13.8 28.0 8.7 12.5 8.1 27.7 5.9 78.0 13.1 25.4 12.2 28.7 7.7 10.9 8.7 27.8 5.3 86.7 11.6
χ2(d.f. = 3) 8.93* 10.22* 13.86** 0.67 9.6* 3.97 3.93 21.52*** 7.77 14.9**
7
Thin 30.8 12.8 40.6 8.9 27.1 6.8 31.4 7.1 87.3 11.5 41.7 13.6 33.2 5.1 28.8 11.7 32.0 4.2 93.2 10.5
Normal 34.6 13.5 36.2 11.1 25.3 11.7 30.4 5.9 84.9 14.7 37.2 12.4 36.5 9.6 29.3 12.3 32.4 6.6 93.7 13.6
Overweight 33.0 11.8 34.9 10.6 22.0 11.0 29.7 6.8 81.9 13.6 33.8 12.9 35.6 7.8 25.2 11.3 30.9 5.6 89.7 11.9
Obese 23.7 10.8 30.9 10.4 15.9 10.4 27.4 5.7 72.5 13.3 26.2 12.3 29.9 8.9 14.0 9.2 27.6 5.7 77.6 13.2
χ2(d.f. = 3) 34.56*** 18,21*** 31.35*** 14.60** 36.6*** 40.01*** 25.29*** 70.23*** 28.70*** 58.7***
8
Thin 38.6 11.8 35.8 7.4 28.4 8.6 32.3 4.7 80.5 5.5 36.6 15.0 33.3 13.3 28.5 19.5 30.1 9.1 78.5 19.1
Normal 41.7 12.9 44.3 12.0 33.7 10.5 34.1 6.0 88.4 13.5 43.1 12.4 43.5 11.3 37.4 12.9 36.1 6.7 91.7 14.3
Overweight 38.8 12.7 43.2 10.9 29.3 10.5 33.7 7.3 84.4 13.3 38.8 13.2 39.8 10.6 31.3 12.2 33.7 6.2 84.9 13.5
Obese 33.5 12.2 38.8 10.9 20.5 10.1 31.9 5.7 76.7 12.1 31.5 14.3 37.3 13.9 23.0 15.7 31.8 8.2 77.1 17.2
χ2(d.f. = 3) 16.96** 15.09** 61.51*** 6.49 36.2*** 34.59*** 21.69*** 49.47*** 23.88*** 47.5***
9
Thin 42.7 11.4 47.5 14.2 36.4 12.7 35.5 5.5 78.7 14.6 52.3 10.6 48.9 11.6 41.5 13.1 36.5 5.8 91.0 11.0
Normal 44.7 13.0 50.2 11.6 38.6 14.0 37.0 6.6 82.4 14.7 46.8 12.9 48.6 11.7 44.3 12.8 39.0 6.8 91.5 13.2
Overweight 39.3 12.0 47.3 10.7 31.9 11.6 35.3 6.1 75.8 12.4 44.6 12.6 44.8 11.9 38.2 11.5 37.7 8.0 86.4 12.9
Obese 35.8 12.2 44.1 11.1 26.0 11.7 33.6 6.3 70.2 13.3 34.3 12.8 40.7 14.9 26.7 12.5 34.6 7.2 75.8 15.7
χ2(d.f. = 3) 29.52*** 12.67** 50.57*** 12.94** 35.5*** 36.79*** 18.05*** 68.59*** 17.82*** 44.4***
10
Thin 51.4 19.6 45.9 15.4 45.7 17.8 34.6 10.7 77.7 20.8 49.4 12.5 49.7 6.9 48.8 10.8 40.2 5.8 85.9 10.0
Normal 46.2 12.4 53.8 11.6 44.7 12.7 38.7 6.2 79.3 12.8 52.2 12.8 51.8 13.1 50.3 13.7 42.1 6.9 89.6 14.9
Overweight 42.9 13.9 49.3 12.2 36.7 11.2 36.4 5.8 72.5 12.9 43.4 13.8 49.6 11.8 38.9 16.7 39.2 6.8 80.1 14.8
Obese 32.9 13.3 45.2 9.6 24.6 13.9 34.0 5.6 62.0 40.3 40.9 11.7 51.5 11.7 34.3 13.4 39.2 6.9 78.3 11.6
c2(d.f. = 3) 23.03*** 17.61** 48.09*** 16.52*** 40.3*** 29.69*** 2.22 38.22*** 8.67* 26.1***
Notes: *significant forp< 0.05. **significant forp< 0.01. ***significant forp< 0.001.
ET
AL
.
undernutrition compared with better nourished children (Malina,
Katzmarzyk, & Siegel, 1998) and among children who were growth
stunted (Malina, Reyes, Tan, & Little, 2011). By inference, there is need
for caution in using the BMI to define weight status in studies of the
motor characteristics of children with marginal nutritional histories
and perhaps in different cultural contexts.
The use of the quadratic model to evaluate the non‐linear
associ-ation between the BMI and MC may have a potential limitassoci-ation. The fit
of the model was not compared with a more general model (e.g.,
restricted cubic splines with 4 or 5 d.f.). The lack of an indicator of
maturity status may also be a limitation in the analyses. The results
are also limited to a sample of children with a good nutritional history.
Although specific information on the socioeconomic status of the
fam-ilies of the participants could be an additional limitation, the children
were from a region with a high human development index (0.903).
Although a high BMI is widely used as a proxy indicator of excess
adiposity, it is not a measure of body composition. The BMI has been
complemented with other anthropometric indicators in field studies,
for example, waist circumference per se, the waist circumference‐to‐
height ratio, and skinfold thicknesses. The specific dimensions and
ratios are widely used in large scale surveys, are inexpensive, and have
the advantage of not relying on body weight (Tomiyama, Hunger,
Nguyen‐Cuu, & Wells, 2016). However, application of the methods
requires experienced technicians and careful attention to and
docu-mentation of inter‐ and intraobserver measurement variability, that
is, technical errors of measurement (Malina, Huang, & Brown, 1995).
Allowing for the limitations, the present study adds to and
comple-ments previous research on MC in children. The results indicated that
(a) a high weight‐for‐height reflected in the BMI had the potential to
negatively influence MC; and (b) the BMI had a generally curvilinear
relationship in an inverted parabolic shape with MC in children; the
lat-ter observation was more apparent in older (8–10 years) than younger
(6–7 years) children. Children with intermediate BMIs tended to have
better MC than children with low and high BMIs who tended to have
poorer MC as measured by the KTK test battery.
A C K N O WL E D G E M EN TS
The first and last authors were supported by the Portuguese
Founda-tion for Science and Technology under Grants DTP/04045/2013;
POCI‐01‐0145‐FEDER‐006969, and UID/DTP/00617/2013; and by
NORTE 2020 under Grant NanoSTIMA: Macro‐to‐Nano Human
Sens-ing: Towards Integrated Multimodal Health Monitoring and Analytics,
NORTE‐01‐0145‐FEDER‐000016.
O R C I D
V. P. Lopes http://orcid.org/0000-0003-1599-2180
R E F E R EN C E S
Artero, E. G., España‐Romero, V., Ortega, F. B., Jiménez‐Pavón, D., Ruiz, J.
R., Vicente‐Rodríguez, G.,…Castillo, M. J. (2010). Health‐related fitness
in adolescents: Underweight, and not only overweight, as an influencing factor. The AVENA study.Scandinavian Journal of Medicine & Science in Sports,20, 418–427.
Bovet, P., Auguste, R., & Burdette, H. (2007). Strong inverse association between physical fitness and overweight in adolescents: A large
school‐based survey.International Journal of Behavioral Nutrition and
Physical Activity,4, 24–31.
Cole, T. J., Bellizzi, M. C., Flegal, K. M., & Dietz, W. H. (2000). Establishing a standard definition for child overweight and obesity worldwide: Inter-national survey.BMJ,320, 1240–1243.
Cole, T. J., Flegal, K. M., Nicholls, D., & Jackson, A. A. (2007). Body mass index cut offs to define thinness in children and adolescents: Interna-tional survey.BMJ,335, 194–197.
Cruz, C., Sequeira, S., Gomes, H., Pinto, D., & Marques, A. (2011). Relation-ship between physical fitness, physical activity and body mass index of adolescents.British Journal of Sports Medicine,45, A8–A9.
D'hondt, E., Deforche, B., Gentier, I., De Bourdeaudhuij, I., Vaeyens, R., Philippaerts, R., & Lenoir, M. (2013). A longitudinal analysis of gross motor coordination in overweight and obese children versus normal‐
weight peers.International Journal of Obesity,37, 61–67.
D'hondt, E., Deforche, B., Vaeyens, R., Vandorpe, B., Vandendriessche, J., Pion, J.,…Lenoir, M. (2011). Gross motor coordination in relation to
weight status and age in 5‐to 12‐year‐old boys and girls: A cross‐
sec-tional study.International Journal of Pediatric Obesity,6, e556‐e564.
Duncan, M. J., Bryant, E., & Stodden, D. (2016). Low fundamental move-ment skill proficiency is associated with high BMI and body fatness in girls but not boys aged 6–11 years old.Journal of Sports Sciences, 1–7.
Gonzalez‐Suarez, C. B., Caralipio, N., Gambito, E., Reyes, J. J., Espino, R. V.,
& Macatangay, R. (2013). The association of physical fitness with body mass index and waist circumference in Filipino preadolescents.Asia‐ Pacific Journal of Public Health,25, 74–83.
Hay, J. A., Hawes, R., & Faught, B. E. (2004). Evaluation of a screening instrument for developmental coordination disorder.Journal of Adoles-cent Health,34, 308–313.
He, Q.‐Q., Wong, T.‐W., Du, L., Jiang, Z.‐Q., Yu, T.‐S. I., Qiu, H.,…Wu, J.‐G.
(2011). Physical activity, cardiorespiratory fitness, and obesity among Chinese children.Preventive Medicine,52, 109–113.
Huang, Y.‐C., & Malina, R. M. (2007). BMI and health‐related physical
fit-ness in Taiwanese youth 9‐18 years.Medicine and Science in Sports
and Exercise,39, 701–708.
Huang, Y.‐C., & Malina, R. M. (2010). Body mass index and individual
phys-ical fitness tests in Taiwanese youth aged 9–18 years. International
Journal of Pediatric Obesity,5, 404–411.
Joshi, P., Bryan, C., & Howat, H. (2012). Relationship of body mass index and fitness levels among schoolchildren.The Journal of Strength & Con-ditioning Research,26, 1006–1014.
Kiphard, E. J., & Schilling, F. (1974).Korperkoordinationstest fur kinder [Body cooordination test for children]. Weiheim: Beltz Test GmbH.
Kiphard, E. J., & Schilling, F. (2007).Körperkoordinationstest fur kinder [Body cooordination test for children]. Beltz Test GmbH: Weinheim.
Lopes, V. P., Cossio‐Bolaños, M., Gómez‐Campos, R., De Arruda, M.,
Hespanhol, J. E., & Rodrigues, L. P. (2017). Linear and nonlinear relation-ships between body mass index and physical fitness in Brazilian children and adolescents.American Journal of Human Biology,29, e23035.
Lopes, V. P., Stodden, D. F., Bianchi, M. M., Maia, J. a. R., & Rodrigues, L. P. (2012). Correlation between BMI and motor coordination in children. Journal of Science and Medicine in Sport,15, 38–43.
Lopes, V. P., Stodden, D. F., & Rodrigues, L. P. (2014). Weight status is asso-ciated with cross‐sectional trajectories of motor co‐ordination across
childhood.Child: Care, Health and Development,40, 891–899.
Maia, J. a. R. & Iopes V.P. (2007) Crescimento e desenvolvimento de crianças e jovens açorianos. O que os pais, professores, pediatras e nutricionistas gostariam saber (Growth and development of Azorean children and young people. What parents, teachers, pediatricians, and nutritionists should know),Faculdade de Ciências do Desporto e de Educação Física da Universidade do Porto e Direcção regional de Educação Física e Desporto da Região Autónoma dos Açores, Porto.
Malina, R. M., Bouchard, C., & Bar‐Or, O. (2004).Growth,Maturation and
Physical Activity. Champaign: Human Kintetics.
Malina, R. M., Huang, Y. C., & Brown, K. H. (1995). Subcutaneous adipose tissue distribution in adolescent girls of four ethnic groups.International Journal of Obesity and Related Metabolism Disordorder,19, 793–797.
Malina, R. M., Katzmarzyk, P. T., & Siegel, S. R. (1998). Overnutrition, under-nutrition and the body mass index: Implications for strength and motor fitness. In J. Parízková, & A. P. Hills (Eds.),Physical fitness and nutrition during growth. Medicine sport science(pp. 13–26). City: Karger.
Malina, R. M., Reyes, M. E. P., Tan, S. K., & Little, B. B. (2011). Physical fit-ness of normal, stunted and overweight children 6‐13 years in
Oaxaca, Mexico.European Journal of Clinical Nutrition,65, 826–834.
Martins, D., Maia, J., Seabra, A., Garganta, R., Lopes, V., Katzmarzyk, P., & Beunen, G. (2010). Correlates of changes in BMI of children from the Azores islands.International Journal of Obesity,34, 1487–1493.
Mcgavock, J. M., Torrance, B. D., Mcguire, K. A., Wozny, P. D., & Lewanczuk, R. Z. (2009). Cardiorespiratory fitness and the risk of over-weight in youth: The healthy hearts longitudinal study of cardiometabolic health.Obesity,17, 1802–1807.
Ng, M., Fleming, T., Robinson, M., Thomson, B., Graetz, N., Margono, C.,…
Gakidou, E. (2014). Global, regional, and national prevalence of over-weight and obesity in children and adults during 1980–2013: A
systematic analysis for the Global Burden of Disease Study 2013.The Lancet,384, 766–781.
Padez, C., Fernandes, T., Mourão, I., Moreira, P., & Rosado, V. (2004). Prev-alence of overweight and obesity in 7–9‐year‐old Portuguese children:
Trends in body mass index from 1970–2002. American Journal of
Human Biology,16, 670–678.
Rodrigues, L. P., Stodden, D. F., & Lopes, V. P. (2016). Developmental path-ways of change in fitness and motor competence are related to
overweight and obesity status at the end of primary school.Journal of Science and Medicine in Sport,19, 87–92.
Sekulić, D., Zenić, N., & Marković, G. (2005). Non linear relationships between anthropometric and motor‐endurance variables. Collegium
Antropologicum,29, 723–730.
Tomiyama, A. J., Hunger, J. M., Nguyen‐Cuu, J., & Wells, C. (2016).
Misclas-sification of cardiometabolic health when using body mass index categories in NHANES 2005–2012. International Journal of Obesity,
40, 883.
Vandendriessche, J. B., Vandorpe, B., Silva, M. J. C., Vaeyens, R., Lenoir, M., Lefevre, J., & Philippaerts, R. M. (2011). Multivariate association among morphology, fitness, and motor coordination characteristics in boys age 7 to 11.Pediatric Exercise Science,23, 504–520.
Welon, Z., Jurynec, R., & W,Ś. (1988). Cięzar należny mężczyzn (Optimal body weight in men).Materialy i Prace Antropologiczny,109, 53–71.
World Health Organization (2006).WHO Child Growth Standards: Length/ height‐for‐age, weight‐for‐age, weight‐for‐length, weight‐for‐height and body mass index‐for‐age: Methods and development. Geneva: World Health Organization.
World Health Organization (2016).Final report of the Commission on Ending Childhood Obesity. Geneva: World Health Organization.
How to cite this article: Lopes VP, Malina RM, Maia JAR, Rodrigues LP. Body mass index and motor coordination: Non‐
linear relationships in children 6–10 years.Child Care Health