Visual Knowledge Generation from Data Mining
Patterns for Decision-Making
Jihed Elouni
METS Micro Electro Thermal Systems
University of Sfax, National School of Engineers (ENIS) Sfax, Tunisia
Hela Ltifi
REGIM: REsearch Groups in Intelligent Machines University of Sfax, National School of Engineers (ENIS)
Sfax, Tunisia
Mounir Ben Ayed
REGIM: REsearch Groups in Intelligent Machines University of Sfax, National School of Engineers (ENIS)
Sfax, Tunisia
Mohamed Masmoudi
METS Micro Electro Thermal SystemsUniversity of Sfax, National School of Engineers (ENIS) Sfax, Tunisia
Abstract—The visual data mining based decision support systems had already been recognized in literature. It allows users analysing large information spaces to support complex decision-making. Prior research provides frameworks focused on simply representing extracted patterns. In this paper, we present a new model for visually generating knowledge from these patterns and communicating it for intelligent decision-making. To prove the practicality of the proposed model, it was applied in the medical field to fight against nosocomial infections in the intensive care units.
Keywords—Knowledge; patterns; visualization; data mining; Decision Support Systems
I. INTRODUCTION
Decision Support Systems (DSS) are interactive information Systems intended to assist decision-makers to use data, models and knowledge to solve structured or unstructured problems [7].Currently, decision-making is becoming more complex and dynamic. To cope with this increasing complexity, datamining becomes an interesting element for the enhancement of decision support quality [14]. It extends the decision support possibilities by analysing the raw data to extract new actionable insights, interesting patterns and hidden relationships in data.
Data mining for decision-makingis increasingly applied in many fields especially in those based on the treatment of large data quantities in complex and dynamic environments. This solution achieved positive results, but requires instead the integration of other tools to better attract the attention of users and then facilitate the decision-making. Recently, visualization techniques taking place in such systems provide interactive visual tools for more effective decision-making [15].
Information visualization can be applied to visualize raw data, data mining algorithm or extracted patterns[21]. Representing patterns in a visual form is considered as insufficient to transfer knowledge for decision-making [10]. In this context, we address the knowledge visualization from automatic extracted patterns. The importance of knowledge visualization, as a strong sub-discipline of knowledge
management, had already been recognized in literature [4][5]. It examines the use of visual representations to improve the creation and transfer of knowledge between two or more users. It refers to all graphic means that can be used to build, communicate complex ideas, create, transform and communicate knowledge.
In this context, we propose a knowledge visualization model allowing users (i.e. decision makers) to identify, preview and interpret the knowledge behind the data mining patterns representation and integrate it into decision-making process. To validate this proposal, our proposed model was applied to the fight against nosocomial infections in the hospital intensive care units.
This paper is organized into 5 sections. In Section 2, a little state of art about our theoretical background concerning the data mining based DSS and the knowledge visualization is addressed. Our knowledge visualization proposal is described in section 3. Section 4, is dedicated to the discussion of the application of our proposal to develop a knowledge visualization tool. Finally, we present the evaluation of the model then we present our conclusions and future outlook.
II. THEORETICAL CONTEXT
A. Visual data mining for decision-making
Decision support systems (DSS) are interactive computer systems that are designed to help decision makers using data and models to identify problem, solve it and make appropriate decisions. Their mission is to improve effectiveness, rather than the efficiency of decisions [7]. The amounts of information available today are becoming increasingly large and complex [1] [2]. In this context, the mining of these data to extract useful information has emerged in order to improve decision-making process: data mining based DSS.
problem solving, by allowing the merging of expert knowledge and automatically discovered knowledge [13].
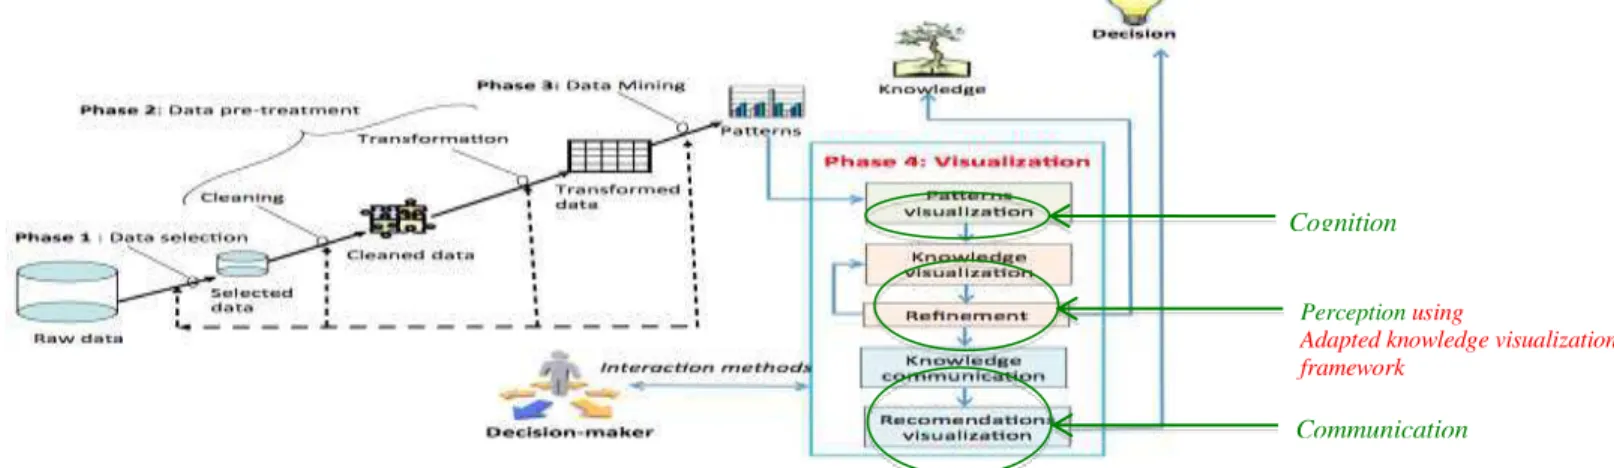
Data mining is the central phase of the knowledge discovery process visible in figure 1. It is an iterative process that takes place after a series of operations. It begins by data selection according to the analysis domain. Data pre-treatment steps (data cleaning and transformation) occur before the data mining itself. Pre-treatment is about access to selected data in order to build specific data corpus. To this corpus, it is question of applying a data mining algorithm to extract interesting patterns. These patterns will be evaluated and interpreted to verify their quality. Validated patterns will be integrated as knowledge for the decision-making.
Fig. 1. knowledeg discovery process(Ltifi et al. 2013)
Visualization in data mining made important advances in literature, where several studies proved successes in assisting decision-makers exploring large complex data sets and making decisions: visual data mining based DSS[21]. The power of visual data mining comes from coupling: (1) the computational and data storage capabilities on the machine, and (2) the perceptive skills and the cognitive reasoning of the human. Visual data mining process span from human analytic tasks using domain knowledge to automatic tasks using data mining algorithms. Such visual analytic follows a specific process [13]. Figure2shows the different stages in this process.
Fig. 2. Knowledege visualization framework[13]
The visual analytics process gives the authority to the user to guide the analysis methods during the execution of his/her tasks from raw data to decision. It provides collaboration between automatic patterns extraction and visualization (of data and patterns) across different abstraction levels. The feedback in this process allows the evaluation and rapid improvement of the visual patterns and eventually the improvement of the knowledge and generated decisions.
While this process allows structured analysis to find new patterns and gain insights into the decision problem domain, it does not support knowledge building and communication. To cope with this need, knowledge visualization would be valuable.
B. Knowledge Visualization
Knowledge Visualization can be considered as a new field of research[4][5]. The goal of this field is the creation and the transfer of knowledge by visualizations [18].Some definitions of knowledge visualization exist in literature. For Tergan (2006), “Knowledge visualization is a field of study, that investigates the power of visual formats to represent knowledge. It aims at supporting cognitive processes in generating, representing, structuring retrieving sharing and using knowledge” [4] (p.168).According to Burkhard
''Knowledge Visualization ”[...] examines the use of visual
representations to improve the transfer and creation of
knowledge between at least two persons.” [4][5].
Burkhard[5] proposed a framework based on four perspectives to guide the knowledge visualization (cf. Fig. 3): the function type, the knowledge type, the recipient, and the visualization type.
The function type perspective: the objective is to specify the aim that should be achieved. It can be a coordination, attention, recall, motivation, elaboration or new insight.
The knowledge type perspective: defines the useful type of knowledge, which should be transferred. The knowledge can be declarative (to Know-What the facts are pertinent), procedural (to Know-How the things are made), experimental (to Know-Why the things happen), orientation focused (to Know- Where the information can be found) and finally individual (to Know-Who are the experts).
The recipient type perspective: concerns the target group that can be individuals, groups, organizations or networks.
Fig. 3. Knowledege visualization framework[4]
Knowledge Visualization combines findings from various disciplines, particularly information visualisation. Table 1distinguishes between the two fields (information and knowledge visualization) according to different perspectives (Table 1).
TABLE I. KNOWLEDGE VISUALIZATION VS INFORMATION
VISUALIZATION
This paper aims to establish knowledge visualization modelling for visual data-mining based DSS. The model is based on the data mining reasoning, the Burkhard framework and the information visualization pipeline.
III. VISUAL KNOWLEDGE GENERATION FOR DECISION -MAKING
To propose a knowledge generation model, we have to take into account two things: (1) the knowledge visualization framework of Burkhard [4] does not take into account the type of extracted data mining patterns, and (2) the passage from these patterns to knowledge is inconspicuous. As visualization demonstrated successes in helping domain experts in visual analytics, we propose to apply to visually generate knowledge from patterns.
A. Knowledge Visualization Framework
In the context of visual data mining based DSS, the knowledge visualization framework must take into accountthe extracted patterns types. In fact, visualizing decision tree is
different to visualizing clusters. An adapted knowledge visualization framework is presented by the figure 4.
Fig. 4. Adapted knowledge visualization framework
The added patterns type perspective concerns the type of the extracted models by the data mining algorithms. We summarized them into five kind of patterns:
1) Decision tree:as its name suggests, it a technique for decision support that divides a population of individuals into homogeneous groups according discriminating attributes based on a fixed and known objective. It allows to issue predictions based on known data on the problem by reducing, level by level, domain solutions[3]. It is a method which has the advantage of being readable for analysts and to determine the discriminating couples from a very large number of attributes and values.
2) (IF-THEN) rules:set of rules where each one implies certain relationships of association between a set of objects in a database. Generally, the rules are propositions of the form
"if premise then conclusion," noted premise → conclusion.
They have the advantage of representing explicit knowledge (unlike connectionist models, for example), and are also the predominant model for many artificial intelligence applications [12].
3) Bayesian Networks: it is a causal graph oriented and acyclic to represent random variables with their dependencies. It shows the distribution of conditional probabilities of a set of variables[9][19]. Its nodes represent random variables and its arcs represent dependencies between these variables. Because of their ability to represent uncertain knowledge, Bayesian networks play an increasingly important in many medical applications[6] [16].
4) Neural Networks: it is a computational model in which the schematic operation was inspired from the functioning of biological neurons. During the learning phase, network learns by adjusting the weights to be able to predict the correct class label input tuples. Neural networks are very powerful to draw inaccurate data and can be used to extract patterns and detect trends that are too complex to be noticed by humans or other computer techniques[3].
5) Clusters: it is a statistical method of data analysis that aims to bring together a set of data into different homogeneous groups. Each subset groups elements with common characteristics that match the criteria of proximity. The goal of clustering algorithms is to get subsets most distinct possible.
Perspective Knowledge Visualization Information visualization
Objectives
Uses visual representations to improve the transfer and the creation of knowledge
Uses computer applications to get new insights
Content
Knowledge types like experiences, insights, social structures
Explicit data like facts and numbers
Recipients Individuals or groups Individuals
Contribution
Solution-oriented: apply new and traditional visualization problems to solve predominant problems
Innovation-oriented: create technical methods
Phases
1. Cognition 2. Perception 3. Communication
1. Information architecture 2. Design 3. Interaction
Information visualization
Distance measurement is a key element for the quality of the clustering algorithm[3].
After defining our adapated framework for visually generating knowledge. Following, we present the knowledge visualization model.
B. Knowledge Visualization Model 1) Cognition
The cognition phase of the model begins when the decision maker must take decisions. Once the code component of the knowledge exploration generates the concerned patterns, a request is sent to the patterns visualization element to visualize this patterns. The decision maker can chooses to browse, manage and structure the relevant models from which associated knowledge will also be visualized interactively. These measures aim to reduce the cognitive load of the decision makers in their challenges and situations cognition.
Fig. 5. adapted knowledge visualization framework
2) Perception
The interactive visual analysis helps to generate visual representations intended to be perceived and interpreted by the visual system of the user, which itself controls the display to compare the performances produced with its interpretation of the decision phenomen. So, the decision-maker can visualize and filter the knowledge displayed as needed, refine the visual design, if necessary, according to the perception of executives and knowledge of building a flexible manner.
a)Knowledge Visualization
The goal of this step is the translation of the patterns in a simple, natural and useful representation and description to the decision maker [15]. In this step we will rely on the principle of Shneiderman [20]to view the displayed information: (1) the representation of an overview of patterns, (2) extraction of points of interest and filtering irrelevant points. The display is interactive to allow manipulation of visual elements to easily identify areas where knowledge exists.
b)Refinement
Once the previous step is completed, the decision maker can perform refinement tasks to improve results of the knowledge visualization. During the interactive refinement step, decision maker can benefit from the capabilities of knowledge processing to choose the terms that accurately represent his/her need for knowledge.
3) Communication
We base this phase on the tasks introduced by Shneiderman (Shneiderman 1996) to communicate the knowledge and the decision recommendations. The principle is to provide details and send recommendations at any time. The objective of our visualization process is to:
a)provide decision makers with knowledge about data mining models; this knowledge must be integrated to generate any concrete recommendations
b)interactively communicating knowledge.
In the following section, we present the application of our model in the medical field.
IV. MEDICAL APPLICATION
The goal of the work is to apply our proposal to design and develop a visual data mining based DSS in the medical field. The application must contribute to a better analysis, interpretation and knowledge generation from data mining patterns for medical decision-making. We aim aso to analyze the ability of a visual representation to produce changes in the decision making activity. The DSS to developaims to the fight against Nosocomial Infections (NI) in the hospital Intensive Care Unit(ICU).The purpose is to solve the problem of decision on the occurrence of NI during hospitalization of a patient that can weaken or delay his/her treatment. By preventing the occurrence of aNI every day during the patient's hospitalization period in the ICU. The objectif of the work concerns the visual generation of relevant knowledge extracted by a specific data mining technique, which is the association rules mining, for good analysis and better understanding of the patient's condition and to acquire useful knowledge for decision support.
A. Association rules mining
For analysis and extraction of large quantities of valuable knowledge, it becomes increasingly important to develop powerful tools. In our work we chose to work with the association rules as a data mining technique. Support and
Cognition
Perception using
Adapted knowledge visualization framework
confidence are the most known measures for the evaluation of association rule.
1) Dynamic Association rules used in our work
Considering the temporal nature of data to view, we try to improve conventional representations of association rules by adding the time factor for a visualization technique of dynamic association rules. We represent some of dynamic association used in our work:
If Artificial Ventilation and Trachealintubation then probability of NI in 28 days.
If Urinary Sonde and Perf.IntraVein then probability of IN in 7 days.
If Trachealintubation et Urinary Sonde then probability of NI in 6 days.
If Perf.IntraVein and Artificial Ventilation then probability of NI in 7 days.
If Trachealintubation and Artificial Ventilation then probability of NI in 6 days.
It is true that the textual representation is easily comprehensible, the cognitive effort exerted to interpret a significant number of rules or patterns extracted remains high. And since a picture is more significant than a thousand words, hence we propose to explore the knowledge generated by the association rules in an interactive visual space. We will present in the next section, the application of our proposed visualization model to visualize knowledge associated with generated patterns.
2) Knowledge generation model application
Table 2 presents the proposed model application for the Dynamic Association Rules extracted patterns.
TABLE II. THE MODEL APPLICATION
Phase Brief description
C
o
g
n
itio
n
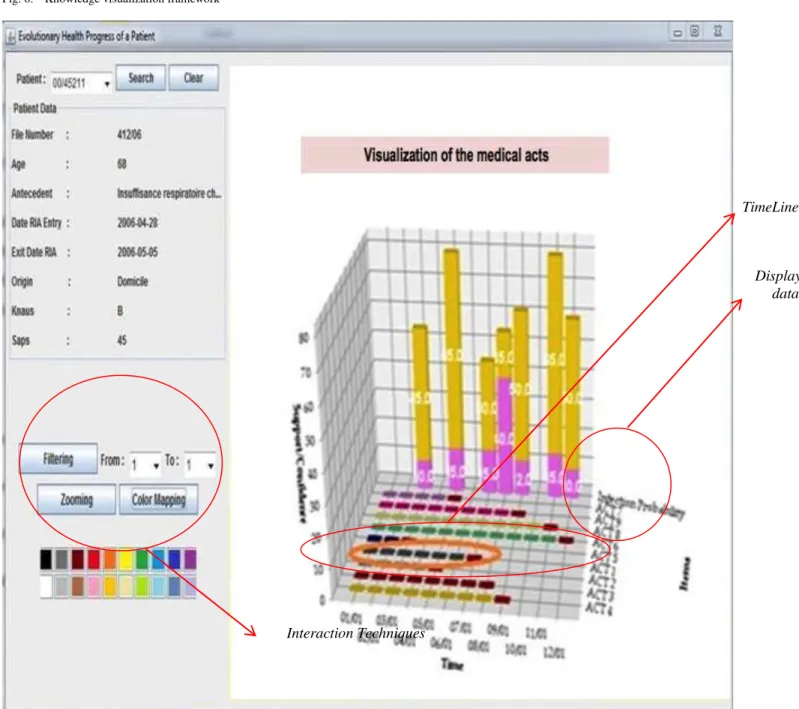
To view the generated patterns (acts, conclusion, time and metric) we present three main dimensions: Items, Time, Support and trust. Taking an action at a time t is expressed by the intersection of the X axis and the Y axis (2D array). Each cell of the matrix represents a rule, we use the space used by this case to represent. Metrics (Support and Trust) are shown in the bottom of the matrix, and their sizes are proportional to their values. We chose to combine the matrix visualization and 3D histogram to visualize patterns. We are interested in improving the visualization of association rules to help increase system performance while reducing cognitive load exerted by the user. This visualization technique aims to:
a. Assist the decision maker in its reasoning and amplify cognition,
b. Produce graphs reflecting changes over time association rules using graphical objects.
Per
ce
p
tio
n
The visual representation used "Histogram interactive 3D" is an abstract graphic to explore and interpret the relationships and trends between different patterns generated by association rules over time. The applied knowledge visualization framework is presented by the figure 6. The decision maker can interact with the visualization component with several ways:
c. Collect knowledge in relation to the rules and previous knowledge stored in the knowledge base,
d. Visually interpret the differences or similarities between the rules over time.
C
o
m
m
u
n
icatio
n
By selecting a specific date in the course of time, the rules are displayed as interactive rectangles with different colors and the decision maker can interact with them (cf. figure 7). It can perform:
e. Interactive filtering on the rules and relationships in each viewing area to facilitate research, and improve the display if the number of actions is important,
f. Zooms to switch from an overview (containing all items) to a more detailed view or more specific (selected items).
Fig. 6. Knowledge visualization framework
Fig. 7. Interactive visual representation
TimeLine
Displayed data
The Figure 2 presents the interactive visual representation allowing representing probabilistic patterns extracted by the RDA to visually generate knowledge.
V. EVALUATION AND DISCUSSION
The evaluation of a visualization system consists of the analysis of its behaviour and its use of resources at its disposal. Knowing these resources, it is possible to verify the behaviour application that must be reliable and meet user needs. We are interested in our work to both conventional evaluation dimensions in the Human-Computer Interaction field that are "usability" and "utility".
A. Usability evaluation
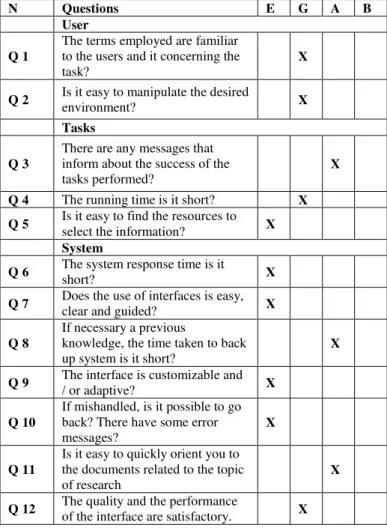
the most widely used method for evaluating a display interface is conducting a user study. The principle of this technique is to provide a questionnaire for users to assess and rate the display interface through a set of questions. The list of proposed assessment criteria is divided into three categories that are related to: the user ("Who is it?"), his/her task ("What does he/she want? What for?"), and finally the system (including the characteristics of all the results obtained). This assessment questionnaire is presented in Table 3: the responses of representative users are defined by: Excellent (1) Good (2) Acceptable (3) and Bad (4).
TABLE III. USABILITY QUESTIONNAIRE
N Questions E G A B
User
Q 1
The terms employed are familiar to the users and it concerning the task?
X
Q 2 Is it easy to manipulate the desired
environment? X
Tasks
Q 3
There are any messages that inform about the success of the tasks performed?
X
Q 4 The running time is it short? X
Q 5 Is it easy to find the resources to select the information? X System
Q 6 The system response time is it
short? X
Q 7 Does the use of interfaces is easy, clear and guided? X
Q 8
If necessary a previous
knowledge, the time taken to back up system is it short?
X
Q 9 The interface is customizable and
/ or adaptive? X
Q 10
If mishandled, is it possible to go back? There have some error messages?
X
Q 11
Is it easy to quickly orient you to the documents related to the topic of research
X
Q 12 The quality and the performance
of the interface are satisfactory. X
From these results, we generated the histogram below:
Fig. 8. Usability evaluation results
B. Utility evaluation
The tool application is considered effective if it can visually generate good prediction results. For the evaluation of the performance of our tool, we used a test database that contains 58cases (patients). We got the results given by the following confusion matrix.
TABLE IV. THE PREDICTION RESULTS PROVIDED BY THE DAR
Observed values
Predicted values
Yes No Total
Yes 15 8 23
No 5 30 38
Total 20 38 58
From the prediction results obtained by the DAR structure, we found that the classification rate was correct to 0.77, which is interesting. The evaluation results of our system are encouraging. We noticed that users are generally satisfied with the proposed application.
VI. CONCLUSION
Data mining technology plays an important role in uncovering hidden and interesting patterns. Actually the discovering of models and relationships in data extends the possibilities to support decision-making. The objective of our work is to investigate how decision makers obtain knowledge from the extracted patterns representation. The aim was to design an efficient visual tool to articulate the knowledge produced by these patterns for providing actionable recommendations to make best decisions.
The introduced knowledge visualization model occurs on three main phases: cognition, perception and communication. Each phase contains some successive tasks to improve the visualization results and to help user to better make appropriate and good decisions.
In future work, we plan to apply the model to design other visualization techniques to represent patterns and build knowledge, and to use multi-Agent architecture to extract and visualize knowledge.
ACKNOWLEDGMENT
The authors would like to acknowledge the financial support of this research by grants from the ARUB program under the jurisdiction of the General Direction of Scientific Research (DGRST) (Tunisia). Thanks are also due to all the ICU staff of HabibBourguiba Teaching Hospital for their interest in the project and all the time they spent helping us design, use and evaluate our system.
REFERENCES
[1] Bohn R.and Short J., How much information? 2009: Report on American consumers, 2010.
[2] Bohn R., Short J., and Baru C., How much information? 2010: Report on enterprise server information, January 2011.
[3] Boulila W. Extraction de connaissances spatio-temporelles incertaines pour la prediction de changements en imagerie satellitale. Thesis. Co-University of Manouba,2012.
[4] Burkhard R.A., Learning from architects: the difference between knowledge visualization and information visualization. In IV ’04: Proceedings of the Information Visualisation, Eighth International Conference, pages 519–524, Washington, DC, USA, 2004. IEEE Computer Society.
[5] Burkhard, R.A., Towards a framework and a model for knowledge visualization: synergies between information and knowledge visualization, in Knowledge and Information Visualization, Berlin/Heidelberg: Springer, vol. 3426, pp. 238–255, 2005.
[6] Burnside E.S., Rubin D.L., Fine J.P., Shachter R.D., Sisney G.A., Leung, W.K. Bayesian network to predict breast cancer risk of mammographic microcalcifications and reduce number of benign biopsy results: initial experience. Radiology, vol. 240(3), pp. 666-673, 2006. [7] Chen K.C., Decision Support System for Tourism Development: System
Dynamic Approach, Journal of Computer Information Systems, 45, 1, pp. 104-112, 2004.
[8] Chittaro L., Information visualization and its application to medicine,
Artificial Intelligence in Medicine, vol. 22, no. 2, pp. 81–88, 2001. [9] Darwich A., A Differential Approach to Inference in Bayesian
Networks, 2001.
[10] Elouni J., Ltifi H., Ben Ayed M., Knowledge visualization model for intelligent dynamic decision-making, Volume 420 of the series Advances in Intelligent Systems and Computing, 2015.Springer, pp. 223-235.
[11] HilbertM., LópezP., The world’s technological capacity to store, communicate, and compute information, Science, Vol. 332 (6025), pp. 60-65, 2011.
[12] Julien B, Un système de visualisation pour l’extraction, l’évaluation, et
l’exploration interactives des règles d’association,Thesis, University of Nantes l’École Polytechnique, France, 2005.
[13] D. Keim, G. Andrienko, J.-D. Fekete, C. Gorg, J. Kohlhammer, et al. « Visual Analytics: Definition, Process and Challenges ». A. Kerren and J.T. Stasko and J.-D. Fekete and C. North. Information Visualization - Human-Centered Issues and Perspectives, Springer, pp.154-175, 2008, LNCS.
[14] Khademolqorani S., hamadani AZ, 2013, An adjusted decision support system through data minig and multiple criteria decision making, SocBehavSci, 73: 388-395.
[15] Ltifi H., Ben Mohamed E. and Ben Ayed M., 2016, Interactive visual KDD based temporal Decision Support System, Information Visualization, 15 (1): 31-50.
[16] Lucas P.J.F., de Bruijn N.C., Schurink K., Hoepelman I.M. A Probabilistic and decision-theoretic approach to the management of infectious disease at the ICU.Artificial Intelligence in Medicine, vol. 19(3), pp. 251–279, 2000.
[17] MladenićD., LavračN., BohanecM., MoyleS., Data Mining and Decision Support: Integration and Collaboratio, Dordrecht, Kluwer Academic Publishers,2002
[18] Meyer R., Knowledge Visualization. the Media Informatics Advanced Seminar on Information Visualization, 2009
[19] Murphy K.P., Dynamic Bayesian Networks: Representation, Inference and Learning, University of California, Berkeley Fall 2002.
[20] Shneiderman, B., The eyes have it: a task by data type taxonomy for information visualizations, in Proceedings of the 1996 IEEE Symposium on Visual Languages, Boulder, CO, USA: IEEE, Los Alamitos, CA, United States, pp. 336–343, (1996).
[21] Simoff S.J., Böhlen M.H. and Mazeika A., 2008, Visual Data Mining, Theory, Techniques and Tools for Visual Analytics, Lecture Notes in Computer Science 4404, Springer Berlin Heidelberg.
![Fig. 2. Knowledege visualization framework[13]](https://thumb-eu.123doks.com/thumbv2/123dok_br/18186563.331808/2.918.66.438.796.973/fig-knowledege-visualization-framework.webp)