Temperature Regulates Transcription
in the Zebrafish Circadian Clock
Kajori Lahiri, Daniela Vallone, Srinivas Babu Gondi, Cristina Santoriello, Thomas Dickmeis, Nicholas S. Foulkes*
Max-Planck Institut fu¨r Entwicklungsbiologie, Tu¨bingen, Germany
It has been well-documented that temperature influences key aspects of the circadian clock. Temperature cycles entrain the clock, while the period length of the circadian cycle is adjusted so that it remains relatively constant over a wide range of temperatures (temperature compensation). In vertebrates, the molecular basis of these properties is poorly understood. Here, using the zebrafish as an ectothermic model, we demonstrate first that in the absence of light, exposure of embryos and primary cell lines to temperature cycles entrains circadian rhythms of clock gene expression.Temperature steps drive changes in the basal expression of certain clock genes in a gene-specific manner, a mechanism potentially contributing to entrainment. In the case of theper4gene, while E-box promoter elements mediate circadian clock regulation, they do not direct the temperature-driven changes in transcription. Second, by studying E-box-regulated transcription as a reporter of the core clock mechanism, we reveal that the zebrafish clock is temperature-compensated. In addition, temperature strongly influences the amplitude of circadian transcriptional rhythms during and following entrainment by light–dark cycles, a property that could confer temperature compensation. Finally, we show temperature-dependent changes in the expression levels, phosphorylation, and function of the clock protein, CLK. This suggests a mechanism that could account for changes in the amplitude of the E-box-directed rhythm. Together, our results imply that several key transcriptional regulatory elements at the core of the zebrafish clock respond to temperature.
Citation: Lahiri K, Vallone D, Gondi SB, Santoriello C, Dickmeis T, et al (2005) Temperature regulates transcription in the zebrafish circadian clock. PLoS Biol 3(11): e351.
Introduction
The circadian clock plays a central role in adapting the physiology of plants and animals to anticipate day–night environmental changes. Amongst the most conserved proper-ties of the clock is the ability of daily temperature cycles and acute temperature changes to set its phase [1]. In addition, the period length of the clock rhythm remains relatively constant over a wide range of temperatures [1,2]. The mechanism underlying this ‘‘temperature compensation’’ corrects for the natural tendency of the rate of biochemical reactions to change with temperature. Outside of the range of temperature compensation, the clock stops running and arrests at a certain phase [1,3,4]. The physiological range for rhythmicity typically lies well within the temperature range permissive for growth.
In ectotherms, where core body temperature is strongly influenced by the environment, these properties have clear importance to provide a mechanism for daily entrainment of the pacemaker, as well as to ensure that seasonal variations in temperature do not lead to deleterious changes in the speed of the clock cycle [1,5,6]. Although there is homeostatic control of core body temperature in endo-therms, recent tissue and cell culture studies have confirmed that their clocks are also temperature-compensated and can be phase-shifted by acute temperature changes [7–9]. In addition, daily rhythms of body temperature have been directly implicated in the maintenance of peripheral clock function [10,11]. Thus, regulation by temperature appears to be a highly conserved property of the circadian timing system.
Molecular studies in a wide range of model organisms have revealed that many clock genes are components of tran-scription translation feedback loops [12]. For example, in
vertebrates, the basic helix-loop-helix Per-Arnt-Sim domain transcription factors, Clock (CLK) and Brain and muscle Arnt-like protein (BMAL), bind as heterodimers to E-box enhancers and activate the expression of other clock genes that encode transcriptional repressors, the Period (Per) and Cryptochrome (Cry) proteins. These repressors interact with CLK-BMAL and interfere with transcriptional activation, thereby reducing expression of their own genes and so closing the feedback loop [13]. Our limited understanding of the molecular basis of temperature responses of the clock has come from studies of the expression of theperiodandtimeless genes inDrosophila,and thefrequencygene inNeurospora. Here, temperature-dependent alterations in transcription [14], mRNA processing [15–17], translation [3,14], protein stability [14,18], and protein–protein interactions [19] have been documented. These results would appear to suggest that unlike the situation for light, multiple regulatory components of the circadian clock mechanism perceive and respond to temperature changes.
Remarkably, little is known about the genetic and molecular basis of the response of the vertebrate clock to
Received March 24, 2005; Accepted August 12, 2005; Published September 27, 2005
DOI: 10.1371/journal.pbio.0030351
Copyright:Ó2005 Lahiri et al. This is an open-access article distributed under the terms of the Creative Commons Attribution License, which permits unrestricted use, distribution, and reproduction in any medium, provided the original author and source are credited.
Abbreviations: BMAL, Brain and muscle Arnt-like protein; CLK, clock; Cry, cryptochrome; DD, constant darkness; kb, kilobase; LD, light–dark; Mut, mutant; Per, period; RPA, RNase protection assay; WT, wild-type; ZT, Zeitgeber Time
Academic Editor: Derek Stemple, Wellcome Trust Sanger Institute, United Kingdom
temperature. Zebrafish represent an attractive model to explore this issue. Adult fish, larvae, and embryos remain viable over a wide range of core body temperatures (108C) that can be regulated accurately by simply controlling the temperature of the water [20]. Unlike other ectothermic vertebrates that have been used in the past to study temperature responses of the clock, zebrafish offer a powerful combination of molecular, genetic, and cell culture tools. Furthermore, the direct entrainment of peripheral clocks in zebrafish by light provides a model to investigate how two zeitgebers integrate to regulate clock function at the cellular level [21,22]. In a recent study of luciferase reporter transgenic zebrafish, Kaneko and col-leagues reported that the ambient temperature affects the levels and amplitude of cycling per3 expression, indicating that temperature can influence clock gene expression in this species [23].
Here we have investigated the effects of temperature on the zebrafish circadian clock in more detail. Specifically, we demonstrate that temperature cycles of as little as 28C are sufficient to entrain the zebrafish clock. Temperature steps drive significant changes in the expression levels of several clock genes in a gene-specific manner. In the case of theper4 gene, while E-box enhancer elements direct circadian expression rhythms, they do not mediate the decreases and increases in expression that immediately follow acute temperature changes. Also, we have studied how temperature affects light–dark (LD) cycle-entrained rhythmic transcrip-tion that is directed by the core clock mechanism via E-box elements. We confirm that the zebrafish circadian clock is temperature-compensated. Furthermore, temperature influ-ences the amplitude of rhythmic transcription, a property that could contribute to temperature compensation. The CLK protein expression levels, phosphorylation, and binding to E-box elements, as well as CLK transactivation efficiency, are all temperature-regulated. These temperature-regulated changes in CLK protein function may contribute to the observed changes in rhythm amplitude.
Results
Temperature Cycles Influence Clock Gene Expression in Zebrafish Embryos and Cells
It has been well-documented that exposure to LD cycles is essential for the establishment of circadian rhythms in zebrafish larvae [24,25]. We asked whether, in the absence of light, temperature cycles could also entrain the zebrafish circadian clock. Zebrafish larvae were raised from the late blastula stage (4 h post-fertilization) in constant darkness (DD) for 6 d, while being exposed to a 24-h, 48C temperature cycle (between 23.58C and 27.58C) and were then sacrificed at three hourly time points. Sibling larvae were raised at a constant temperature (25.3 8C) under LD cycle conditions and sacrificed in parallel. We then assayed the daily RNA expression profile of a representative group of core clock gene homologs (per2 & 4, cry2a & 3, and clock1) [26–29] by RNAse protection assay (RPA). In the case ofper4, cry3, clock1, and cry2a, rhythmic expression was detected under both temperature and LD cycle conditions (Figure 1A–1D). Expression ofper4 and cry3 peaked at, and just before, the dark–light transition, respectively (Figure 1A) and in the middle of the cold period (Figure 1B). Expression ofclock1
and cry2apeaked in the first half of the dark period and at the light–dark transition, respectively (Figure 1C) and at the high–low temperature transition and the middle of the warm period, respectively (Figure 1D). Thus the phase relationship between the expression rhythms of all four genes is preserved under LD and temperature cycles, with the high temperature phase roughly corresponding to the light period. Remarkably, larvae raised in a 28C daily temperature cycle gave comparable results (Figure S1A). Thus, exposure of zebrafish to even shallow temperature cycles during early development is sufficient to establish rhythmic clock gene expression. In contrast, while per2 rhythmic expression is encountered in the LD cycle larvae, low, non-oscillating levels are detected in the temperature cycle conditions (Figure 1E), in agreement with previous reports showing that per2 expression is light-driven [30,31]. This reveals a differ-ential response of clock gene expression during exposure to LD and temperature cycles.
We have previously demonstrated that zebrafish primary cell lines are powerful in vitro tools to explore the molecular basis of how light entrains the clock in zebrafish peripheral tissues [22,27]. Could these cells also be useful for studying the effects of temperature on the clock? We tested whether exposure to a 48C temperature cycle in DD induces rhythmic clock gene expression in the zebrafish PAC-2 cell line. Consistent with our larvae results, we observed an equivalent pattern of clock gene expression in the PAC-2 cells (unpublished data and Figure S1B). Control cells that remained in constant temperature conditions during the entire experiment failed to show expression rhythms. These results indicate that the clock mechanism in zebrafish primary cell lines is able to directly perceive and respond to temperature as well as lighting changes.
The daily expression peak shifts from 9 h after the warm– cold transition in 8:16 (8 h warm:16 h cold) cycles to 5 h after the same transition in 16:8 cycles, and in this way remains consistently locked to the middle of the cold period (Figure 2B). Thus, also this result points to the clock being entrained by temperature cycles. Interestingly, the start of the increase inper4expression consistently coincides with the warm–cold transition, with differences in the waveform leading to changes in the timing of the subsequent peak. This suggests
that temperature steps can also drive changes in clock gene expression.
Temperature Shifts Directly Drive Clock Gene Transcription
Previous results have demonstrated that temperature steps can elicit acute changes in the expression levels of clock genes in non-vertebrates [14]. Do zebrafish also show this property? We raised larvae at a constant temperature in DD, then abruptly shifted the temperature up or down by 88C (218C! Figure 1.Rhythmic Clock Gene Expression under LD and Temperature Cycles
Graphical summary of RPA assays are described:
(A)Per4(solid line) andcry3mRNA expression (dashed line) in zebrafish larvae raised for 6 d either in a light (12 h) or dark (12 h) cycle at a constant temperature (25.38C).
(B)Per4(solid line) andcry3mRNA expression (dashed line) in zebrafish larvae raised for 6 d in DD, under a temperature cycle of 48C (23.58C/11 h, 27.5 8C/11 h, plus 1 h for each heating and cooling phase). RNA samples were harvested during the seventh day (ZT0 is defined as the beginning of the heating and light periods).
(C and D) Equivalent analysis ofclock1(solid line) andcry2a(dashed line) expression in (C) LD, and (D) temperature cycle larvae.
(E)Per2expression was assayed in LD (dashed line) or temperature cycle (DT) larvae (solid line). By linear regression analysis, the slope of theDT trace has no significant deviation from zero (R2¼0.033 andp¼0.66, F-test). The LD cycle curve fits to a 6th-order polynomial regression model (R2¼0.96 and Runs test for deviation from modelp¼0.99).
In each case, zeitgeber time is plotted on thex-axis while the relative expression levels (percentage) are plotted on they-axis.b-actinlevels were used to standardize the results. The highest band intensity in each experiment was arbitrarily defined as 100%, and then all other values were expressed as a percentage of this value. All experiments were performed in triplicate, and error bars denote the standard deviation.
DOI: 10.1371/journal.pbio.0030351.g001
29 8C, or 29 8C ! 21 8C, respectively), and the resulting expression of a range of clock genes was assayed during the following 6 h (Figure 3A and 3B). Given the strong influence of temperature on the rate of early zebrafish development [20], the larvae at 218C were raised for 2 d more than those at 298C prior to the temperature step in order to ensure that both sets were at a comparable developmental stage. Expression of per4 and cry3 was strongly down-regulated following the temperature increase (3.360.4-fold and 1.76
0.2-fold, respectively, at 4 h following the temperature step up), and up-regulated following the temperature decrease (4.7 6 0.8-fold and 3.6 6 0.6-fold, respectively, at 4 h following the temperature step down), while the opposite response was observed forcry2a(1.860.2-fold increase and 2.0 6 0.3-fold decrease at 4 h following the temperature steps). The temperature steps did not affect the expression of clock1, per2,orb-actin. Furthermore, no significant changes in expression for any of the genes were detected in control samples that remained at a constant temperature (218C or 29
8C) in DD (Figure 3A and 3B). These results reveal that
changes in zebrafish clock genes expression do occur following temperature steps, and that this constitutes a gene-specific response.
To explore in more detail the mechanism underlying the changes in gene expression that follow temperature steps, we focused our attention on per4, a gene where we have previously studied the regulation by the circadian clock and light [27]. Do temperature steps affect the levels of per4 transcription? We investigated the effect of temperature steps on the expression of a 1.7-kilobase (kb)per4promoter– luciferase reporter construct in stably transfected PAC-2 cells (1.7-kb wild-type [WT], Figure 4A) [27]. As a control for the direct effect of temperature on the rate of the Figure 2.Temperature Cycles Entrain the Zebrafish Circadian Clock
(A) Quantification ofper4expression levels as measured by RPA, in WT PAC-2 cells initially exposed for 6 d to a 48C temperature cycle and then transferred to a constant temperature (25.58C) for 72 h. RNA extracts were prepared from 24 h to 72 h following transfer to the constant temperature at four hourly intervals. RPA band intensities were quantified and adjusted as described in Figure 1.
(B) RPA results quantifyingper4 expression levels in WT PAC-2 cells exposed for 5 d to warm:cold temperature cycles (as indicated below the
x-axis), including either a 8 h:16 h (blue trace), or a 16 h:8 h (red trace) cycle. The blue and red dashed lines and arrowheads indicate the delay between the warm–cold transition and the peak of per4 rhythmic expression in each temperature cycle. All experiments were performed in triplicate, and error bars denote the standard deviation.
DOI: 10.1371/journal.pbio.0030351.g002 Figure 3.(A) Larvae were raised in DD at 21Temperature Steps Regulate Clock Gene Expression Levels8C for 7 d and then shifted to 298C and harvested at the indicated times relative to the temperature shift (h). Controls remained at 21 8C and were harvested in parallel with the temperature shift larvae. RPA analysis of the indicated genes was then performed.‘‘t’’represents a tRNA control sample.
(B) As in (A), except that 5-d-old larvae were shifted from 298C to 218C, and controls remained at 298C.
luciferase-catalyzed bioluminescent reaction, in parallel we analyzed cells stably transfected with a luciferase reporter construct driven by the SV40 promoter and enhancer sequences (pGL3 Control). We previously confirmed that expression of this viral promoter reporter construct is neither regulated by the circadian clock nor by changes in temperature (unpublished data). Cells were exposed for 5 d in DD to 30 8C or 20 8C, then the temperature was decreased (308C to 208C, Figure 4B) or increased (208C to 30 8C, Figure 4C), and subsequently bioluminescence was assayed for 24 h. A temperature decrease resulted in sustained induction (3.34 6 0.63-fold increase) (Figure 4B), while a temperature increase led to significant down-regulation of per4 promoter expression (5.40 6 0.21-fold decrease) (Figure 4C) during the first 11 h following the temperature steps, relative to the pGL3 Control. Expression subsequently remained at these new levels for the remainder of the analysis (Figure 4B and 4C). Using RPA analysis, we confirmed that increases and decreases of luciferase mRNA expression occur following the temperature steps in the
1.7-kb WT transfected cells (Figure S2). These results reveal that a transcriptional mechanism is at least in part responsible for the changes in expression that follow temperature steps. Do these temperature-dependent changes in transcription use the same pathway or regulatory elements that mediate the clock regulation of per4, i.e., the E-box enhancer elements? We have previously demonstrated that mutation of E-box elements within the per4 promoter eliminates circadian clock control [27]. Therefore, we compared the acute temperature response of a 0.4-kb per4 promoter luciferase reporter construct containing three E-box ele-ments (0.4-kb WT, Figure 4A) with the same construct where the sequences of all E-box elements have been mutated [0.4-kb mutant (Mut)7/156/173]. The mutation of the E-box elements did not eliminate the increases (1.560.16-fold) or decreases (3.0 6 0.11-fold) in expression following temper-ature steps that were observed in the 0.4-kb WT construct (1.9 6 0.17-fold increase and 4.1 6 0.12-fold decrease) (Figure 4D and 4E). Thus, the results reported here demonstrate that promoter elements distinct from E-boxes, Figure 4.Temperature Steps Induce Changes inper4Gene Transcription
(A) Schematic representation of the 1.7-kb WT (red), 0.4-kb WT (green), and the 0.4-kb Mut7/156/173 (blue)per4promoter luciferase reporter constructs. E-box elements are represented by rectangles (CACGTG) and ellipses (AACGTG), and their positions relative to the principal transcription start site are labeled. E-boxes that have been ablated by mutation to the sequence (CTCGAG) are shown by a cross [27].
(B) Bioluminescence from PAC-2 cells stably transfected with the 1.7-kb WT construct adapted to 308C and then shifted rapidly to 208C (red trace). During the entire assay, the plate was held inside the Topcount counting chamber, and each well was counted for 3 s at intervals of approximately 5.5 min. Bioluminescence (counts per second) is plotted against time (h) following the temperature shift. A black trace represents pGL3Control transfected cells bioluminescence.
(C) Equivalent experiment to that in panel B, with cells adapted to 208C and shifted to 308C.
(D and E) Cells transfected with the 0.4-kb WT and 0.4-kb Mut7/156/173 constructs were subjected to the same rapid temperature decrease and increase, respectively, as described for (B) and (C).
All traces represent the mean values of 16 independent wells. Each panel is representative of at least three independent experiments. DOI: 10.1371/journal.pbio.0030351.g004
within 0.4 kb of the per4 transcription start site, are responsible for driving the changes in expression in response to temperature steps.
The Zebrafish Circadian Clock Is Temperature-Compensated
An essential property of the zebrafish circadian clock is that it accurately measures time over a range of temperatures. Temperature-dependent changes in core clock function may be predicted to compensate for the tendency of the speed of the oscillator to vary with the ambient temperature [1,2]. We initially wished to confirm that the zebrafish clock is temperature-compensated. We measured the period length of circadian-clock-generated rhythms entrained by LD cycles as a function of temperature, in two luciferase reporter constructs. The first construct contained four E-box elements within their natural context of theper4promoter (1.7-kb WT), while the second was a heterologous promoter containing four copies of aper4 E-box element cloned upstream of a synthetic TATA box [4xE-box (7)]. The reporter cells were assayed during incubation at a constant 208C, 258C, or 308C (Figure 5 and [27]) for 3 d in LD cycles and then transferred to DD for 3 d. We measured the period length of the rhythmic luciferase expression between the second and third day in DD. The free-running period length (s) for the E-box heterologous promoter was 22.9860.17 h at 208C, 25.196
0.21 h at 258C, and 25.4660.15 h at 308C, predicting that the temperature coefficient Q10¼0.9 over the range 208C to 30 8C (see Materials and Methods, and Figure 5A and 5B). This confirms that the zebrafish clock indeed shows temper-ature compensation over a 108C range. However, calculations of period length were more problematic for the per4 promoter reporter, particularly at 20 8C, due to its very rapid dampening in DD conditions (Figure 5C and 5D). Interestingly, the bioluminescence traces of both constructs showed a pronounced change in rhythm amplitude between 208C (Figure 5A and 5C) and 308C (Figure 5B and 5D), both in LD and free running conditions [for 1.7-kb WT, 12.16 1.6-fold at 308C, and 3.36 0.56-fold at 208C, and for 4xE-box (7) 9.7 61.0-fold at 308C, and 1.660.11-fold at 208C as measured on the second d in LD]. To confirm that this also occurs in the case of the endogenousper4gene, we examined per4RNA expression in cells entrained by an LD cycle at a constant 20 8C or 30 8C (Figure 5E and 5F). A higher-amplitude rhythm of expression was observed at 308C (7.96
0.56-fold difference between peak and trough), compared with that at 208C (1.9160.5-fold). Thus, at least in part, the ambient temperature strongly influences the amplitude of circadian rhythms of transcription, during and following entrainment by LD cycles. Such a property has been already proposed by mathematical models to explain temperature compensation of the circadian clock [33–35].
E-box Function Is Influenced by Temperature
What makes the amplitude of E-box-driven rhythmic expression respond to temperature? The basic helix-loop-helix Per-Arnt-Sim domain clock proteins, CLK and BMAL, bind to E-boxes as heterodimers and thereby activate tran-scription at certain phases of the circadian clock cycle [13]. Thus, to test whether transcriptional activation mediated by CLK and BMAL was temperature dependent, we transiently transfected the 4xE-box (7) luciferase reporter plasmid
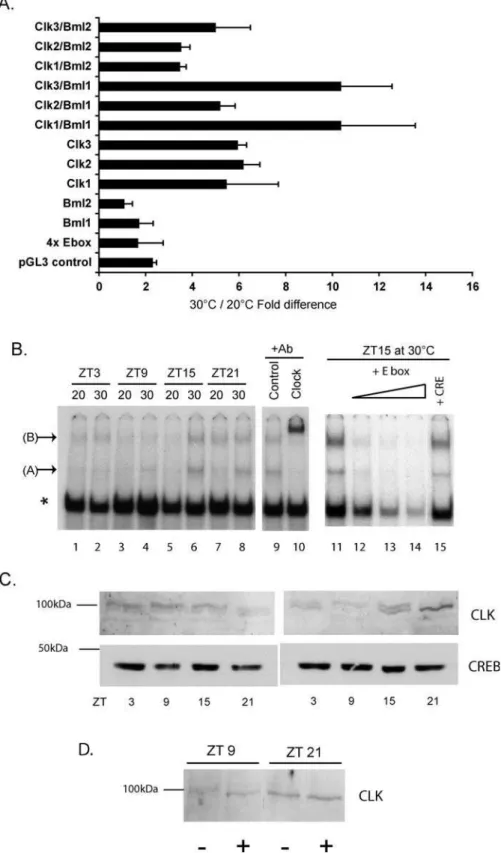
together with various combinations of zebrafish CLK1, 2, and 3, and BMAL1 and 2 expression constructs. We compared the levels of activation between cells incubated at 208C and 308C (Figure 6A). At 30 8C, activation driven by all three CLK family members alone was 5- to 6-fold higher than at 208C. Co-transfection of CLK1 and CLK3 in combination with BMAL1 led to an even higher activation at 308C relative to 20
8C (6- to 10-fold). In contrast, the activation obtained by transfecting BMAL 1 or 2, the reporter construct alone, or the pGL3Control plasmid was only 1.5- to 2-fold higher at 30
8C than at 20 8C. Thus, the amplitude of transcriptional activation driven by the members of the CLK family, alone or in combination with BMAL1, appears to be strongly temper-ature-dependent in zebrafish cells.
Does temperature influence the binding of endogenous CLK protein-containing complexes to circadian E-boxes? Nuclear extracts were prepared at specific time points from cells maintained under a LD cycle, at 208C or 308C and then tested for binding to an E-box probe containing two consensus E-box sequences, by electrophoretic mobility shift assay (Figure 6B). Interestingly, levels of two slow mobility complexes varied according to the temperature and the time of day. Levels of one complex (complex A) in 30 8C cells followed a 24-h rhythm with peak levels at Zeitgeber Time (ZT) ZT15 and a trough at ZT3 (Figure 6B, lanes 6 and 2, respectively). In contrast, at 20 8C this complex was barely detectable at all time points. At 30 8C, levels of a second complex (complex B) showed a rhythm similar to that observed for complex A, while at 20 8C peak levels were reduced and shifted to ZT21 (lanes 1, 3, 5, and 7). Levels of a third abundant complex (indicated by an asterisk) did not change significantly according to the time of day or temper-ature. In control experiments, the binding of all three complexes at ZT15 at 308C were efficiently competed by an excess of cold E-box sequence (lanes 11–14) but not by an unrelated cAMP response element sequence (lane 15). Thus, it appears that temperature affects the levels of certain specific E-box-binding complexes. In order to test whether CLK proteins are components of these complexes, we performed a supershift assay using a mouse CLK-specific antibody (Figure 6B). This antibody efficiently supershifted both complexes A and B, but not the abundant complex (indicated by an asterisk) (lane 10), while a control antibody (anti-dopamine transporter) failed to supershift any of the complexes (lane 9). To test which of the three zebrafish CLK proteins were recognized by this mouse antibody, myc-tagged versions of the CLK proteins were expressed in an in vitro translation system and were then analyzed by western blotting. While all zebrafish CLK proteins were efficiently recognized by the control myc tag antibody, only CLK1 (and, to a lesser extent, CLK3) were detected by the mouse CLK-specific antibody (Figure S3).
molecular weight band was stronger. In contrast, at 30 8C, overall CLK protein levels changed during the 24-h cycle, with peak levels at ZT21 and a trough at ZT9 (Figure 6C). Also, at 308C, the relative levels of the two bands changed considerably between the four time points. Specifically, the
intensity of the higher molecular weight band decreased significantly between ZT9 and ZT21, while the intensity of the lower molecular weight band increased (Figure 6C).
Does this result reflect temperature-dependent changes in CLK post-translational modifications? The phosphorylation Figure 5.Temperature Compensation and the Amplitude of E-box-Directed Rhythmic Expression
(A) Bioluminescence profile of 4xE-box (7) reporter cells held at 208C under a LD cycle and then transferred to DD conditions. Plates were counted once per hour and maintained in robotic stacking units between assays, where they were illuminated.
(B) Equivalent experiment to panel A, with cells maintained at 308C.
(C) Bioluminescence traces from 1.7-kb WTper4reporter cells maintained at 208C under LD cycle and DD conditions. (D) Bioluminescence traces from 1.7-kb WTper4reporter cells maintained at 308C under LD cycle and DD conditions.
(E) RPA analysis ofper4expression in WT PAC-2 cells held at 208C and 308C under an LD cycle for 3 d. RNA extracts were prepared on the fourth day at 3-h intervals during one 24-h cycle. Time 0 represents ZT 0: the onset of the light period. A white and black bar above the autoradiograph indicates the duration of the light and dark periods. RPA results with ab-actin loading control are also shown.‘‘t’’represents a tRNA control sample.
(F) A bar graph shows quantification of the peak (ZT3) and trough (ZT15)per4expression values at 208C and 308C plotted as described in Figure 1, with error bars representing the standard deviation of three independent experiments.
All bioluminescence traces represent the mean values of 16 independent wells. Each panel is representative of at least three independent experiments. DOI: 10.1371/journal.pbio.0030351.g005
Figure 6.Temperature Influences CLK Protein Expression and Function
(A) In vitro luciferase assays of transiently transfected PAC2 cells. The combinations of CLK (Clk) and BMAL (Bml) expression vectors cotransfected with the 4x Ebox (7) reporter plasmid are indicated for each assay result. Control cells were transfected with the reporter plasmid or with the pGL3 Control plasmid alone. Values represent the mean fold difference between luciferase activities measured in 308C and 208C, 60 h after transfection. All assays were standardized for transfection efficiency using ab-galactosidase assay. The results are based on four independent experiments, and error bars indicate the standard deviation.
status of several clock proteins in various model systems has been shown to vary through the circadian cycle, a property linked with changes in the protein stability or function [36– 38]. In many cases, different levels of phosphorylation can be visualized by changes in electrophoretic mobility of the protein. We tested whether the multiple CLK-immunoreac-tive bands represented various phosphorylated forms of this protein. Extracts from the peak (ZT21) and trough (ZT9) points in the 30 8C cell extracts were treated with phosphatase before western analysis in parallel with un-treated controls. Phosphatase treatment of the ZT9 extract increased the mobility of the CLK band so that it co-migrated with the single CLK-immunoreactive band in the ZT21 extract (Figure 6D). The mobility of the ZT21 extract band did not alter with phosphatase treatment. This result points to temperature affecting the amplitude of cycling CLK protein levels and their phosphorylation.
Discussion
The zebrafish, as an ectotherm, represents an ideal vertebrate model system to study the effects of temperature on circadian clock function. Given the geographical distri-bution, and the shallow, fresh-water habitats of natural populations of zebrafish (data from http://www.fishbase.org), it seems likely that their core body temperature would naturally be subjected to a day–night rhythm, as well as seasonal changes. It is therefore reasonable to predict that temperature would normally play a role in regulating the circadian timing system. Our results have highlighted four responses of the zebrafish clock to temperature: (1) entrain-ment by even shallow temperature cycles, (2) regulation of the expression levels of many clock genes by temperature steps in a gene-specific manner, (3) temperature compensation, and (4) a strong effect of the ambient temperature on the amplitude of cycling expression of certain clock genes. Furthermore, our observation that the clock in cell lines responds directly to temperature reinforces the notion of autonomy in zebrafish peripheral clock entrainment and provides a valuable cell culture tool to explore the temper-ature response [22,27].
Molecular Mechanisms for Entrainment by Temperature Our results clearly point to temperature cycles entraining rhythms of circadian gene expression in zebrafish. We base this conclusion on two observations: (i) per4 expression rhythms persist after transfer from temperature cycles to constant temperature, and (ii) the phase of theper4rhythm changes relative to the phase of the temperature cycle as a function of the length of the thermoperiod. However, the response of the per4 rhythm to temperature cycles with different thermoperiods suggests that temperature changes could also drive expression of certain clock genes (the increase in per4 expression consistently coincides with the warm–cold transition). Indeed, we show that acute
temper-ature steps significantly alter the expression levels of several clock genes in a gene-specific manner, not simply reflecting global changes in transcription rate. In the case of theper4 promoter, these changes do not involve circadian clock regulation via E-boxes, suggesting a temperature-driven response (see scheme in Figure 7A). The acute responses observed forper4, cry3,andcry2aafter the temperature steps match their expression profile, following the individual temperature transitions under temperature cycle conditions. Thus, we speculate that the acute temperature regulation of these genes may contribute to entrainment of the clock mechanism and so represents a component of the temper-ature input pathway (Figure 7A). Within this input pathway, the gene expression response may lie downstream of more rapid temperature-dependent regulatory events that also contribute to entrainment of the clock. The per4 gene expression rhythm observed under temperature cycles may represent the integration of the temperature-driven response (via element X) and regulation by the entrained circadian clock (via E-boxes). Further studies will be required to test these hypotheses.
An ectothermic organism needs to modify many aspects of its physiology in order to adapt to substantial changes in core body temperature. The presence of circadian and circannual clocks and the ability to respond to photoperiodic changes provide mechanisms to anticipate regular daily and seasonal temperature changes and so give sufficient time to mount an appropriate gene expression response [39]. However, many studies have shown that changes in gene expression also occur at the cellular level in direct response to temperature alterations [39–41]. The transcriptional mechanism that regulates per4 expression following temperature shifts may therefore constitute a more general mechanism whereby cells perceive and adapt to temperature changes.
By comparing gene expression under LD and temperature cycle conditions, we have confirmed previous reports that per2expression is light driven [30,31] and now show that this clock gene is not induced by all clock-entraining signals (zeitgebers). Thus, light and temperature cycles appear, at least in part, to drive gene expression within the circadian clock by distinct pathways. The presence of larger clock gene families in teleosts may have led to specialization of individual genes to respond to single zeitgebers [25].
Temperature Regulates the Amplitude of Rhythmic Clock Gene Expression: A Mechanism Underlying Temperature Compensation?
Temperature compensation of the circadian clock is essential to preserve its timing function over a range of temperatures [1]. We have confirmed that the zebrafish PAC-2 cell clock is temperature-compensated, actually decreasing the rate of its oscillation slightly when the temperature is increased, as has been reported for other cell culture model systems [7,8]. Mathematical models in which temperature influences the amplitude of the circadian pacemaker have (C) Western blotting assay using the anti-mouse CLK antibody of the same nuclear extracts tested in the electrophoretic mobility shift assay analysis of panel B. The migration of a 100-kDa marker band is shown. Below are shown western blotting results for the same extracts using an anti-mouse CREB antibody as a loading control.
(D) Western blot assay of CLK protein in 308C extracts prepared at ZT9 or ZT21 (time points representing the trough and peak, respectively, of the CLK protein rhythm). Samples were prepared with (þ) or without () treatment with alkaline phosphatase prior to electrophoresis and transfer. In panels B, C, and D, data are representative of at least three independent experiments.
DOI: 10.1371/journal.pbio.0030351.g006
been proposed to explain various aspects of the behavior of circadian clock outputs including their temperature compen-sation [33–35]. Consistently, we observe that the amplitude of circadian E-box-directed rhythmic transcription entrained by LD cycles is 6-fold higher at 308C than at 208C, while the phase remains constant. The temperature also influences the amplitude ofper4rhythmic expression. However, the changes in the amplitude of the E-box heterologous promoter rhythm originate from differences in the peak values, while for the per4promoter, the amplitude is determined by differences in the trough values. To explain this apparent discrepancy, we propose a model (Figure 7B) where theper4 promoter can integrate temperature and light regulatory input from the E-boxes together with regulation by other temperature-driven elements (X in our model). This ultimately results in the trough levels of expression being set by the E-box-independ-ent, temperature-driven regulation (higher trough levels at lower temperatures). Instead, therelativelevels of the peaks respond to E-box input (peak values remain constant since the amplitude of light-cycle-entrained rhythmic expression de-creases at lower temperatures) (Figure7B).
We have explored the mechanism whereby the amplitude of E-box-directed expression rhythms respond to the temper-ature. The CLK-directed activation of an E-box reporter construct is 5- to 10-fold higher at 30 8C than at 20 8C as measured in transfection assays. This strong effect of temperature on transcriptional activation appears to be CLK-specific, because not only is E-box reporter expression driven by BMAL alone, expression of control reporter constructs differs by only 1.5- to 2-fold over the same 108C range. Our studies using PAC-2 cells have also revealed that the levels of endogenous CLK-containing nuclear complexes that bind specifically to E-boxes as well as CLK protein levels and phosphorylation change as a function of temperature and time of day during entrainment by a LD cycle. We speculate that these properties may ultimately define the E-box rhythm amplitude (Figure 7B). Indeed, regulation of the phosphorylation of clock proteins has been tightly linked with other basic properties of the circadian clock [36–38].
Looking from a broader perspective, the temperature-responsive transcriptional regulatory mechanisms that we have revealed in this study may form part of more general mechanisms that directly adapt gene expression and cell physiology to changes in ambient temperature. Thus the implications of our work may reach beyond the circadian clock.
Materials and Methods
RNA and protein analysis.RNA extractions from larvae and cells, RPAs, and theper4,b-actin,andclock1riboprobes have been described [27,28]. The remaining riboprobes were for per2 [26,42] (from positions 3113–3874 relative to the translation start site), for cry2a
[29] (positions 1589–1968), and for cry3[29] (positions 1339–1797). The clock cDNAs were transcribed and translated using the TnT-Quick Coupled Transcription/Translation System (Promega, Madi-son, Wisconsin, United States), before western blotting (BioRad, Hercules, California, United States) using an anti-mouse CLK (Santa Cruz Biotechnology, Santa Cruz, California, United States) or myc antibody (Upstate Biotechnology, Lake Placid, New York, United States), and visualization with the ECL detection system (Amersham Biosciences, Little Chalfont, United Kingdom). For phosphatase treatments, nuclear extracts were prepared as described for the electrophoretic mobility shift assays, without the addition of phosphatase inhibitors. Extracts were then treated with 1 unit of calf intestinal phosphatase (Roche, Basel, Switzerland) in nuclear extract buffer, at 378C for 15 min. Laemmli buffer was added to a final concentration of 13and the samples heated at 958C for 5 min before SDS electrophoresis and western blotting analysis. The polyclonal anti-mouse CREB antibody was purchased from Cell Signaling Technology (Beverly, Massachusetts, United States).
Transient transfection assays.A standard electroporation method was used [27]. Transfected cells were assayed using an in vitro luciferase assay system (Promega). The CLK and BMAL expression constructs were based on the pcDNA3.1/Myc-His expression vector (Invitrogen, Carlsbad, California, United States). Co-transfection with the plasmid pcDNA3.1/Myc-His (þ)/lacZ and a b-galactosidase assay served to control for transfection efficiency.
Electrophoretic mobility shift and supershift assays.Preparation of nuclear extracts, radioactive labeling and purification of oligonucleo-tide probes, and EMS assays were performed as described elsewhere [43]. The E-box probes contained a tandem repeat of the per4
promoter E-box (7) sequence (sense oligo: 59 -GAAGCACGTG-TACTCGGAAGCACGTGTACTCG-39) [27]. Supershift assays using an anti-mouse CLK and dopamine transporter antibodies (Santa Cruz Biotechnology) were performed as described elsewhere [43].
Cell cultures and in vivo luciferase assays.Culture conditions and in vivo luciferase assays have been described [27]. In 0.4-kb Mut7/ 156/172 contains a per4promoter fragment, extending between 207 andþ190 relative to the transcription start site, cloned in pGL3Basic where the E-box sequences are mutated to CTCGAG by site-directed mutagenesis.
Figure 7.Model for Temperature Regulation of theper4Promoter (A) Temperature steps entrain the phase of the clock by driving expression levels of per4 and other clock genes via a hypothetical enhancer element X. Temperature decreases result in expression increases, and vice versa. Although E-boxes ultimately mediate regulation of theper4 promoter by the entrained clock, they do not participate in the temperature-driven response.
Raising zebrafish larvae, temperature, and lighting control.The zebrafish Tu¨bingen strain was maintained and crossed using standard methods [20]. Flasks containing cells or larvae were submerged in 60-l water baths with circulating heating and cooling units (Lauda, Lauda-Ko¨nigshofen, Germany) and illuminated with a tungsten light source (11lW/cm2) [24]. Temperature cycles were generated by controlling
the heating and cooling units using Wintherm plus software (Lauda).
Data analysis.Bioluminescence data were analyzed using Microsoft Excel or CHRONO software [27,44]. Period estimates measured after 2 d in DD were made by linear regression following peakfinder analysis with CHRONO [44]. For Q10 temperature coefficient
calculations, period length estimates for cells held at 208C, 258C, and 308C were calculated as cycles per hour and then plotted against temperature. Linear regression analysis revealed a good fit to a straight line (R2¼0.9734). Mean period lengths at 208C and 308C were then substituted into the equation Q10¼(R2/R1)10/(T2-T1), where
R is rate and T is temperature. Autoradiographic images were quantified with the aid of Scion Image software (NIH, http://rsb.info. nih.gov/nih-image/). Statistical analysis was performed with the aid of GraphPad PRISM 4 software (GraphPad Software, San Diego California, United States).
Supporting Information
Figure S1. Temperature Cycles Induce Rhythmic per4 mRNA Expression in Larvae and PAC-2 Cells
(A) RPA analysis ofper4andb-actinexpression in larvae raised for 7 d in DD on a 28C temperature cycle (248C/11.5 h, 268C /11.5 h, plus an additional 0.5 h for both heating and cooling phases). During the seventh day, RNA was harvested at the indicated times (Time 0 is defined as the beginning of the heating period).
(B) RPA analysis ofper4andb-actinexpression in PAC-2 cells cultured for 7 d in a 48C temperature cycle (23.58C/11 h, 27.58C/11 h, plus 1 h for each heating and cooling phase) under DD conditions. Cells were harvested during the seventh day. Control cells maintained at a constant temperature (25 8C) during the entire experiment were harvested and assayed in parallel.
Found at DOI: 10.1371/journal.pbio.0030351.sg001 (2.16 MB TIF).
Figure S2.Temperature Steps Induce Changes inLuciferaseReporter mRNA Expression
(A) Quantification of RPA analysis ofluciferasemRNA expression in
1.7-kb WT stably transfected cells, 0, 1, 3, and 6 h following transfer from 308C to 208C. The experiment was performed in triplicate, and error bars denote the standard deviation.
(B) Equivalent analysis of luciferase expression in cells transferred from 208C to 308C.
Found at DOI: 10.1371/journal.pbio.0030351.sg002 (512 KB TIF).
Figure S3.Analysis of Recombinant Zebrafish CLOCK Proteins Western blotting analysis of in vitro transcription/translation extracts containing myc-tagged CLOCK proteins (Clock-myc 1, 2, and 3). Blots were treated with an anti-myc tag monoclonal antibody (myc-Ab) or an anti-mouse CLK polyclonal antibody (Clock-Ab).
Found at DOI: 10.1371/journal.pbio.0030351.sg003 (2.24 MB TIF).
Accession Numbers
The GenBank (http://www.ncbi.nlm.nih.gov/Genbank) accession num-bers for the genes and gene products discussed in this paper areclock1
(AF133306),clock2 (AB087255),clock3 (AB087256),cry2a(AB042250),
cry3(AB042252), andper2(AY171100).
Acknowledgments
We would like to thank Ferenc Mu¨ller, Darren Gilmour, David Whitmore, Andreas Heyd, and Cristiano Bertolucci for critical reading and very helpful comments. We are also extremely grateful for the excellent technical assistance of Andreas Heyd. This work was supported by funds and fellowships from the Max -Planck Society and the Centre National de la Recherche Scientifique (CNRS: France). NSF participated in a joint CNRS/Max-Planck Society exchange program. TD was supported by a long-term fellowship from the European Molecular Biology Organization.
Competing interests.The authors have declared that no competing interests exist.
Author contributions. KL and NSF conceived and designed the experiments. KL and CS performed the experiments. KL, DV, and NSF analyzed the data. DV, SBG, and CS contributed reagents/ materials/analysis tools. DV, TD, and NSF wrote the paper. &
References
1. Sweeney BM, Hastings JW (1960) Effects of temperature upon diurnal rhythms. Cold Spring Harb Symp Quant Biol 25: 87–104.
2. Pittendrigh CS (1954) On temperature independence in the clock system controlling emergence time inDrosophila. Proc Natl Acad Sci U S A 40: 1018–1029.
3. Liu Y, Garceau NY, Loros JJ, Dunlap JC (1997) Thermally regulated translational control of FRQ mediates aspects of temperature responses in the neurospora circadian clock. Cell 89: 477–486.
4. Martino-Catt S, Ort DR (1992) Low temperature interrupts circadian regulation of transcriptional activity in chilling-sensitive plants. Proc Natl Acad Sci U S A 89: 3731–3735.
5. Pittendrigh CS (1993) Temporal organization: Reflections of a Darwinian clock-watcher. Annu Rev Physiol 55: 16–54.
6. Underwood H, Calaban M (1987) Pineal melatonin rhythms in the lizard Anolis carolinensis: I. Response to light and temperature cycles. J Biol Rhythms 2: 179–193.
7. Izumo M, Johnson CH, Yamazaki S (2003) Circadian gene expression in mammalian fibroblasts revealed by real-time luminescence reporting: Temperature compensation and damping. Proc Natl Acad Sci U S A 100: 16089–16094.
8. Tsuchiya Y, Akashi M, Nishida E (2003) Temperature compensation and temperature resetting of circadian rhythms in mammalian cultured fibroblasts. Genes Cells 8: 713–720.
9. Ruby NF, Burns DE, Heller HC (1999) Circadian rhythms in the suprachiasmatic nucleus are temperature-compensated and phase-shifted by heat pulses in vitro. J Neurosci 19: 8630–8636.
10. Damiola F, Le Minh N, Preitner N, Kornmann B, Fleury-Olela F, et al. (2000) Restricted feeding uncouples circadian oscillators in peripheral tissues from the central pacemaker in the suprachiasmatic nucleus. Genes Dev 14: 2950–2961.
11. Brown SA, Zumbrunn G, Fleury-Olela F, Preitner N, Schibler U (2002) Rhythms of mammalian body temperature can sustain peripheral circadian clocks. Curr Biol 12: 1574–1583.
12. Wager-Smith K, Kay SA (2000) Circadian rhythm genetics: From flies to mice to humans. Nat Genet 26: 23–27.
13. Reppert SM, Weaver DR (2001) Molecular analysis of mammalian circadian rhythms. Annu Rev Physiol 63: 647–676.
14. Liu Y, Merrow M, Loros JJ, Dunlap JC (1998) How temperature changes reset a circadian oscillator. Science 281: 825–829.
15. Majercak J, Sidote D, Hardin PE, Edery I (1999) How a circadian clock adapts to seasonal decreases in temperature and d length. Neuron 24: 219–230. 16. Collins BH, Rosato E, Kyriacou CP (2004) Seasonal behavior inDrosophila
melanogasterrequires the photoreceptors, the circadian clock, and phos-pholipase C. Proc Natl Acad Sci U S A 101: 1945–1950.
17. Majercak J, Chen WF, Edery I (2004) Splicing of the period gene 3’-terminal intron is regulated by light, circadian clock factors, and phospholipase C. Mol Cell Biol 24: 3359–3372.
18. Sidote D, Majercak J, Parikh V, Edery I (1998) Differential effects of light and heat on theDrosophilacircadian clock proteins PER and TIM. Mol Cell Biol 18: 2004–2013.
19. Gekakis N, Saez L, Delahaye-Brown AM, Myers MP, Sehgal A, et al. (1995) Isolation of timeless by PER protein interaction: Defective interaction between timeless protein and long-period mutant PERL. Science 270: 811–815. 20. Westerfield M (2000) The zebrafish book. A guide for the laboratory use of
zebrafish(Danio rerio). Eugene (Oregon): University of Oregon Press. 21. Njus D, McMurry L, Hastings JW (1977) Conditionality of circadian
rhythmicity: Synergistic action of light and temperature. J Comp Physiol B 117: 335–344.
22. Whitmore D, Foulkes NS, Sassone-Corsi P (2000) Light acts directly on organs and cells in culture to set the vertebrate circadian clock. Nature 404: 87–91.
23. Kaneko M, Cahill GM (2005) Light-dependent development of circadian gene expression in transgenic zebrafish. PLoS Biol 3: e34.
24. Dekens MP, Santoriello C, Vallone D, Grassi G, Whitmore D, et al. (2003) Light regulates the cell cycle in zebrafish. Curr Biol 13: 2051–2057. 25. Cahill GM (2002) Clock mechanisms in zebrafish. Cell Tissue Res 309: 27–34. 26. Delaunay F, Thisse C, Thisse B, Laudet V (2003) Differential regulation of Period 2 and Period 3 expression during development of the zebrafish circadian clock. Gene Expr Patterns 3: 319–324.
28. Whitmore D, Foulkes NS, Strahle U, Sassone-Corsi P (1998) Zebrafish clock rhythmic expression reveals independent peripheral circadian oscillators. Nat Neurosci 1: 701–707.
29. Kobayashi Y, Ishikawa T, Hirayama J, Daiyasu H, Kanai S, et al. (2000) Molecular analysis of zebrafish photolyase/cryptochrome family: Two types of cryptochromes present in zebrafish. Genes Cells 5: 725–738.
30. Pando MP, Pinchak AB, Cermakian N, Sassone-Corsi P (2001) A cell-based system that recapitulates the dynamic light-dependent regulation of the vertebrate clock. Proc Natl Acad Sci U S A 98: 10178–10183.
31. Cermakian N, Pando MP, Thompson CL, Pinchak AB, Selby CP, et al. (2002) Light induction of a vertebrate clock gene involves signaling through blue-light receptors and MAP kinases. Curr Biol 12: 844–848.
32. Pittendrigh CS (1960) Circadian rhythms and the circadian organization of living systems. Cold Spring Harb Symp Quant Biol 25: 159–184. 33. Pittendrigh CS, Kyner WT, Takamura T (1991) The amplitude of circadian
oscillations: Temperature dependence, latitudinal clines, and the photo-periodic time measurement. J Biol Rhythms 6: 299–313.
34. Lakin-Thomas PL, Brody S, Cote GG (1991) Amplitude model for the effects of mutations and temperature on period and phase resetting of the Neurosporacircadian oscillator. J Biol Rhythms 6: 281–297.
35. Barrett RK, Takahashi JS (1997) Lability of circadian pacemaker amplitude in chick pineal cells: A temperature-dependent process. J Biol Rhythms 12: 309–318.
36. Liu Y, Loros J, Dunlap JC (2000) Phosphorylation of theNeurosporaclock protein FREQUENCY determines its degradation rate and strongly influences the period length of the circadian clock. Proc Natl Acad Sci U S A 97: 234–239.
37. Nakajima M, Imai K, Ito H, Nishiwaki T, Murayama Y, et al. (2005) Reconstitution of circadian oscillation of cyanobacterial KaiC phosphor-ylation in vitro. Science 308: 414–415.
38. Sathyanarayanan S, Zheng X, Xiao R, Sehgal A (2004) Post-translational regulation ofDrosophilaPERIOD protein by protein phosphatase 2A. Cell 116: 603–615.
39. Johnston IA (1990) Cold adaptation in marine organisms. Philos Trans R Soc Lond B Biol Sci 326: 655–666, discussion 666–667.
40. Airaksinen S, Jokilehto T, Rabergh CM, Nikinmaa M (2003) Heat- and cold-inducible regulation of HSP70 expression in zebrafish ZF4 cells. Comp Biochem Physiol B Biochem Mol Biol 136: 275–282.
41. Imamura S, Ojima N, Yamashita M (2003) Cold-inducible expression of the cell division cycle gene CDC48 and its promotion of cell proliferation during cold acclimation in zebrafish cells. FEBS Lett 549: 14–20. 42. Hirayama J, Fukuda I, Ishikawa T, Kobayashi Y, Todo T (2003) New role of
zCRY and zPER2 as regulators of sub-cellular distributions of zCLOCK and zBMAL proteins. Nucleic Acids Res 31: 935–943.
43. Vallone D, Pellecchia MT, Morelli M, Verde P, DiChiara G, et al. (1997) Behavioural sensitization in 6-hydroxydopamine-lesioned rats is related to compositional changes of the AP-1 transcription factor: Evidence for induction of FosB- and JunD-related proteins. Brain Res Mol Brain Res 52: 307–317.