Preliminary communication UDC 339.72.053.1
Current account deficit sustainability
in selected transition economies
*Aleksander Aristovnik
1Abstract
The article examines the question of whether the current account deficits seen in selected transition economies in recent years mainly as a symptom of the dynamic economic activity of the catching-up process are a source of potential macroeconomic destabilisation. Given the possible significant reduction of capital flows, as well as restrictions and lessons from recent financial crises, current account deficits must be closely monitored in the region. In this respect, the issue of ‘current account sustainability’ in seventeen transition economies is investigated. For this purpose, two accounting frameworks (Milesi-Ferreti and Razin, 1996; Reisen, 1998) based on certain strict assumptions are employed. The results show that if the observed level of foreign direct investment (FDI) flows is kept in the medium run almost all countries could optimally have a higher level of external deficit, with the exception of countries such as Baltic States, Hungary, Macedonia, Moldova and Romania. Accordingly, the maintenance of relatively large FDI inflows (especially greenfield investments) to national economies is a key priority in securing future external sustainability. In the end, the results indicate that current account deficits of transition economies that exceed 5 percent of GDP generally involve problems of their external sustainability.
Key words: transition economies, current account deficits, sustainability, FDI JEL classification: F32, F47
1. Introduction
The current account balance is an important indicator of a transition economy’s performance. Its significance stems from the fact that the current account balance, reflecting the saving-investment ratio, is closely related to the status of the fiscal balance and private savings which are key factors of economic growth. Practically all
81
*
Received: 20-09-2005; accepted: 25-04-2006
1 PhD, University of Ljubljana, Faculty of Administration, Gosarjeva 5, 1000 Ljubljana, Slovenia.
transition economies have been involved in their own catching-upprocesses which includes financing a huge amount of productive investment without endangering their external sustainability as far as their current account positions and external debt are concerned. In fact, these economies suffer from relatively low and even stagnant saving rates. Hence, to close the gapthey need to turn to foreign saving which has generally induced the high and even growing current account deficits of the last decade. In this respect, the problem of external imbalances is particularly important for Central and Eastern European (CEE) economies which joined the EU in May 2004 and have already expressed their desire to adopt the Euro as soon as possible. Consequently, for the new (and other prospective) members of the EU a trade-off emerged between the catching upprocess and meeting the qualitative current account Maastricht criteria.2
The rise in current account deficits in transition economies has raised doubts about their sustainability and concerns regarding the potential impact that a rapid and disorderly correction of these imbalances might have. Roubini and Wachtel (1998) argued that the current account deficits seen in transition economies reflect two important aspects. On one hand, these deficits reflect the success of structural changes that have enabled capital and investment inflows and have opened up prospects of fast economic growth. On the other hand, from another perspective, current account deficits frequently reflect mismanaged transition processes featuring unsustainable imbalances that are potentially a source of value or a balance of payments crisis (e.g. Czech Rep. (1997), Russia (1998). In line with this, strong demands emerged for assessing the sustainability of the external position of so far mainly neglected transition economies.
The article is organised as follows. The next section presents current account balance as well as fiscal balance trends in transition economies in the 1992-2003 period. Section 3 presents some theoretical considerations and empirical evidence on the current account balance and its sustainability, which have so far mainly been concentrated on developed economies. Therefore, Section 4 describes the empirical methodology, assumptions, data and empirical results of assessed sustainable current account positions for the selected transition economies. The empirical work applies a solvency constraint inspired by Milesi-Feretti and Razin (1996, hereafter ‘MFR’) and Reisen (1998) and builds on the recent empirical researches of Doisy and Hervé (2003) and Zanghieri (2004). The final section provides some concluding remarks, including several implications for economic policy in the transition regions.
82
2 Article 121 of the Treaty of the European Union (1992) stipulates that among other (qualitative) criteria »the
2. Current account trends and developments in transition economies
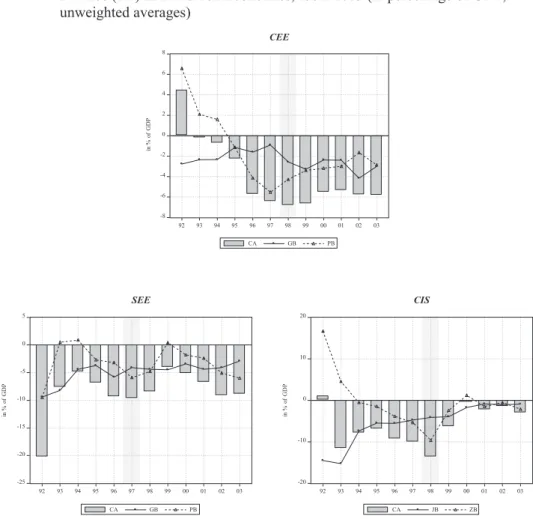
An overview of current account balances in transition economies shows that, with the exception of Russia – a major commodity exporter, the opening up to external trade has been accompanied by significant current account deficits. Nevertheless, a heterogeneous pattern in terms of the deficit level and in its dynamics both between and within transition regions is noticed. In the CEE region current account balances were not problematic with even a moderate positive balance as a share of GDP up until 1994 (averaging at around 1 percent of GDP), reflecting contractions in domestic demand, real exchange rate undervaluations and external financing constraints (see Figure 1). Afterwards, significant current account deficit deterioration was seen in the region, peaking at almost 7 percent of GDP in 1998 on average (e.g. Lithuania (11.7), Latvia (10.7) and Slovakia (9.6)), mostly as a result of growing imports of both consumption and investment goods. Moreover, the gradual growth of the current account deficit in the CEE region reflects a combination of long-term growth and structural factors, external shocks and domestic policies. More precisely, the deterioration of current accounts in the region was the result of the growth in merchandise trade deficits, downward trends in the service balance, rising indebtedness and profit repatriation as well as the consequence of the continuous real appreciation of domestic currency in most cases examined.3
Similar but even more intensive current account deficit dynamics were seen in the Commonwealth of Independent States (CIS) region by it achieving the top average current account deficit at a significantly higher level (13.7 percent of GDP) than the CEE region in 1998. The biggest contributors to such a huge deterioration in the current account balance were some economies in the region with current account deficits above 30 percent of GDP (e.g. Turkmenistan (37.4), Azerbaijan (30.7)). Several factors contributed to this development. First, many countries in the region experienced large losses in their terms of trade as prices for energy imports from the former Council for Mutual Economic Assistance (CMEA) trading partners moved to market-determined levels. Second, these countries ran high negative fiscal imbalances as the authorities tried to absorb the revenue and expenditure pressure associated with sharpfalls in national income and fiscal restructuring (see Figure 1). Third, as a result of the slow progress in building a competitive and diversified export sector trade liberalisation mainly stimulated imports of consumer goods and services. As a response to the Russian crisis (1998) the average current account deficits narrowed in the group. However, in many cases the deficits remained high – at around or even above 10 percent of GDP (Azerbaijan (15.9), Armenia (8.1) etc.) on
83
3 In transition economies a large part of real appreciation accounts for the real appreciation that reflects
average in the 2001-2003 period.4 On the other hand, the Southern and Eastern Europe (SEE) region achieved the highest average current account deficit with around 20 percent of GDP in 1992 due to the enormous deficit in Albania (68.5 percent). Later these huge external imbalances improved significantly. However, at the beginning of the second half of the 1990s and in the first few years of this century they again deteriorated, mainly due higher oil prices, import demand, which has been fuelled by the rapid growth in credit for the non-government sector (in Bulgaria), political uncertainty (in Serbia and Montenegro) and conflict/violence crisis (in Macedonia). Consequently, the average current account deficit was at 8.2 percent of GDP in the 2001-2003 period in comparison with the previous three years when it averaged out at 5.9 percent of GDP (see Figure 1).5
As already mentioned, one of the most important determinants of the increasing external imbalances has been the worsening budgetary performance in transition economies (see Aristovnik and Zajc, 2001, and Fidrmuc, 2003). The patterns in public deficits reflect local factors as well as the mixed advice transition economies received from Western economies and institutions such as the IMF and the WB. An analysis of the fiscal data of transition economies yields several stylized facts. Most importantly, almost all transition economies went through a dramatic fiscal adjustment. In fact, the turnaround in fiscal imbalances has been especially remarkable for CIS economies which reduced their average deficits from an average of 8.8 percent of GDP in the 1992-1997 period to a moderate fiscal deficit of 2.1 percent of GDP in the 1998-2003 period. The extent of this fiscal adjustment in CIS is more than twice as much as that of SEE economies whose average deficit was reduced from 5.9 percent of GDP to 3.9 percent of GDP in the same period. These fiscal imbalance trends were the outcome of a major revenue shock at the start of transition. For many CIS economies, independence from the Soviet Union also meant the loss of large fiscal transfers from Moscow which further compounded declines in government revenues from the recession and the flawed tax system with its weak administration.6Consequently, the CIS’ average budget revenues declined from 29.3 percent of GDP in 1992 to 24.1 percent of GDP in 2003. Contrary to the CIS and SEE fiscal imbalance trends, CEE economies started with much lower average fiscal deficits, averaging out at 1.8 percent of GDP in 1992-1997 and even deteriorating to an average 3 percent of GDP in 1998-2003, generally as a result of maintaining relatively high government expenditure shares (an average of 38.3 percent of GDP in the 1998-2003 period) and a moderate decline of government revenues in the period
84
4 The selected CIS economies, later included in the empirical analysis, were generally confronted with relatively
low average current account deficits (Kazakhstan with -2.7 percent of GDP)) and even surpluses (Russia (9.2), Ukraine (5.7) and Uzbekistan (1.9)) in the 2001-2003 period. The only exception is Moldova with an average deficit of -6.6 percent of GDP in the same period.
5 In fact, all SEE economies faced a moderate, i.e. up to 1 percentage point (like Albania, Croatia and Romania) or
even a significant, i.e. more than 3 percentage point (like Bosnia and Herzegovina, Bulgaria, Macedonia, and Serbia and Montenegro) deterioration of their average current account position when comparing both three-year periods.
6 For example, in 1992 both Uzbekistan and the Kyrgyz Republic lost transfers from Moscow which were
(e.g. in Czech Republic and Poland by more than ten structural points in the 1992-2003 period). An important measure to deal with the revenue shortfall was the adoption of value-added tax (VAT). The rate initially adopted has generally been reduced, and in most CEE states VAT now provides about the same proportion of total fiscal revenue as in most Western European states (i.e. 15 to 25 percent). Moreover, a number of CEE and SEE economies have introduced, or are in the process of introducing, uniform personal income taxes.
Figure 1: Average Current Account Balance (CA), Fiscal Balance (GB) and Private Balance (PB) in Transition Economies, 1992-2003 (in percentage of GDP; unweighted averages)
Sources: WDI, 2004; EIU, 2004; EBRD, 2004; own calculations.
Note: CEE (Czech Republic, Estonia, Hungary, Latvia, Lithuania, Poland, Slovakia and Slovenia) SEE (Albania, Bosnia and Herzegovina, Bulgaria, Croatia, Macedonia, Romania, and Serbia
and Montenegro)
CIS (Armenia, Azerbaijan, Belarus, Georgia, Kazakhstan, Kyrgyz, Moldova, Russia, Tajikistan, Turkmenistan, Ukraine and Uzbekistan).
In the view of the uncertainties regarding saving and investment behavior in transition regions, the role of fiscal policy needs to have a built-in degree of flexibility to counterbalance potential saving-investment imbalances and the vulnerability implied by large external current account deficits. However, for the CEE economies the European Union (EU) has placed an emphasis on low budget deficits but at the same time it requires the adoption of a number of relatively costly social program and structural measures, which places upward pressure on government expenditure. Moreover, in light of the forthcoming adoption of the euro in many CEE economies the Maastricht fiscal deficit criteria should be reconsidered as these economies might risk hampering the development of baldy needed infrastructure and achieving the so-called ‘Golden Rule capital-labor ratio’.7 Nevertheless, the sustainability of an economy’s fiscal balance has important implications for the sustainability of its external position. In transition economies, sizable fiscal deficits have generally not been offset by higher private saving and have consequently been reflected in large current account deficits (see Figure 1). In fact, for many economies in transition government budget deficits have been financed in large measure through external borrowing in a foreign currency, with most of the outstanding stock of external debt in each country being owed by the government. In reality, sizable external borrowing to finance productive investment may be appropriate when large potential returns from investment are expected and confronted with the relatively high cost of domestic finance.8
Overall, the historical current account deficits and their most likely future persistence in these economies raise the question of whether they constitute a problem from an economic perspective, e.g. whether they are sustainable in the medium term. However, before trying to answer this question let us undertake a review of recent theoretical and empirical considerations of the current account balance and its sustainability.
3. Views on the current account balance and its sustainability
3.1. Do current account deficits matter?
Edwards (2001) in his comprehensive review describes the evolving views of economists’ regarding the nature and consequences of current account deficits. The attitude has changed from ‘the current account matters’ to ‘the current account deficit
86
7 The ‘golden rule’ is the level of capital-labor ratio that maximizes consumption per worker in the steady state.
Kandogan (2004) set out that capital-labor ratios in transition economies significantly lag behind those of the EU-15 economies. For example, Germany has a capital-labor ratio that is more than 2.5 times higher than Slovenia, 5 times higher than Slovakia and around 12 times higher than Bulgaria and Latvia.
8 One of the most important problematic aspects of public finance in many transition economies is the increasing
does not matter as long as the public sector is in balance’, then to ‘the current account deficit may matter’. In fact, in the 1970s this elastic approach to the current account was been placed on the backburner and attention was switched to the intertemporal properties of current account deficits. In terms of national accounting, the current account is simply the difference between national saving and investment. Since both saving and investment are inherently intertemporal phenomena, e.g. saving with respect to the lifetime of individuals and investment with respect to the expected future return on investment, the same must also hold for the current account.
In this respect, Obstfeld and Rogoff (1996) provided an extensive review of modern models of the current account that assume intertemporal optimisation on behalf of consumers and firms. In this type of model (assuming a constant interest rate), consumption smoothing across periods is one of the fundamental drivers of the current account. According to the intertemporal approach, if output falls below its permanent value there will be a higher current account deficit. Similarly, if investment increases above its permanent value the current account deficit will grow. The reason for this is that new investment projects will be partially financed by an increase in foreign borrowing, thus generating a bigger current account deficit. Likewise, increased government consumption will result in a higher current account deficit. If the constant world interest rate assumption is relaxed, a country’s net foreign asset position and the level of the world interest rate will fundamentally affect the current account deficit. Accordingly, if a country is a net foreign debtor, and the world interest rate exceeds its permanent level, the current account deficit will be higher (Miller, 2002).
During the last three decades most financial crises highlighted the part played by large current account deficits in the run-upto crisis episodes. Consequently, the concept of a sustainable current account deficit became an important theoretical, political and economic issue. In this respect, Corsetti et al. (1998) concluded that, on the whole, those countries hit hardest by currency crises were those which had persistent current account deficits throughout the 1990s.9This result is confirmed by Radelet and Sachs (2000), Kamin et al. (2001) and Edwards (2004), whereby Edwards shows that the probability of experiencing abrupt current account reversals is closely linked to the size of current account deficits. Accordingly, although this is not a universal truth, the conventional wisdom is that current account deficits above 5 percent of GDP generally represent a problem, especially if funded through short-term borrowing.10 However, because of the lasting improvement in capital market access, the persistent enhancement of the terms of trade and productivity growth, as seen in transition economies, can as predicted by the intertemporal models finance moderate current account deficits on an ongoing basis. Nevertheless, Edwards (2001) supported the relevancy of current account imbalances as there is
87
9 Nevertheless, this does not imply that a large deficit always leads to a crisis, nor that a crisis can only occur if a
large current account deficit is present (Summers, 2000).
10 Freund (2000) and Mann (2000) concluded from their studies of the experience of industrial countries that
strong evidence that large current account deficits should be a cause for concern of economic policy.
3.2. Solvency, sustainability and excessive current account imbalances
According to MFR (1996), three different yet interrelated concepts can be distinguished: an economy’s solvency, current account sustainability and current account deficit excessiveness. In fact, the three concepts of current account deficits imply an increasing order of restrictiveness. First, an economy is treated as solvent if the present discounted value of the future trade surplus is equal to the current external indebtedness. Ultimately, such a definition is difficult to apply since it relies on future events/policy decisions without imposing any ‘structure’ on them. Second, a more narrowed definition of solvency brings us to a more widespread idea i.e. the definition of sustainability. A current account is sustainable if the continuation of the current government policy stance and/or of the present private sector behaviour will not entail a need for a ‘drastic’ policy shift or a balance of payments (currency) crisis.11Finally, an unsustainable deficit should be distinguished from an excessive one, i.e. a deficit which is too large to be explained in the terms of any given model of consumption, investment and production. In fact, the notion of ‘excessive’ current account deficits is based of deviations from an ‘optimal’ benchmark, which can be calculated under some strict assumptions such as perfect capital mobility and efficient financial markets.12
In order to estimate current account sustainability, different approaches were developed in the last decade. The fact that the results of these have to be interpreted with caution means that their informative value is limited, however. For instance, models based on the intertemporal balance of payments theory show unrealistically large values for sustainable current account balances.13While the results improve if credit restrictions and portfolio processes are taken into consideration, even minor changes in portfolio preferences lead to substantial changes in sustainable deficits. Moreover, on the whole these models are very sensitive to the choice of parameters, and estimating the relevant coefficients is fraught with a high degree of uncertainty. In some cases, particularly in transition economies, problematic data availability makes it even more difficult to define these approaches empirically.
The most common way of assessing a given economy’s external position was developed by MFR (1996) who modelled a framework to analyse current account
88
11 A similar notion of current account sustainability has been applied by many researchers such as Obstfeld and
Rogoff (2000), Holman (2001), Megarbane (2002) and Zanghieri (2004).
12 The appraisal of the excessiveness of current account deficits frequently consists of setting a benchmark from the
medium- and long-term determinants of the saving-investment balance. See, for instance, Isard et al., 2001, and BussiPre et al., 2004.
13 Obstfeld and Rogoff (1996), for example, developed a model where the steady state trade surplus is 45 percent of
sustainability, where the ‘sustainable’ level of the current account was that level consistent with solvency, i.e. satisfies the criterion that the total external debt to GDP ratio should not increase.14In fact, they used standard accounting identities to present the notion of intertemporal solvency, emphasising in particular the role of real domestic growth (g), real interest rates (r*) and the real exchange rate (e):
tb = 1 – i – c – g =– f (r*–g–e) (1)
wheretb,i,c,gandfare the long-run trade balance, domestic investment, private consumption, current government consumption, and external debt as a ratio to GDP, respectively. The first part of the expression reflects the fact that the economy has to be in a steady state for stabilisation of the debt to GDP ratio to correspond to a sustainable trade balance. The latter part of the expression indicates the role played by the average future value of world interest rates, domestic growth and the long-run trend in the real exchange rate in determining the resource transfers needed to keep the debt to GDP ratio from increasing.
Condition (1) also indicates that the economy’s long-run absorption can be higher than its income only if the economy is a net creditor. On the other hand, net debtor economies, like transition economies, have to run long-run trade surpluses and pay the interest on its external liabilities in order for the foreign debt to GDP ratio to remain constant. In addition, higher economic growth and real exchange rate appreciation or a lower real interest rate can sustain a larger debt to GDP ratio.
Later Reisen (1998) built on the work of MFR (1996) and Edwards et al. (1996) by considering the portfolio approach to the current account. When the economy is in a steady state, the current account deficit,cad, which can be sustained over the long run if the desired debt ratio, f*, remains constant and the desired reserves, FX*, rise in
proportion to import growth,h, is expressed as follows:
(
)
cad= + f - + - FX
+ é ë
ê ùûú
g e h e g
g
* *
1 (2)
Equation (2) assumes two important things. First, the economy might want to hold a constant foreign reserves to import ratio. Second, due to world inflation or, for example, the Balassa-Samuelson effect, a transition economy’s real exchange rate can become overvalued and provoke the reduction of both debt and foreign reserves. Therefore, sustainable current account deficits vary across economies and depend on the variables that affect portfolio decisions as well as economic growth. For instance, Reisen (1998) investigated current account deficits of four Latin American and four Asian economies and ascertained that sustainable current account deficits lie in the range of -1.6 to -3.8 percent of GDP. Nevertheless, such assessments are subject to
89
14 Another approach used in the literature is one that defines the sustainable current account balance as the balance
uncertainties including long-term economic prospects and demand for the debt instruments of the economy in question.
A largely unresolved question is whether net foreign direct investment (FDI) flows should be included when computing the sustainable level of the current account. FDI is generally considered more stable than other financial flows as investments in fixed assets may be more difficult to liquidate (compared with portfolio investments) and because direct investors tend to make long-term commitments (McGettigan, 2000). Besides, FDI can have a considerable and immediate positive impact on economies’ external financial positions and, thus, on their development prospects since the financial effect of FDI complements its potential technological, management and restructuring impact. Further, FDI may improve foreign perceptions of the host economy’s creditworthiness and thus contribute to the creation of a virtuous circle involving a reduction in borrowing costs, access to a broader range of financial instruments and more stable capital flows. Moreover, it is often maintained that FDI will increase an economy’s exports and improve the current account balance in the longer term (UN Economic Commission for Europe, 2001). Therefore, an increasing current account deficit financed by FDI (especially greenfield investment) should not be a cause for concern. Accordingly, one should consider FDI flows when calculating the sustainable current account balance.15
It should be emphasised that the calculation of a sustainable current account deficit is subject to some serious limitations. For instance, the steady state assumption constitutes a relatively strong assumption for transition economies inasmuch as it requires that future structural changes in an economy are foreseeable or, alternatively, that the current state of the economy can be considered as the steady state. Hence, it is hard to say that the current state of the transition economy can be considered as a steady state while it is adjusting its the economic system to a fully-fledged market system. Further, sustainability calculations neglect some important aspects of the issue of how the current account adjusts to a shock, i.e. the transition from an old (long-run) sustainable current account to a new one. In fact, Sasin (2001) stated that long-run sustainability ratios computed using a theoretical framework might be misleading and it is in fact hard to conclude whether in the short-run the current account deficit is truly excessive. Therefore, caution should be exercised with respect to the results and implications of such calculations.
90
15 On the contrary, Reisen (1998) argued that the distinction between FDI and other capital account items can be
4. The empirical framework
4.1. Empirical methodology
Following the simple accounting methodology of Milesi-Ferreti and Razin (1996) (MFR) sustainable levels of current account deficits are calculated.16 Later Milesi-Ferretti et al. (1998) and Cashin and McDermott (1998) argued that the calculated sustainable level of the current account deficit may be ambiguous if we consider the possibility of a reversal (or a sudden stop) of capital flows. Accordingly, Doisy and Hervé (2003) modified identity (1) in order to consider the fact that a considerable part of transition economies’ external imbalance is financed by an almost non-debt creating instrument.17 In order to calculate the current account balance so as to allow it to be compared with the already presented accounting frameworks, not only is it necessary to consider the non-interest component of the current account balance but it is also necessary to subtract the part of the current account deficit which can be financed via non-debt creating flows such as foreign direct investment (FDI).18Moreover, for simplicity we consider that the long-term real exchange rate is constant (e=0). Hence, the sustainable primary (non-interest) current account balance as a percentage of GDP,ca’, can be written as:
ca’= – f (r*–g) – fdi (3)
wherefdiis the ratio of net FDI to GDP. However, we should bear in mind that this modified model is not an absolutely riskless form of financing the deficit. While their volatility is far less than that of other forms of capital flows, FDI inflows can experience an abrupt stop as in the case of Russia in the aftermath of the 1998 crisis (see McGettigan, 2000).
In transition economies a general tendency for real appreciation over the last decade has been noticed. This tendency appears to be partly due to the undervaluation of their currencies at the outset of the transition period and partly due to shifts in macroeconomic fundamentals (such as productivity or technology), i.e. the
91
16 This method has been used several times by the ’IMF’s economy assessments, e.g. for Mexico (2001) and for
Slovakia (2002).
17 The average net FDI ratio to current account deficit exceeded 100% in Bulgaria, Croatia, Czech Republic,
Macedonia and Moldova, and even 200% in Slovakia in the 2000-2003 period. In other countries, the net FDI ratio to current account deficits have accounted for a smaller share of financing the current account such as in Latvia (48.8), Romania (60.5), Lithuania (67.8) and Hungary (69.7) if we take into account only those countries experiencing current account deficits in the whole period 2000-2003.
18 In fact, Frankel and Rose (1996) investigated a panel of annual data for over 100 developing economies from
Balassa-Samuelson effect.19Because such an appreciation of the real exchange rate mitigates the debt dynamics for the sustainability of the current account balance it should be considered when sustainability calculations are performed. Moreover, it is reasonable to assume that the economy might want to hold a constant foreign reserve to import ratio. Accordingly, Resein’s (1998) accounting framework (2) based on the standard portfolio approach to the current account and modified with FDI to calculate long-term current account deficit sustainability is applied:
(
)
cad= + f - + - FX fdi
+ é ë
ê ù
û
ú +
g e h e g
g
* *
1 (4)
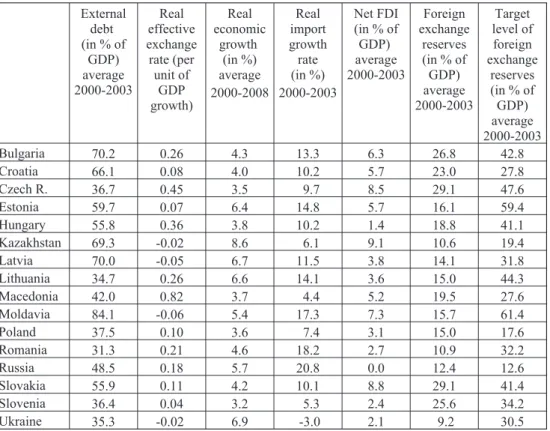
4.2. Empirical data and additional assumptions
We estimate current account sustainability for seventeen transition economies, i.e. the Czech Republic, Estonia, Hungary, Latvia, Lithuania, Poland, Slovakia and Slovenia (the CEE), Bulgaria, Croatia, Macedonia, and Romania (the SEE) and Kazakhstan, Moldova, Russia, Ukraine and Uzbekistan (the CIS).20 However, in order to calculate a sustainable level of their current account balance numerous assumptions must be made. Indeed, this exercise is, by nature, quite sensitive to the various assumptions made about what is the steady state of the economies under consideration. Arbitrarily, the steady state for transition economies is considered to reflect the historical values of the key variables as follows:
– the equilibrium level of external debt (f) is assumed to be the average of the 2000-2003 period (EBRD data); alternatively, it is assumed for all sampled economies that foreign investors are comfortable tolerating a debt ratio of 45 percent(f*);
– the average real interest rate (r*) is the last available effective interest rate on external debt deflated with the latest GDP deflator of the main advanced world economies (EIU and IMF data);
– growth projections (g) are the average over the 2000-2008 period (EIU data); – the historical drift of the real effective exchange rate per unit of GDP growth (e)
is considered the most appropriate variable since the external debt is composed of a mix of the main international currencies in proportions that are quite variable over time (IMF data);
– the target level of foreign exchange reserves (FX*) for all selected countries is assumed to be equal to the average of half the import ratio (six months of imports) of the 2000-2003 period (EBRD data);
– the real import growth rate (h) is the 2000-2003 period average ratio (EBRD data); and
92
19 Moreover, Roubini and Wachtel (1998) argued that part of real appreciation in transition economies arises from
the choice of the exchange-rate regime (e.g. a pegged exchange rate) and the ensuing capital inflows. Accordingly, the growing current account deficits might become unsustainable and demand the nominal and real depreciation of the currency.
– the average (2000-2003 period) volume of net foreign direct investment as a ratio to GDP (fdi) is taken in order to calculate the proportion of the current account deficit that has to be financed via debt-creating flows (EBRD data)21; the simplifying assumption of no feedback of FDI flows on growth is also adopted.
The assumptions underlying the projection exercises are summarized in Table 1 and 2. The empirical results are summarised in the next sub-section, which is divided into three parts. First, the simplest way of checking sustainability is applied by comparing differences between current account deficits and net FDI flows. The results for the selected transition economies in the period 1994-2003 are reported in Table 3. Secondly, MFR’s (1996) accounting methodology is applied to calculate medi-um-term current account sustainability levels for the transition economies. Finally, in order to calculate long-term current account sustainability positions Reisen’s (1998) accounting methodology is adopted. Empirical results are reported in Table 4.
Table 1: The Assumptions for Current Account Sustainability Calculations (‘MFR’ Methodology)
External debt (in % of GDP)
average 2000 - 2003
Real effective interest rate
(in %) 2003
Real economic growth
(in %) average 2000-2008
Net FDI (in % of GDP)
average 2000-2003
Bulgaria 70.2 1.9 4.3 6.3
Croatia 66.1 1.7 4.0 5.7
Czech R. 36.7 2.4 3.5 8.5
Estonia 59.7 3.6 6.4 5.7
Hungary 55.8 1.7 3.8 1.4
Kazakhstan 69.3 2.2 8.6 9.1
Latvia 70.0 6.4 6.7 3.8
Lithuania 34.7 4.1 6.6 3.6
Macedonia 42.0 7.8 3.7 5.2
Moldavia 84.1 3.0 5.4 7.3
Poland 37.5 1.0 3.6 3.1
Romania 31.3 2.8 4.6 2.7
Russia 48.5 2.9 5.7 0.0
Slovakia 55.9 2.3 4.2 8.8
Slovenia 36.4 4.6 3.2 2.4
Ukraine 35.3 5.2 6.9 2.1
Uzbekistan 42.7 4.8 2.8 0.9
Source: WDI, 2004; EIU, 2004; EBRD, 2004; author’s calculations
93
21 When considering FDI inflows two extremes are presumed. For the more advanced transition economies the
Table 2: The Assumptions for Current Account Sustainability Calculations (‘Reisen’ Methodology)
External debt (in % of
GDP) average 2000-2003 Real effective exchange rate (per unit of GDP growth) Real economic growth (in %) average 2000-2008 Real import growth rate (in %) 2000-2003 Net FDI (in % of GDP) average 2000-2003 Foreign exchange reserves (in % of GDP) average 2000-2003 Target level of foreign exchange reserves (in % of GDP) average 2000-2003
Bulgaria 70.2 0.26 4.3 13.3 6.3 26.8 42.8
Croatia 66.1 0.08 4.0 10.2 5.7 23.0 27.8
Czech R. 36.7 0.45 3.5 9.7 8.5 29.1 47.6
Estonia 59.7 0.07 6.4 14.8 5.7 16.1 59.4
Hungary 55.8 0.36 3.8 10.2 1.4 18.8 41.1
Kazakhstan 69.3 -0.02 8.6 6.1 9.1 10.6 19.4
Latvia 70.0 -0.05 6.7 11.5 3.8 14.1 31.8
Lithuania 34.7 0.26 6.6 14.1 3.6 15.0 44.3
Macedonia 42.0 0.82 3.7 4.4 5.2 19.5 27.6
Moldavia 84.1 -0.06 5.4 17.3 7.3 15.7 61.4
Poland 37.5 0.10 3.6 7.4 3.1 15.0 17.6
Romania 31.3 0.21 4.6 18.2 2.7 10.9 32.2
Russia 48.5 0.18 5.7 20.8 0.0 12.4 12.6
Slovakia 55.9 0.11 4.2 10.1 8.8 29.1 41.4
Slovenia 36.4 0.04 3.2 5.3 2.4 25.6 34.2
Ukraine 35.3 -0.02 6.9 -3.0 2.1 9.2 30.5
Source: WDI, 2004; EIU, 2004; EBRD, 2004; author’s calculations
4.3. Empirical results
4.3.1. Current account deficits and net FDI flows
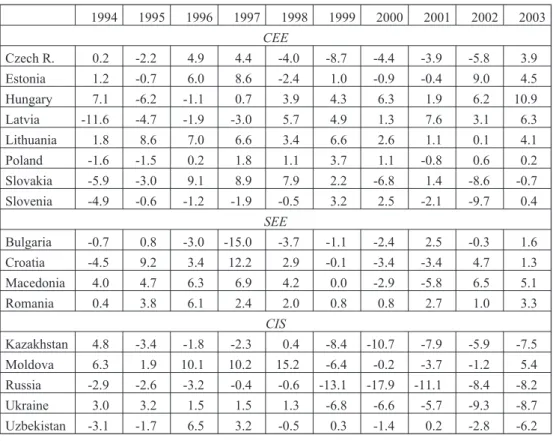
One of the simplest definitions of the current account implies that a current account position is sustainable so long as foreign investors are willing to finance it. Since FDI is generally regarded as the most stable form of inflow and contributes to an economy’s growth potential, a simple way to check for sustainability is to see how much of the deficit is financed by FDI. Table 3 shows the difference between current account deficits and net FDI flows as a ratio to GDP for the 1994-2003 period. Since a number of transition economies, particularly advanced ones, have attracted significant amounts of FDI, in general a manageable external position in the region is expected. Indeed, from this point of view external sustainability does not seem to be a problem for most of the selected transition economies.22Nevertheless, the situation in
94
22 However, the trend of differences between current account deficits and net FDI flows may have be seen as
economies such as the Baltic States, Hungary, Macedonia, Romania, and Moldova has worsened rapidly in recent years. In order to confirm these conclusions, more sustainable current account positions should be calculated by applying the accounting methodologies suggested by MFR (1996) and Reisen (1998).
Table 3: Differences between Current Account Deficits and Net FDI Flows in Selected Transition Economies, 1994-2003
- in percent (%) of GDP 1994 1995 1996 1997 1998 1999 2000 2001 2002 2003
CEE
Czech R. 0.2 -2.2 4.9 4.4 -4.0 -8.7 -4.4 -3.9 -5.8 3.9 Estonia 1.2 -0.7 6.0 8.6 -2.4 1.0 -0.9 -0.4 9.0 4.5
Hungary 7.1 -6.2 -1.1 0.7 3.9 4.3 6.3 1.9 6.2 10.9
Latvia -11.6 -4.7 -1.9 -3.0 5.7 4.9 1.3 7.6 3.1 6.3
Lithuania 1.8 8.6 7.0 6.6 3.4 6.6 2.6 1.1 0.1 4.1
Poland -1.6 -1.5 0.2 1.8 1.1 3.7 1.1 -0.8 0.6 0.2
Slovakia -5.9 -3.0 9.1 8.9 7.9 2.2 -6.8 1.4 -8.6 -0.7 Slovenia -4.9 -0.6 -1.2 -1.9 -0.5 3.2 2.5 -2.1 -9.7 0.4
SEE
Bulgaria -0.7 0.8 -3.0 -15.0 -3.7 -1.1 -2.4 2.5 -0.3 1.6 Croatia -4.5 9.2 3.4 12.2 2.9 -0.1 -3.4 -3.4 4.7 1.3 Macedonia 4.0 4.7 6.3 6.9 4.2 0.0 -2.9 -5.8 6.5 5.1
Romania 0.4 3.8 6.1 2.4 2.0 0.8 0.8 2.7 1.0 3.3
CIS
Kazakhstan 4.8 -3.4 -1.8 -2.3 0.4 -8.4 -10.7 -7.9 -5.9 -7.5 Moldova 6.3 1.9 10.1 10.2 15.2 -6.4 -0.2 -3.7 -1.2 5.4 Russia -2.9 -2.6 -3.2 -0.4 -0.6 -13.1 -17.9 -11.1 -8.4 -8.2 Ukraine 3.0 3.2 1.5 1.5 1.3 -6.8 -6.6 -5.7 -9.3 -8.7 Uzbekistan -3.1 -1.7 6.5 3.2 -0.5 0.3 -1.4 0.2 -2.8 -6.2 Source: author’s calculations
Note:difference = -ca – fdi
4.3.2. The ‘Milesi-Ferretti and Razin’ and ‘Reisen’ methodologies
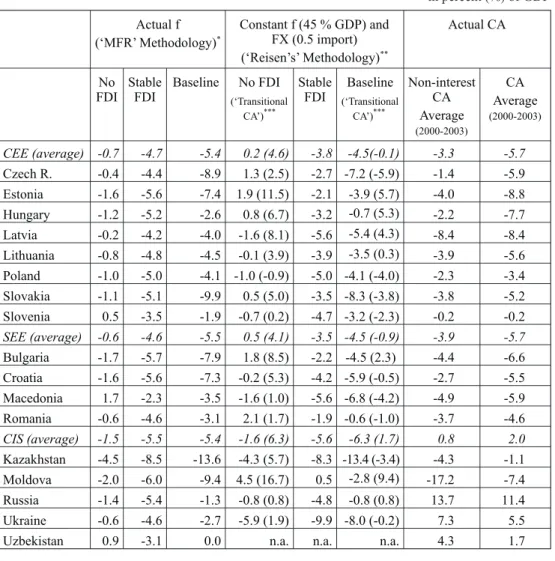
By extending the works of Doisy and Hervé (2003) and Zanghieri (2004) to a substantially larger sample of transition economies and a longer time span, sustainable current account positions were calculated and are presented in Table 4. Under the unlikely scenario of a sudden stopin FDI flows the current account deficits seem not to be sustainable for the whole sample of economies in the CEE and SEE regions. Indeed, their sustainable size as a percentage share of GDP is relatively small, fluctuating between 1.7 (Macedonia) and -1.7 (Bulgaria). The lowest sustainable current account balance, namely in Macedonia, can chiefly be explained by the fact that this economy has been projected to have one of the lowest average
growth rates of real GDP (3.7 percent p.a.) and the highest real effective interest rate among all selected transition economies (7.8 percent). On the contrary, Bulgaria is confronted with one of the lowest real effective interest rates (1.9 percent) among the transition economies and, consequently, the highest sustainable level of current account balance. On the other hand, in the CIS region only Moldova seems to have an unsustainable non-interest current account position, which recently averaged out at more than -17 percent of GDP.23
When we take into consideration the arbitrary threshold of 4 percent of GDP for future FDI flows, the observed current account deficits in the CEE and SEE regions generally reflect sustainable positions. However, Latvia (-8.4 percent of GDP) and Macedonia (-4.9) in fact have deficits that are well above the estimated sustainable levels. A similar conclusion holds for Moldova within the CIS region, which exceeds its estimated sustainable level by more than ten percentage points. This huge difference between actual and estimated sustainable current account positions in Moldova emerges in spite of it having one of the highest levels of sustainable current account deficits (-6.0 percent of GDP), induced by its relatively high ratio of external debt.
Further, if we assume that the observed average level of FDI will be kept in the medium term in the transition regions similar results to the preceding scenario are found. As far as the CEE region is concerned, the actual average non-interest current account deficits lie well below the estimated sustainable levels for the great majority of countries. Surprisingly, high levels of sustainable current account deficits are held by Slovakia and the Czech Republic (in the CEE region) with around 10 and 9 percent of GDP, respectively, and Bulgaria and Croatia (in the SEE region) in the range of 7-8 percent of GDP. These high levels do not derive from a very high average growth prospective but from the relatively low real effective interest and significant net FDI flows seen in recent years. On the contrary, due to the relatively low net FDI inflows Romania has moved beyond the sustainable level of -3.2 percent of GDP and joins Latvia, Macedonia and Moldova with their unsustainable current account positions. However, not far away and lying around half a percentage point from the unsustainable current account balance threshold are Lithuania and, not surprisingly, Hungary, with the lowest net FDI flows (averaging at 1.4 percent of GDP) in the CEE region recently.24
96
23 Despite its recent strong economic growth, averaging at more than 6.7 percent in the 2001-2003 period, Moldova
is known as the poorest (around USD 450 GDP per capita (PPP) in 2003) and one of the most highly indebted countries in Europe (averaging at around 80 percent of GDP in recent years). Not surprisingly, the EBRD (2004) is quite pessimistic about Moldova’s ability to service or reschedule its external debt in the near future and warns about its economic stability. Relative to this, in spite of the relatively high net FDI seen in recent years (almost 8 percent of GDP in the 2000-2003 period), a significant downward trend (only around 2 percent of GDP in 2003) is noticed.
24 In order to ensure the sustainability of Lithuania’s sizeable current account deficit, the ECB (2004) sets out a
Table 4: Medium- and Long-term Sustainable Current Account Balances (‘Milesi-Ferretti and Razin’ and ‘Reisen’ Methods)
- in percent (%) of GDP Actual f
(‘MFR’ Methodology)*
Constant f (45 % GDP) and FX (0.5 import) (‘Reisen’s’ Methodology)**
Actual CA
No FDI
Stable FDI
Baseline No FDI
(‘Transitional CA’)*** Stable FDI Baseline (‘Transitional CA’)*** Non-interest CA Average (2000-2003) CA Average (2000-2003)
CEE (average) -0.7 -4.7 -5.4 0.2 (4.6) -3.8 -4.5(-0.1) -3.3 -5.7
Czech R. -0.4 -4.4 -8.9 1.3 (2.5) -2.7 -7.2 (-5.9) -1.4 -5.9
Estonia -1.6 -5.6 -7.4 1.9 (11.5) -2.1 -3.9 (5.7) -4.0 -8.8
Hungary -1.2 -5.2 -2.6 0.8 (6.7) -3.2 -0.7 (5.3) -2.2 -7.7
Latvia -0.2 -4.2 -4.0 -1.6 (8.1) -5.6 -5.4 (4.3) -8.4 -8.4
Lithuania -0.8 -4.8 -4.5 -0.1 (3.9) -3.9 -3.5 (0.3) -3.9 -5.6
Poland -1.0 -5.0 -4.1 -1.0 (-0.9) -5.0 -4.1 (-4.0) -2.3 -3.4
Slovakia -1.1 -5.1 -9.9 0.5 (5.0) -3.5 -8.3 (-3.8) -3.8 -5.2
Slovenia 0.5 -3.5 -1.9 -0.7 (0.2) -4.7 -3.2 (-2.3) -0.2 -0.2
SEE (average) -0.6 -4.6 -5.5 0.5 (4.1) -3.5 -4.5 (-0.9) -3.9 -5.7
Bulgaria -1.7 -5.7 -7.9 1.8 (8.5) -2.2 -4.5 (2.3) -4.4 -6.6
Croatia -1.6 -5.6 -7.3 -0.2 (5.3) -4.2 -5.9 (-0.5) -2.7 -5.5
Macedonia 1.7 -2.3 -3.5 -1.6 (1.0) -5.6 -6.8 (-4.2) -4.9 -5.9
Romania -0.6 -4.6 -3.1 2.1 (1.7) -1.9 -0.6 (-1.0) -3.7 -4.6
CIS (average) -1.5 -5.5 -5.4 -1.6 (6.3) -5.6 -6.3 (1.7) 0.8 2.0
Kazakhstan -4.5 -8.5 -13.6 -4.3 (5.7) -8.3 -13.4 (-3.4) -4.3 -1.1
Moldova -2.0 -6.0 -9.4 4.5 (16.7) 0.5 -2.8 (9.4) -17.2 -7.4
Russia -1.4 -5.4 -1.3 -0.8 (0.8) -4.8 -0.8 (0.8) 13.7 11.4
Ukraine -0.6 -4.6 -2.7 -5.9 (1.9) -9.9 -8.0 (-0.2) 7.3 5.5
Uzbekistan 0.9 -3.1 0.0 n.a. n.a. n.a. 4.3 1.7
Source: author’s calculations Notes: *ca¢ = -f r - - fdi
(* g)
**ca¢ = - f + - + - FX fdi
+ é
ë
ê *(g e) h e g *ùûú -g
1 ;
*** ca¢ = - f -f - - - FX - - - FX fdi
+ é
ë
ê ùûú
-1
5 1
1 1
* ( g e) ( * h e )
g ; ‘Transitional’ current account
balances are in parentheses (hypothetical adjustment of the current external debt to GDP ratio to 45 percent (f*) and of foreign exchange reserves to a targeted level of half the import to GDP
ratio (FX*).
(1998) methodology is applied. Table 4 shows the results of Equation 4 for the long-term steady state current account ratio implying constant external debt and reserve levels relative to GDP. It is assumed that foreign investors tolerate a debt ratio of 45 percent (f*) and that the domestic economy has its target level of foreign exchange reserves at half the import ratio (six months of imports). The calculated steady state deficits, as shown in Table 4, fluctuate highly from the lowest levels in Romania (-0.6), Hungary (-0.7) and Russia (-0.8) to the highest sustainable levels in Kazakhstan (-13.4), Slovakia (-8.3) and Ukraine (-8.0) if current net FDI flows are taken into consideration. Again, the same as with the MFR empirical results an unsustainable current account position is found in Latvia, Romania and Moldova. However, contrary to the previous results Estonia, Hungary and Lithuania show unsustainable current account deficits, whereas Macedonia now suggests a sustainable position (due to the relatively high real appreciation and higher external debt assumption).
If we return to the results acquired using the MFR methodology, it is probably quite a strong assumption that the observed value of the debt is taken as the sustainable one, particularly in Moldova (84.1 percent of GDP in the 2000-2003 period), Bulgaria (70.2), Latvia (70.0) and Kazakhstan (69.3), whose external debt is higher by international standards. On the other hand, it is reasonable to assume that other economies like Romania (31.3), Lithuania (34.7), Ukraine (35.3), Slovenia (36.4) and the Czech Republic (36.7) could increase their external debt without prejudicing their financial stability. Therefore, a hypothetical adjustment of the current external debt to GDP ratio to 45 percent and of foreign exchange reserves to a target level of half the import to GDP ratio is considered. Not surprisingly, the resulting ‘transitional’ current account balances vary significantly between transition countries. For instance, to reach the targeted debt to GDP and reserve levels within five years the Czech Republic could afford to run a current account deficit equalling around 6 percent of GDP on average, mainly due to its low external debt ratio. On the other hand, due to its relatively high external debt and low international reserves Moldova for instance would have to run a current account surplus representing more than 9 percent of GDP (see Table 4).
To sum up, the empirical analyses show that the conventional wisdom of a current account sustainability threshold of 5 percent can easily be applied to transition economies. Nevertheless, given the limitations of the applied accounting frameworks the analysis above should be complemented in the future by a set of indicators that have been found to have predictive power in identifying unsustainable current account deficits such as the level of savings and investment, the fiscal balance, the openness of an economy, and the composition of external liabilities. In fact, jointly examining the variety of indicators found to have predictive power in a financial crisis in each particular country would give us a clearer picture of current account sustainability in the transition regions.
5.Conclusion
This article has examined the dynamics and related sustainability of current account positions of several transition countries. By using different accounting framework approaches the empirical results show that on the strict (and quite unrealistic) assumption of a sudden halt in foreign direct investment (FDI) most of the selected countries would not have a sustainable current account deficit level. More realistically, by adopting an arbitrary threshold of 4 percent of GDP for future FDI the observed current account deficit then appears to become more sustainable, although some countries still reveal unsustainable levels of current account deficits in the medium term. Similarly, on the assumption that the observed level of FDI flows will be kept in the medium run almost all the countries could optimally have a higher level of external deficit, with the exception of countries such as Baltic States, Hungary, Macedonia, Moldova and Romania. The analysis also reveals that the current account deficits of transition economies in excess of 5 percent of GDP generally pose external sustainability problems. Finally, as part of strengthening the external position the further promotion of FDI (especially greenfield investments) and a prudent fiscal policy should become necessary elements of economic policy created in the region.
To conclude, the simplicity and restrictiveness of the applied accounting frameworks and data limitations call for some additional approaches to measure the transition economies’ external sustainability. Therefore, certain other methodological approaches that encompass additional potential domestic and external indicators of current account sustainability should be considered. Moreover, case studies may even be a more appropriate way to explore the issue in further research.
References
Alam, A. and Sundberg, M. (2002) “A Decade of Fiscal Transition”, WB Policy
Research Working Paper, No. 2835
Aristovnik, A., Zajc, K. (2001) “Current Account Performance and Fiscal Policy: Evidence on the Twin Deficits in Central and Eastern Europe” IN: Economics
of Transition: Theory, Experience and EU Enlargement, 7-8 September, Berlin,
INFER Annual Conference, pp. 121-140
Bussiere, M., Fratzscher, M., and Müller G. J. (2004) “Current account dynamics in OECD and EU acceding countries – an intertemporal approach”,EIB Working
Paper Series, No. 311
Cashin, P., McDermott, J. C. (1998) “International Capital Flows and National Creditworthiness - Do the Fundamental Things Apply as Time Goes By?”,IMF
Working Papers, No. 172
Coricelli, F., Jazbec, B. (2001) “Real Exchange Rate Dynamics in Transition Economies”,CEPR Discussion Papers,No. 2869
Corsetti, G., Pesenti, P., Roubini, N. (1998) “What Caused the Asian Currency and Financial Crisis? Part I: A Macroeconomic Overview”,NBER Working Paper, No. 6833
de Cordoba, G. F., Kehoe, T. J. (2000) “Capital Flows and Real Exchange Rate Fluctuations Following Spain’s Entry Into the European Community”,Journal
of International Economics, 51(1), pp. 49-78
Dadush, U., Dhareshwar, A., Johannes, R. (1994) “Are Private Capital Flows to Developing Countries Sustainable?”,WB Policy Research Working Paper, No. 1397
Doisy, H., Hervé, K. (2003) “Les implication des deficits ciurants des PECO”,
Economies Internationale, 95, pp. 59-88
EBRD (2004)Transition Report 2004, London: EBRD
ECB (2004)Convergence Report 2004, Frankfurt: ECB
Edwards, S., Steiner, R., Losada, F. (1996) “Capital Inflows, the Real Exchange Rate and the Mexican Crisis of 1994”, E: Sautter, H., and Schinke R.(eds.)
Stabilization and Reform in Latin America: where Do We Stand?, Vervuert:
Frankfurt
Edwards, S. (2001) “Does the Current Account Matter?”,NBER Working Paper, No. 8275
Edwards, S. (2004) “Thirty Years of Current Account Imbalances, Current Account Reversals and Sudden Stops”,NBER Working Paper, No. 10276
Fidrmuc, J. (2003) “The Feldstein-Horioka Puzzle and Twin Deficits in Selected Economies”,Economics of Planning, 36, pp. 135-152
Frankel, J. A., Rose, A. K. (1996) “Currency Crashes in Emerging Markets: An Empirical Treatment”,International Finance Discussion Papers, No. 534
Freund, C. L. (2000) “Current Account Adjustment in Industrialized Countries”,
International Finance Discussion Papers, No. 692
Holman, J. A. (2001) “Is the Large US Current Account Deficit Sustainable?”,
Federal Reserve Bank of Kansas City Economic Review, 86(1), pp. 5-23
IMF (2001)Mexico: Selected Issues. Washington: IMF (Country Report, 01/191) Isard, P., Faruquee, H., Kimcaid, R. G., Fetherston, M. (2001) “Methodology for
Current Account and Exchange Rate Assessments”, IMF Occasional Paper, No. 209
Kamin, S. B., Schindler, J. W., Shawna, S. L. (2001) “The Contribution of Domestic and External Factors to Emerging Market Devaluation Crisis: An Early Warning System Approach”, FBR International Finance Discussion Paper, No. 711
Kandogan, Y. (2004) “Trade creation and diversion effects of Europe’s regional liberalization agreements”, University of Michigan-Flint Working paper, No. 07
Mann, C. L. (2000) “Perspectives on the U.S. Current Account Deficit And Sustainability”, Journal of Economic Perspective, 16(3), pp. 131-152
McGettigan, D. (2000) “Current Account and External Sustainability in the Baltics, Russia, and Other Countries of the Former Soviet Union”, IMF Occasional
Paper, No. 189
Megarbane, P. (2002) “Slovakia’s External Current Account Deficit: Why So Large and Is it Sustainable?”,Country Report, No. 02/210
Milesi-Ferretti, G.M., Razin, A. (1996) “Sustainability of Persistent Current Account Deficits”,NBER Working Paper, No. 5467
Milesi-Ferretti, G. M., Razin, A. (1998) “Current Account Reversals and Currency Crises: Empirical Regularities”,NBER Working Papers, No. 6620
Miller, N. C. (2002)Balance of Payments and Exchange Rate Theories, Cheltenham: Edward Elgar Publishing Limited
Obstfeld, M., Rogoff K. (1996) Foundations of International Macroeconomics. Cambridge, MA: MIT Press
Obstfeld, M., Rogoff K. (2000) “Perspectives on OECD Economic Integration: Implications for US Current Account Adjustment“,CIDER Working Papers, C00-116
Radelet, S., Sachs, J. (2000) “The Onset of the East Asian Currency Crisis“,NBER
Working Paper, No. 6680
Reisen, H. (1998) “Sustainable and Excessive Current Account Deficits“, OECD
Technical Papers, No. 132
Roubini, N., Wachtel, Paul (1999) “Current-Account Sustainability in Transition Economies“ IN:Balance of Payments, Exchange Rates, and Competitiveness in
Transition Economies, Kluwer Academic Publishers, pp. 19-93
Sasin, M. (2001) “Predicting Currency Crisis: the Ultimate Significance of Macroeconomic Fundamentals in Linear Specifications with Nonlinear Extensions“,CASE S&A
Summers, L. H. (2000) “International Financial Crises: Causes, Prevention, and Cures”,American Economic Review, 90 (2), pp. 12-28.
Svejnar, J. (2002) “Transition Economies: Performance and Challenges”,Journal of Economic Perspectives, 16(1), pp. 3-28.
UN Economic Commission For Europe (2001)Economic Survey of Europe.Geneve: UN (No. 1)
Zanghieri, P. (2004) “Current Account Dynamics in New EU Members”, CEPII
Working Paper, No. 2004-07
OdrSivost deficita tekuæeg raèuna platne bilance odabranih tranzicijskih zemalja
Aleksander Aristovnik1
Saetak
Èlanak istraOuje da li problem visokih deficita tekuæeg raèuna platne bilance odabranih tranzicijskih zemalja posljednjih godina, vidljiv kao simptom dinamièke ekonomske aktivnosti procesa ekonomske konvergencije predstavlja izvor makekonomske destabilizacije. S obzirom na moguænost znaèajnog smanjenja tijeka kapitala, ukljuèujuæi njihovo ogranièenje i lekcije na temelju posljednjih financijskih kriza, dinamika i visina deficita tekuæeg raèuna mora se paOljivo pratiti i u tranzicijskoj regiji. U tom pogledu analizirana je problematika ‘odrOivosti tekuæeg raèuna’ u sedamnaest tranzicijskih zemalja. U tu svrhu koristile su se dvije obraèunske metode (Milesi-Ferreti i Razin, 1996; Reisen, 1998), koje se temelje na odreðenim strogim pretpostavkama. Rezultati pokazuju, da ukoliko se nastavi promatrana razina tijekova direktnih stranih investicija u srednjem roku, gotovo sve tranzicijske zemlje mogu odrOavati veæe razine deficita tekuæeg raèuna, osim Maðarske, Makedonije, Moldavije, Rumunjske i baltièkih zemalja. Prema tome, odrOavanje relativno visokog priljeva direktnih stranih investicija (osobito tzv. ‘greenfield’ investicija) treba biti jedan od kljuènih prioriteta u osiguravanju buduæe vanjske odrOivosti nacionalne ekonomije. Na kraju, rezultati analize ukazuju da ukoliko deficit tekuæeg raèuna platne bilance preðe granicu od 5% BDP-a tada uglavnom predstavlja problem vanjske odrOivosti deficita tranzicijskih zemalja.
Kljuène rijeèi: tranzicijske zemlje, deficit tekuæeg raèuna, odrOivost, direktne strane investicije
JEL klasifikacija: F32, F47
102
1 Doktor znanosti, Sveuèilište u Ljubljani, Fakultet za upravu, Gosarjeva 5, 1000 Ljubljana, Slovenia.